BNB Dips to $744 as RSI Nears Overbought Zone
QuoteReporter
•2 min read
BNB Dips to $744 as RSI Nears Overbought Zone
BNB (BNB/USD) | September 07, 2026 $744.0500 -1.12%
🔍 Technical Analysis
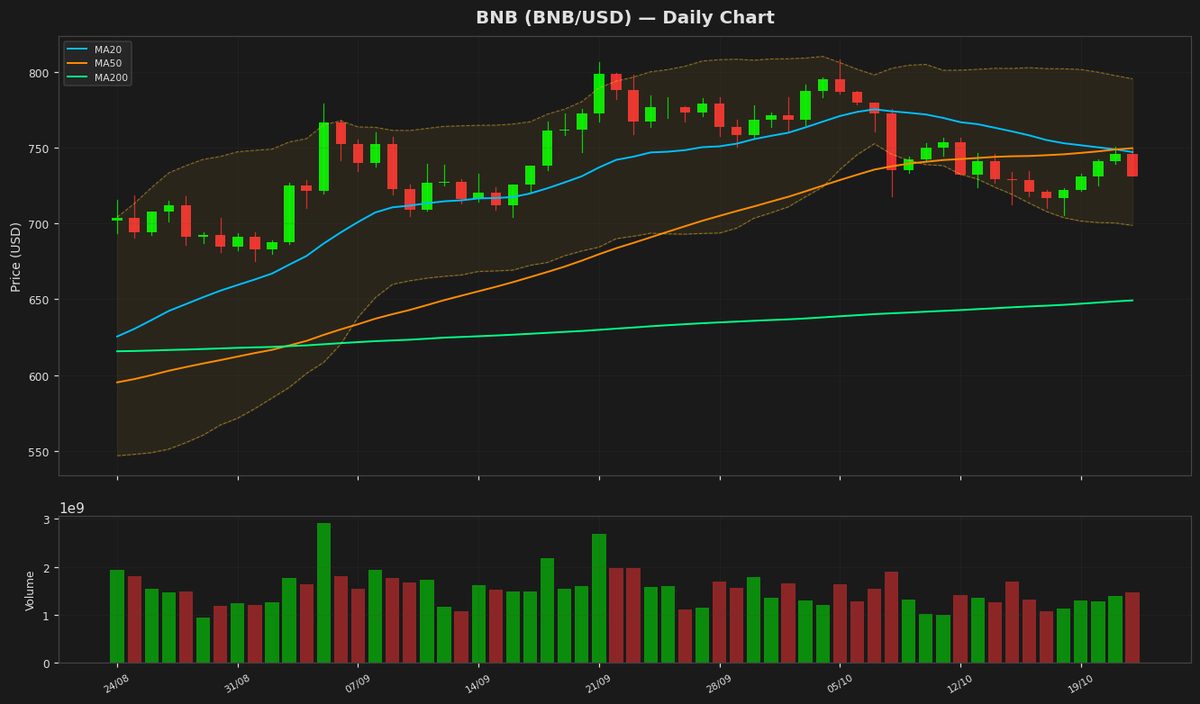
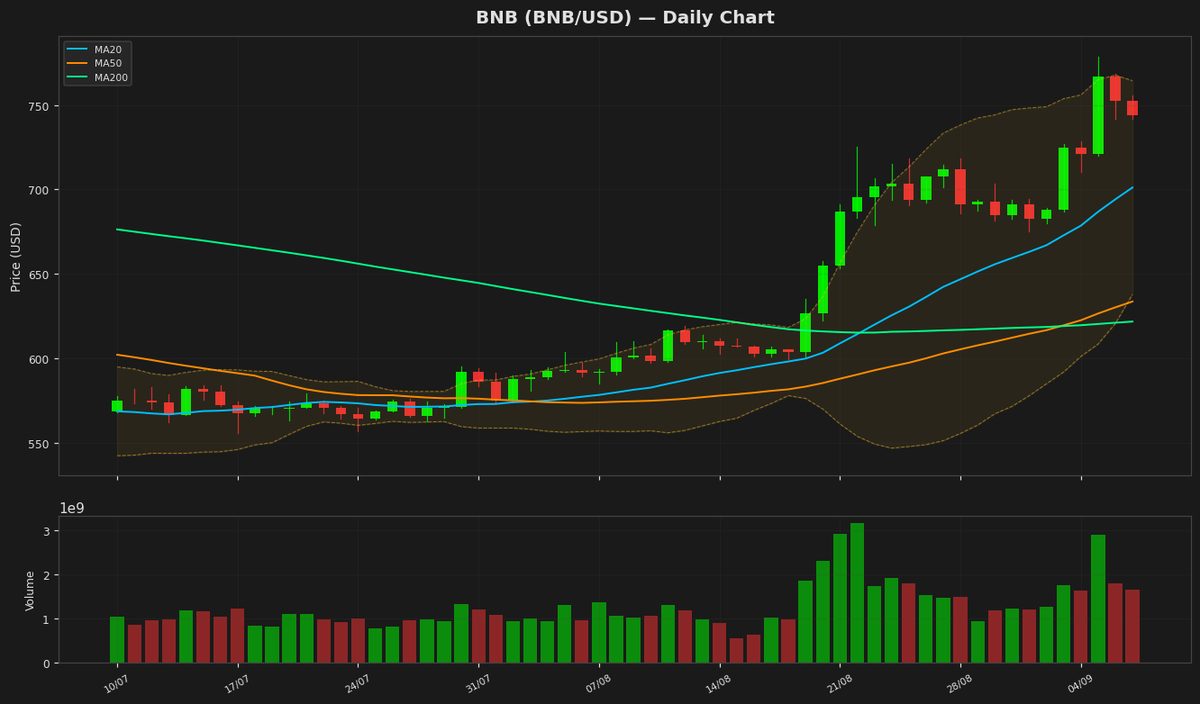
BNB is currently trading at $744.05, down 1.12% on the day, showing mild bearish pressure after recent gains. The price remains above all key moving averages, with the MA20 at $701.18, MA50 at $633.66, and MA200 at $621.78, indicating a strong bullish trend in the medium to long term. The Bollinger Bands show the upper band at $764.43 and the lower band at $637.93, with price hovering near the upper band, suggesting potential resistance at $764. A break above this level could signal further upside, while a rejection may lead to a retest of the MA20. The RSI at 60.80 is in bullish territory but not overbought, leaving room for additional gains. The MACD histogram at 31.23 remains above the signal line at 28.02, confirming bullish momentum. Key support levels are at $700 (MA20) and $633 (MA50), while resistance is at $764 (upper Bollinger Band) and the 52-week high of $954.86. The ATR of 22.57 indicates moderate volatility. Overall, BNB's trend remains bullish, but a close above $764 is needed to confirm further upward movement.
Technical Metrics
| Metric | Value |
|---|---|
| Current Price | $744.0500 |
| Daily Change | -1.12% |
| MA 20 | $701.1798 |
| % from MA20 | +6.11% |
| MA 50 | $633.6631 |
| % from MA50 | +17.42% |
| MA 200 | $621.7830 |
| % from MA200 | +19.66% |
| BB Upper | $764.4269 |
| % from BB Upper | -2.67% |
| BB Lower | $637.9328 |
| % from BB Lower | +16.63% |
| RSI (14) | 60.80 |
| MACD | 31.231356 |
| MACD Signal | 28.015598 |
| ATR (14) | 22.565216 |
| 3-Day High | $778.8105 |
| 3-Day Low | $719.7527 |
| 52-Week High | $954.8583 |
| % from 52W High | -22.08% |
| 52-Week Low | $538.5992 |
| % from 52W Low | +38.15% |
| YTD High | $954.8583 |
| % from YTD High | -22.08% |
| YTD Low | $538.5992 |
| % from YTD Low | +38.15% |
📊 Market Commentary
BNB is currently trading at $744.05, down 1.12% today, as the broader crypto market experiences mild consolidation. The Relative Strength Index (RSI) at 60.8 suggests a neutral to slightly bullish momentum, neither overbought nor oversold. Over the past 52 weeks, BNB has ranged between $538.60 and $954.86, indicating significant volatility but also strong resilience, particularly given its utility within the Binance ecosystem.
Market sentiment appears cautiously optimistic, supported by steady demand for BNB’s use cases, including transaction fee discounts and participation in Binance Launchpad projects. Traders are closely watching the $750 level, which has acted as both support and resistance in recent weeks. A sustained break above this zone could signal renewed buying interest, while failure to hold may see a retest of the next key support near $700.
The $950–$955 range remains a critical psychological and technical barrier, representing the yearly high. On the downside, the $650–$680 zone has provided strong buying interest in past pullbacks. Macro factors, including regulatory developments around Binance and broader crypto market trends, continue to influence trader positioning. For now, BNB’s price action remains range-bound, with traders monitoring volume shifts and ecosystem developments for directional cues.
Market sentiment appears cautiously optimistic, supported by steady demand for BNB’s use cases, including transaction fee discounts and participation in Binance Launchpad projects. Traders are closely watching the $750 level, which has acted as both support and resistance in recent weeks. A sustained break above this zone could signal renewed buying interest, while failure to hold may see a retest of the next key support near $700.
The $950–$955 range remains a critical psychological and technical barrier, representing the yearly high. On the downside, the $650–$680 zone has provided strong buying interest in past pullbacks. Macro factors, including regulatory developments around Binance and broader crypto market trends, continue to influence trader positioning. For now, BNB’s price action remains range-bound, with traders monitoring volume shifts and ecosystem developments for directional cues.
Disclaimer
The content on MarketsFN.com is provided for educational and informational purposes only. It does not constitute financial advice or investment recommendations. All investments involve risk. Cryptocurrency markets are highly volatile. Past performance does not guarantee future results.