Bitcoin Tests Resistance at $83K as RSI Nears Overbought
QuoteReporter
•2 min read
Bitcoin Tests Resistance at $83K as RSI Nears Overbought
Bitcoin (BTC/USD) | September 30, 2026 $83,010.4297 -0.73%
🔍 Technical Analysis
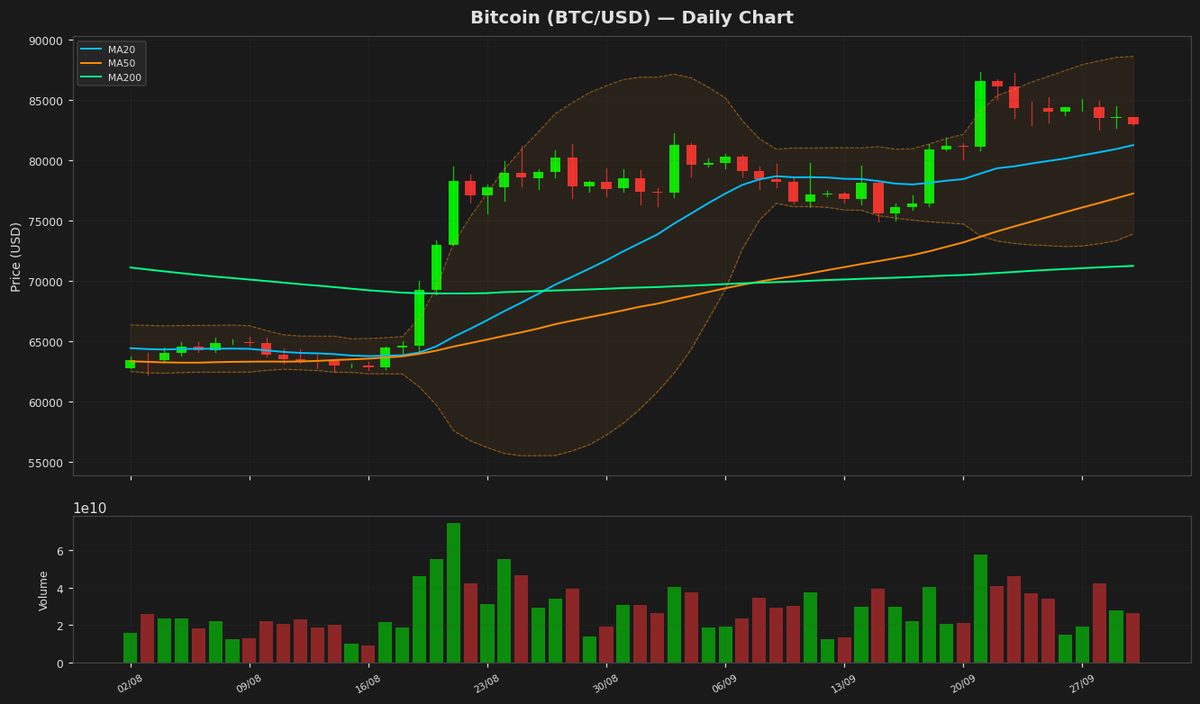
Bitcoin (BTC) is currently trading at $83,010, showing a slight daily decline of 0.73%. The price remains above key moving averages, with the MA20 at $81,273, MA50 at $77,261, and MA200 at $71,260, indicating a strong bullish trend. The Bollinger Bands suggest heightened volatility, with the upper band at $88,631 and the lower band at $73,915. The price hovering near the upper band signals potential overbought conditions, though the uptrend remains intact. The RSI(14) at 72.4 confirms overbought territory, suggesting a possible short-term pullback or consolidation. The MACD histogram shows a bearish crossover, with the MACD line at 2027.19 below the signal line at 2186.64, indicating weakening momentum. Key support levels to watch are $81,273 (MA20) and $77,261 (MA50), while resistance lies at $88,631 (Bollinger Upper Band) and the recent 52-week high of $91,100. The ATR(14) at 2218.37 reflects moderate volatility. Bitcoin's year-to-date performance remains strong, with the YTD high at $97,860 and low at $57,747. Traders should monitor these levels for potential breakout or reversal signals, especially given the overbought RSI and MACD divergence.
Technical Metrics
| Metric | Value |
|---|---|
| Current Price | $83,010.4297 |
| Daily Change | -0.73% |
| MA 20 | $81,273.1176 |
| % from MA20 | +2.14% |
| MA 50 | $77,261.1166 |
| % from MA50 | +7.44% |
| MA 200 | $71,260.0232 |
| % from MA200 | +16.49% |
| BB Upper | $88,630.7791 |
| % from BB Upper | -6.34% |
| BB Lower | $73,915.4560 |
| % from BB Lower | +12.30% |
| RSI (14) | 72.40 |
| MACD | 2027.187221 |
| MACD Signal | 2186.636319 |
| ATR (14) | 2218.367188 |
| 3-Day High | $84,972.6641 |
| 3-Day Low | $82,570.7188 |
| 52-Week High | $91,100.2500 |
| % from 52W High | -8.88% |
| 52-Week Low | $57,747.7656 |
| % from 52W Low | +43.75% |
| YTD High | $97,860.6016 |
| % from YTD High | -15.17% |
| YTD Low | $57,747.7656 |
| % from YTD Low | +43.75% |
📊 Market Commentary
Bitcoin (BTC) is currently trading at $83,010.4297, down 0.73% today, as the market shows signs of consolidation following recent gains. The Relative Strength Index (RSI) at 72.4 indicates that BTC is approaching overbought territory, which could prompt short-term profit-taking or sideways movement. Over the past 52 weeks, Bitcoin has ranged between $57,747.7656 and $91,100.2500, with the current price sitting closer to the upper bound, reflecting strong bullish momentum in the medium to long term.
Market sentiment remains cautiously optimistic, supported by institutional interest and macroeconomic factors such as potential Fed rate cuts later this year. However, traders are closely monitoring the $84,000–$85,000 resistance zone, a key level that could determine whether BTC retests its all-time high near $91,100. On the downside, immediate support lies around $80,000, followed by the psychologically important $75,000 level. A break below $80,000 could signal a deeper pullback, while holding above it may reinforce bullish confidence.
Volume and open interest in derivatives markets suggest active trader participation, with many watching for shifts in momentum. The high RSI warrants attention, as a sustained overbought condition could lead to a short-term correction. Overall, Bitcoin remains in an uptrend, but traders are balancing optimism with caution, awaiting clearer signals for the next directional move. Macro developments and liquidity conditions will likely influence BTC's near-term trajectory.
Market sentiment remains cautiously optimistic, supported by institutional interest and macroeconomic factors such as potential Fed rate cuts later this year. However, traders are closely monitoring the $84,000–$85,000 resistance zone, a key level that could determine whether BTC retests its all-time high near $91,100. On the downside, immediate support lies around $80,000, followed by the psychologically important $75,000 level. A break below $80,000 could signal a deeper pullback, while holding above it may reinforce bullish confidence.
Volume and open interest in derivatives markets suggest active trader participation, with many watching for shifts in momentum. The high RSI warrants attention, as a sustained overbought condition could lead to a short-term correction. Overall, Bitcoin remains in an uptrend, but traders are balancing optimism with caution, awaiting clearer signals for the next directional move. Macro developments and liquidity conditions will likely influence BTC's near-term trajectory.
Disclaimer
The content on MarketsFN.com is provided for educational and informational purposes only. It does not constitute financial advice or investment recommendations. All investments involve risk. Cryptocurrency markets are highly volatile. Past performance does not guarantee future results.