Bitcoin Nears $84K as RSI Hits Overbought Zone
QuoteReporter
•2 min read
Bitcoin Nears $84K as RSI Hits Overbought Zone
Bitcoin (BTC/USD) | September 29, 2026 $83,845.9062 +0.41%
🔍 Technical Analysis
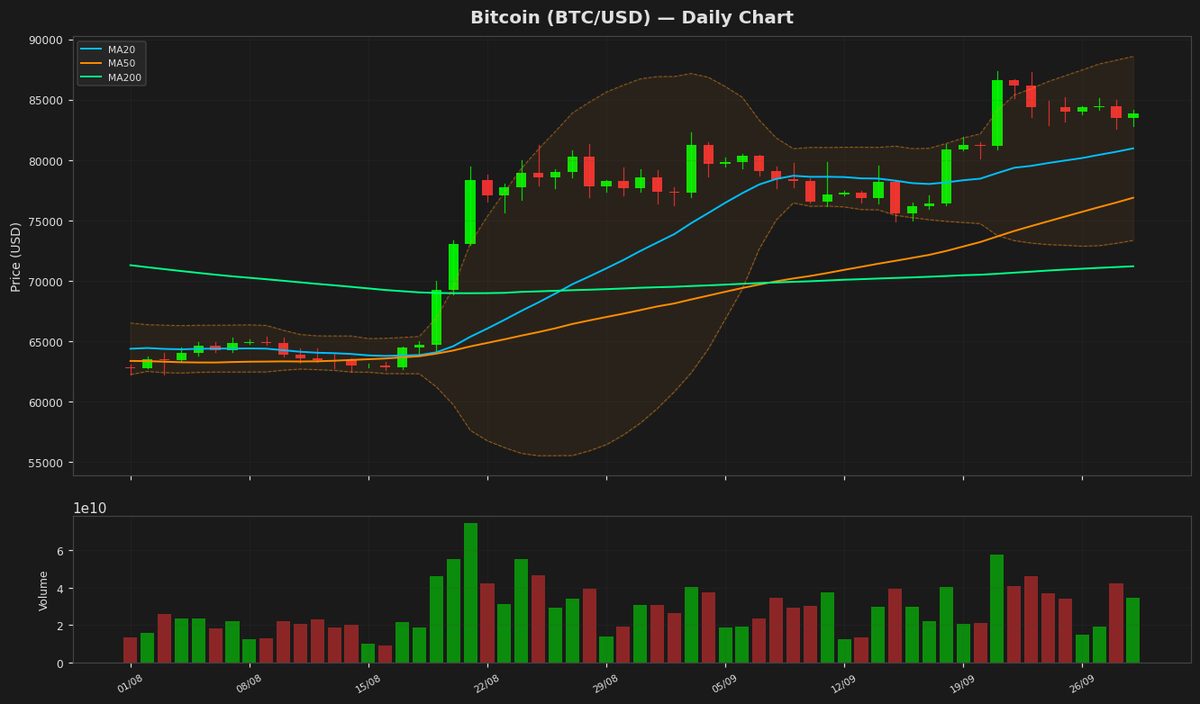
Bitcoin (BTC) is currently trading at $83,845, showing a modest daily gain of 0.41%. The price remains above all key moving averages, with the 20-day MA at $80,962, the 50-day MA at $76,876, and the 200-day MA at $71,202, indicating a strong bullish trend. The Bollinger Bands suggest heightened volatility, with the upper band at $88,576 and the lower band at $73,347. The price hovering near the upper band signals potential overbought conditions, though the uptrend remains intact. The RSI at 76.62 confirms overbought territory, which may precede a short-term pullback or consolidation. The MACD at 2210.226 is slightly below its signal line at 2230.064, hinting at a possible bearish crossover, though the histogram remains narrow, suggesting weak momentum. Key resistance levels to watch are the 52-week high at $91,100 and the YTD high at $97,860. On the downside, immediate support lies near the 20-day MA at $80,962, followed by the 50-day MA at $76,876. The ATR at 2248.714 indicates moderate volatility, reinforcing the need for caution near overbought levels. Overall, Bitcoin’s trend remains bullish, but traders should monitor RSI and MACD for signs of exhaustion.
Technical Metrics
| Metric | Value |
|---|---|
| Current Price | $83,845.9062 |
| Daily Change | +0.41% |
| MA 20 | $80,962.1762 |
| % from MA20 | +3.56% |
| MA 50 | $76,876.4151 |
| % from MA50 | +9.07% |
| MA 200 | $71,202.1616 |
| % from MA200 | +17.76% |
| BB Upper | $88,576.9417 |
| % from BB Upper | -5.34% |
| BB Lower | $73,347.4106 |
| % from BB Lower | +14.31% |
| RSI (14) | 76.62 |
| MACD | 2210.226094 |
| MACD Signal | 2230.064032 |
| ATR (14) | 2248.714844 |
| 3-Day High | $85,126.1094 |
| 3-Day Low | $82,570.7188 |
| 52-Week High | $91,100.2500 |
| % from 52W High | -7.96% |
| 52-Week Low | $57,747.7656 |
| % from 52W Low | +45.19% |
| YTD High | $97,860.6016 |
| % from YTD High | -14.32% |
| YTD Low | $57,747.7656 |
| % from YTD Low | +45.19% |
📊 Market Commentary
Bitcoin (BTC) is currently trading at $83,845.9062, up 0.41% today, as the market shows cautious optimism amid elevated momentum. The Relative Strength Index (RSI) at 76.6 indicates overbought conditions, suggesting potential near-term consolidation or pullback risk. BTC remains within its 52-week range of $57,747.7656 to $91,100.2500, with the upper bound acting as a psychological resistance level. Market sentiment is mixed, with bullish momentum tempered by concerns over overextension, particularly given the RSI’s elevated reading. Traders are closely monitoring the $85,000 level as immediate resistance, while support is eyed near $80,000, a key psychological and technical zone. A break above $85,000 could fuel further upside attempts toward the yearly high, though the overbought RSI may limit immediate gains. On the downside, a drop below $80,000 could trigger profit-taking, testing deeper support near $77,000. Institutional inflows, macroeconomic factors, and regulatory developments remain focal points for traders, with recent ETF activity and Fed policy expectations influencing near-term price action. Volume trends suggest sustained interest, but the market appears to be weighing momentum against valuation concerns. In summary, BTC’s near-term trajectory hinges on whether it can sustain its current levels amid overbought signals, with traders watching key thresholds for directional cues.
Disclaimer
The content on MarketsFN.com is provided for educational and informational purposes only. It does not constitute financial advice or investment recommendations. All investments involve risk. Cryptocurrency markets are highly volatile. Past performance does not guarantee future results.