Bitcoin Dips Below $78K as RSI Nears Overbought Zone
QuoteReporter
•3 min read
Bitcoin Dips Below $78K as RSI Nears Overbought Zone
Bitcoin (BTC/USD) | September 01, 2026 $77,878.7266 -0.85%
🔍 Technical Analysis
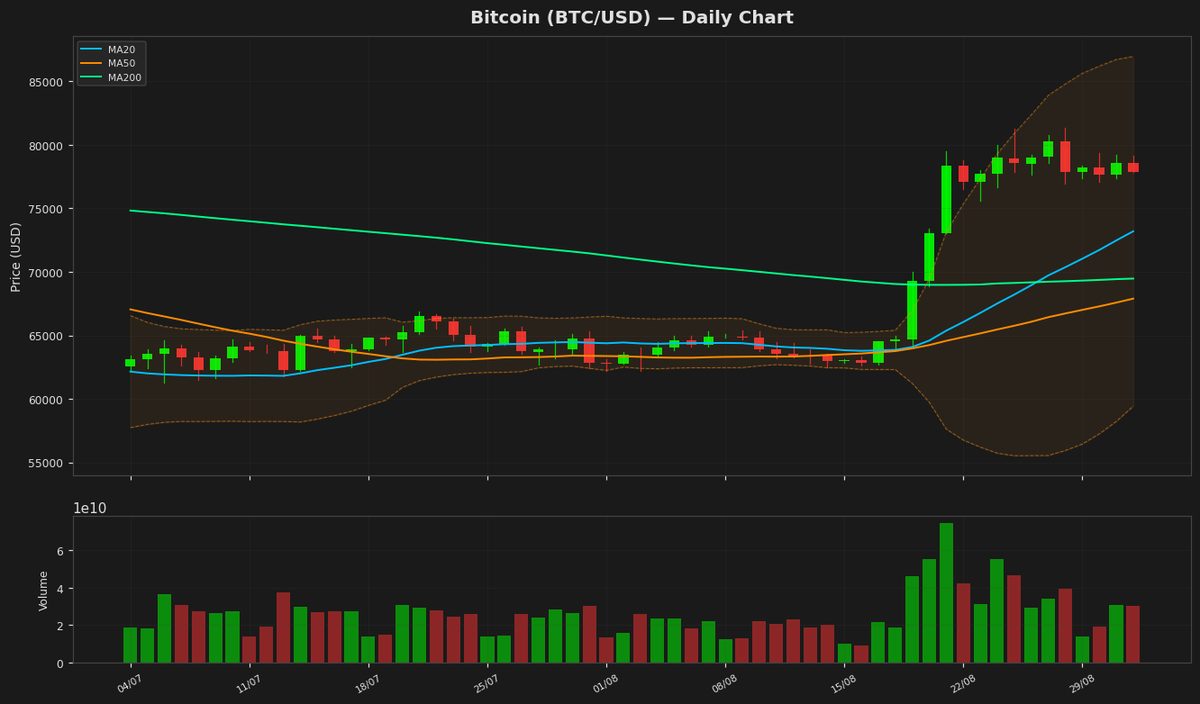
Bitcoin is currently trading at $77,878, showing a slight daily decline of 0.85%. The price remains above all key moving averages, indicating a strong bullish trend. The MA20 at $73,193 and MA50 at $67,890 are trending upward, reinforcing bullish momentum, while the MA200 at $69,470 confirms the long-term uptrend. The Bollinger Bands highlight volatility, with the upper band at $86,965 and the lower band at $59,422. The price hovering near the upper band suggests potential overbought conditions, though the uptrend remains intact. The RSI at 77.67 is in overbought territory, signaling caution for a possible pullback or consolidation. The MACD at 3624.81 remains above its signal line at 3507.47, supporting bullish momentum, but the narrowing gap suggests a potential slowdown in upward movement. Key support levels are observed near the MA20 at $73,193 and the psychological $70,000 level, while resistance is seen at the recent 52-week high of $97,860. The ATR at 3060.99 indicates high volatility, typical of Bitcoin’s price action. Traders should monitor the RSI for potential reversals and watch for a break above $80,000 to confirm further bullish momentum.
Technical Metrics
| Metric | Value |
|---|---|
| Current Price | $77,878.7266 |
| Daily Change | -0.85% |
| MA 20 | $73,193.2984 |
| % from MA20 | +6.40% |
| MA 50 | $67,890.0381 |
| % from MA50 | +14.71% |
| MA 200 | $69,470.4944 |
| % from MA200 | +12.10% |
| BB Upper | $86,964.7641 |
| % from BB Upper | -10.45% |
| BB Lower | $59,421.8328 |
| % from BB Lower | +31.06% |
| RSI (14) | 77.67 |
| MACD | 3624.811331 |
| MACD Signal | 3507.470665 |
| ATR (14) | 3060.994978 |
| 3-Day High | $79,373.1797 |
| 3-Day Low | $77,056.1484 |
| 52-Week High | $97,860.6016 |
| % from 52W High | -20.42% |
| 52-Week Low | $57,747.7656 |
| % from 52W Low | +34.86% |
| YTD High | $97,860.6016 |
| % from YTD High | -20.42% |
| YTD Low | $57,747.7656 |
| % from YTD Low | +34.86% |
📊 Market Commentary
Bitcoin (BTC) is currently trading at $77,878.73, down 0.85% today, as the market shows signs of consolidation after recent gains. The Relative Strength Index (RSI) at 77.7 indicates that BTC is in overbought territory, which could signal potential near-term pullbacks or sideways movement as traders assess the next directional move. The 52-week range of $57,747.77 to $97,860.60 highlights the significant volatility Bitcoin has experienced over the past year, with the current price sitting closer to the upper bound.
Market sentiment remains cautiously optimistic, supported by institutional interest and macroeconomic factors such as inflation concerns and potential rate cuts. However, the overbought RSI suggests some traders may be taking profits, leading to short-term pressure. Key support levels to watch include the psychological $75,000 mark, followed by the $70,000 zone, which has acted as strong support in recent weeks. On the upside, resistance is seen near the all-time high around $97,860.61, a level that could attract selling pressure if tested.
Traders are closely monitoring macroeconomic developments, including central bank policies and ETF flows, as well as on-chain metrics like exchange reserves and whale activity. The current price action suggests a balancing act between bullish momentum and profit-taking, with the RSI warning of potential overheating. A break below $75,000 could trigger deeper retracements, while holding above this level may keep the bullish structure intact.
Market sentiment remains cautiously optimistic, supported by institutional interest and macroeconomic factors such as inflation concerns and potential rate cuts. However, the overbought RSI suggests some traders may be taking profits, leading to short-term pressure. Key support levels to watch include the psychological $75,000 mark, followed by the $70,000 zone, which has acted as strong support in recent weeks. On the upside, resistance is seen near the all-time high around $97,860.61, a level that could attract selling pressure if tested.
Traders are closely monitoring macroeconomic developments, including central bank policies and ETF flows, as well as on-chain metrics like exchange reserves and whale activity. The current price action suggests a balancing act between bullish momentum and profit-taking, with the RSI warning of potential overheating. A break below $75,000 could trigger deeper retracements, while holding above this level may keep the bullish structure intact.
Disclaimer
The content on MarketsFN.com is provided for educational and informational purposes only. It does not constitute financial advice or investment recommendations. All investments involve risk. Cryptocurrency markets are highly volatile. Past performance does not guarantee future results.