AUD/USD: Down 0.32% to 0.6959 — RSI Oversold
MarketsFN Team
AUD/USD: Down 0.32% to 0.6959 — RSI Oversold
Published: October 12, 2026 · MarketsFN Team · US Session
| Pair | Rate | Change | RSI(14) | SMA-20 | SMA-50 | 52W High | 52W Low | Pivot | R1 | S1 |
|---|---|---|---|---|---|---|---|---|---|---|
| AUD/USD | 0.6959 | -0.32% | 27.5 | 0.7019 | 0.7086 | 0.7256 | 0.6438 | 0.6973 | 0.6996 | 0.6958 |
📊 Support & Resistance Levels
Dynamic Trendlines
| Level | Type | Direction | Distance |
|---|---|---|---|
| 0.6801 | 20d Support | ↘ descending | -2.28% / 158.5 pips |
| 0.6995 | 20d Resistance | ↘ descending | +0.51% / 35.7 pips |
| 0.6888 | 50d Support | ↘ descending | -1.02% / 70.9 pips |
| 0.7204 | 50d Resistance | ↘ descending | +3.52% / 245.2 pips |
Static Levels
| Level | Type | Touches | Distance |
|---|---|---|---|
| 0.6907 | Support | 2× | -0.85% / 59.5 pips |
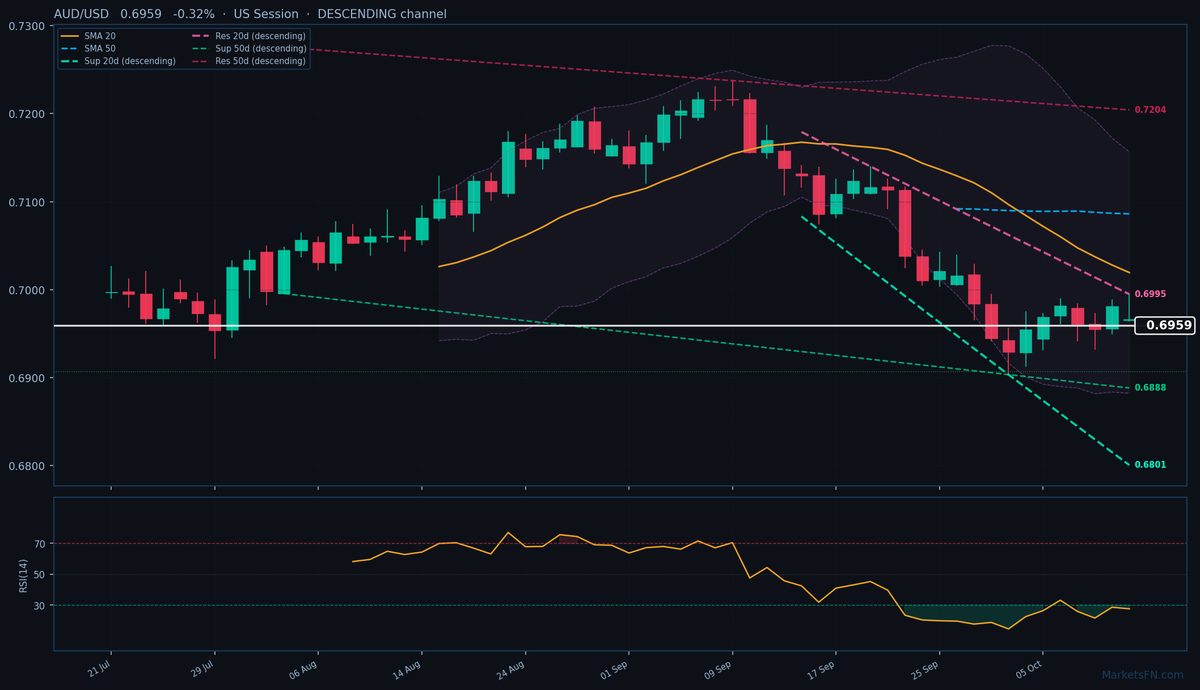
AUD/USD is trading at 0.6959 (-0.32%), extending its downtrend as the pair remains firmly below both the 20-day (0.7019) and 50-day (0.7086) SMAs, confirming bearish momentum. The rate is now testing the daily S1 pivot at 0.6958 (just 0.1 pip below current), with R1 resistance at 0.6996 (37 pips above). A break below S1 could accelerate losses toward the next static support at 0.6907 (52 pips away), which has held twice previously.
The pair is entrenched in a descending 20-day channel, with dynamic resistance at 0.6995 (36 pips above) and support at 0.6801 (158 pips below). The 50-day channel shows steeper resistance at 0.7204 (245 pips away), highlighting the structural bearish bias. RSI at 27.5 signals extreme oversold conditions, but without bullish divergence, this may merely precede consolidation rather than reversal.
Near-term, the path of least resistance remains downward given the descending channels and SMA stack. However, the oversold RSI and proximity to S1 suggest potential for a minor bounce toward 0.6995-0.6996 (R1/dynamic resistance confluence). A confirmed break below 0.6958 opens 0.6907, while sustained trading above 0.6996 would challenge the 20-day SMA at 0.7019. The next US session’s price action relative to these levels will confirm whether bears retain control or if exhaustion sets in. Watch for a close above 0.6973 (daily pivot) as an early sign of near-term stabilization.
Disclaimer
The content on MarketsFN.com is provided for educational and informational purposes only and does not constitute financial advice. All investments involve risk and past performance does not guarantee future results.