USD/ZAR: Up 0.05% to 16.6472 — Ascending Channel
MarketsFN Team
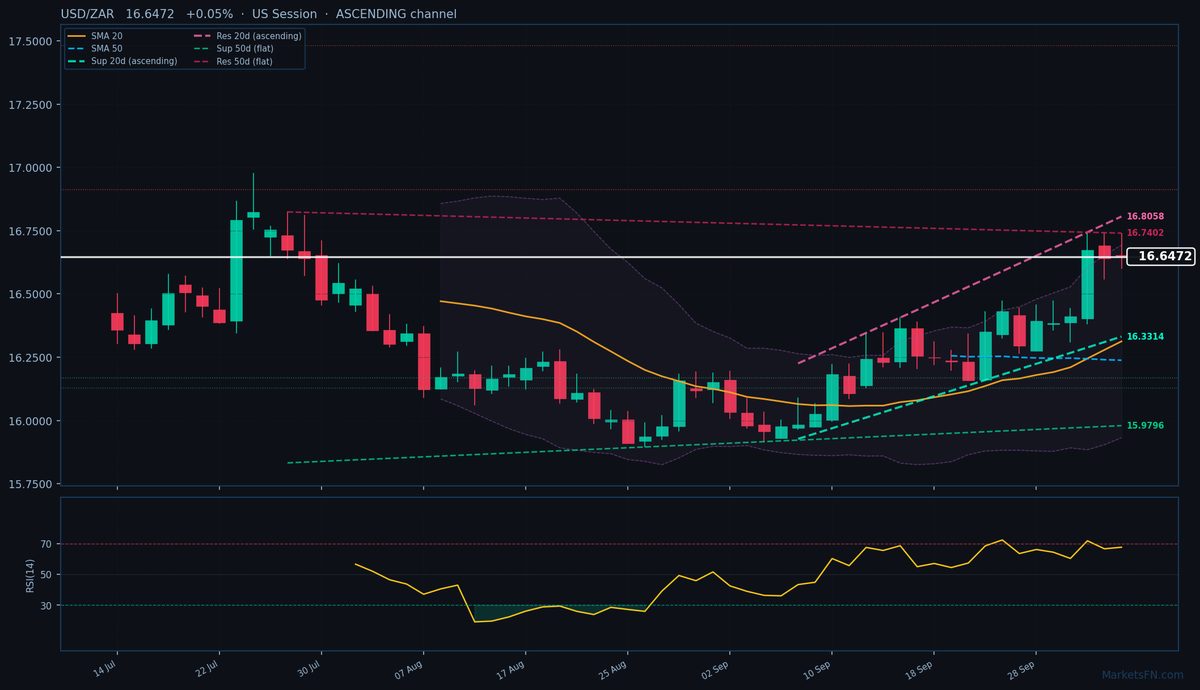
USD/ZAR: Up 0.05% to 16.6472 — Ascending Channel
Published: October 05, 2026 · MarketsFN Team · US Session · Emerging FX
| Pair | Rate | Change | RSI(14) | SMA-20 | SMA-50 | 52W High | 52W Low | Pivot | R1 | S1 |
|---|---|---|---|---|---|---|---|---|---|---|
| USD/ZAR | 16.6472 | +0.05% | 67.6 | 16.3126 | 16.2381 | 17.5061 | 15.7197 | 16.6458 | 16.7331 | 16.5523 |
S/R Support & Resistance Levels
Dynamic Trendlines
| Level | Type | Direction | Distance |
|---|---|---|---|
| 16.3314 | 20d Support | up (ascending) | -1.90% / 3157.9 pips |
| 16.8058 | 20d Resistance | up (ascending) | +0.95% / 1585.8 pips |
| 15.9796 | 50d Support | flat (flat) | -4.01% / 6676.1 pips |
| 16.7402 | 50d Resistance | flat (flat) | +0.56% / 929.7 pips |
Static Levels
| Level | Type | Touches | Distance |
|---|---|---|---|
| 17.4820 | Resistance | 2x | +5.01% / 8343.2 pips |
| 16.9140 | Resistance | 2x | +1.60% / 2662.9 pips |
| 16.1691 | Support | 2x | -2.88% / 4786.6 pips |
| 16.1285 | Support | 2x | -3.12% / 5192.6 pips |
USD/ZAR is trading at 16.6472 (+0.05%), testing the pivot at 16.6458 as it consolidates near the upper bound of its 20-day ascending channel. The pair remains firmly in an uptrend, trading above both the 20-day SMA (16.3126) and 50-day SMA (16.2381), with the 20-day dynamic resistance trendline at 16.8058 just 1585.8 pips away. However, the 50-day channel has flattened, suggesting potential exhaustion in the broader rally.
Price action today has been contained within a 1361-pip range (16.6016–16.7377), failing to sustain a break above the 50-day dynamic resistance at 16.7402 (+0.56% from current). The nearest static resistance (R1 at 16.9140) lies 2662.9 pips above, while static support (S1 at 16.1691) is 4786.6 pips below — both too distant to be immediate triggers. The RSI at 67.6 shows neutral momentum, neither overbought nor oversold, but the ATR of 0.1739 suggests volatility remains elevated.
Short-term, the pair’s ability to hold above the 20-day dynamic support (16.3314, -1.90%) will determine whether the uptrend persists. A close above 16.7402 would confirm bullish continuation toward 16.8058, while a break below 16.6016 (today’s low) could signal a pullback toward the 20-day SMA. The European session’s price action around the pivot will be key — failure to reclaim 16.6458 may invite profit-taking. Watch for a confirmed break of today’s range to gauge next directional bias.
Disclaimer
The content on MarketsFN.com is provided for educational and informational purposes only and does not constitute financial advice. All investments involve risk and past performance does not guarantee future results.