USD/ZAR: Down 0.10% to 16.3655 — Ascending Channel
MarketsFN Team
USD/ZAR: Down 0.10% to 16.3655 — Ascending Channel
Published: September 30, 2026 · MarketsFN Team · US Session · Emerging FX
| Pair | Rate | Change | RSI(14) | SMA-20 | SMA-50 | 52W High | 52W Low | Pivot | R1 | S1 |
|---|---|---|---|---|---|---|---|---|---|---|
| USD/ZAR | 16.3655 | -0.10% | 58.3 | 16.2078 | 16.2453 | 17.5061 | 15.7197 | 16.4034 | 16.4501 | 16.3358 |
S/R Support & Resistance Levels
Dynamic Trendlines
| Level | Type | Direction | Distance |
|---|---|---|---|
| 16.2570 | 20d Support | up (ascending) | -0.66% / 1084.7 pips |
| 16.6306 | 20d Resistance | up (ascending) | +1.62% / 2651.5 pips |
| 15.7777 | 50d Support | down (descending) | -3.59% / 5877.8 pips |
| 16.4602 | 50d Resistance | down (descending) | +0.58% / 947.5 pips |
Static Levels
| Level | Type | Touches | Distance |
|---|---|---|---|
| 16.9140 | Resistance | 2x | +3.35% / 5485.2 pips |
| 16.5797 | Resistance | 2x | +1.31% / 2142.2 pips |
| 16.4811 | Resistance | 3x | +0.71% / 1156.4 pips |
| 16.1691 | Support | 2x | -1.20% / 1964.4 pips |
| 16.1285 | Support | 2x | -1.45% / 2370.3 pips |
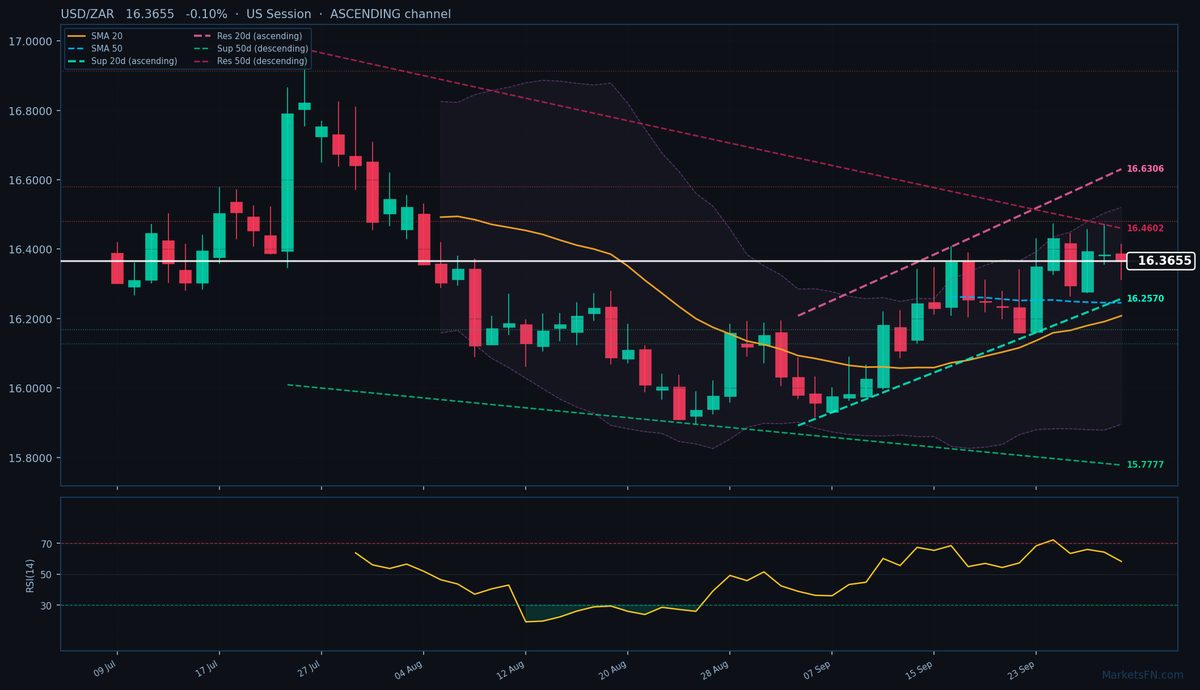
USD/ZAR is trading at 16.3655 (-0.10%), holding above both the 20-day (16.2078) and 50-day (16.2453) SMAs, confirming the short-term uptrend. The pair remains in an ascending 20-day channel, with dynamic support at 16.2570 (-1084.7 pips) and resistance at 16.6306 (+2651.5 pips), suggesting room for further upside. However, the conflicting 50-day descending channel (resistance at 16.4602, +947.5 pips) warns of potential medium-term pressure.
Key static levels show immediate resistance at R1 (16.4811, +1156.4 pips), which aligns closely with the 50-day dynamic resistance, creating a confluence zone that could cap gains. Support lies at S1 (16.1691, -1964.4 pips), just below the 20-day SMA, offering a potential dip-buying level. The RSI at 58.3 is neutral but leans bullish, with no overbought signals yet.
Short-term, the pair looks poised to test 16.4811, but the descending 50-day resistance and static R1 may trigger profit-taking. A break above 16.4811 could accelerate toward 16.6306, while failure risks a pullback to 16.2570. Watch for a close above 16.4034 (today’s pivot) to confirm bullish momentum. The next catalyst is the 20-day dynamic resistance test — a break there would invalidate the 50-day downtrend.
Disclaimer
The content on MarketsFN.com is provided for educational and informational purposes only and does not constitute financial advice. All investments involve risk and past performance does not guarantee future results.