USD/ZAR: Down 0.08% to 16.1464 — Descending Channel
MarketsFN Team
USD/ZAR: Down 0.08% to 16.1464 — Descending Channel
Published: August 31, 2026 · MarketsFN Team · US Session · Emerging FX
| Pair | Rate | Change | RSI(14) | SMA-20 | SMA-50 | 52W High | 52W Low | Pivot | R1 | S1 |
|---|---|---|---|---|---|---|---|---|---|---|
| USD/ZAR | 16.1464 | -0.08% | 47.8 | 16.1368 | 16.3275 | 17.5061 | 15.7197 | 16.1008 | 16.2420 | 16.0178 |
S/R Support & Resistance Levels
Dynamic Trendlines
| Level | Type | Direction | Distance |
|---|---|---|---|
| 15.8484 | 20d Support | down (descending) | -1.85% / 2980.9 pips |
| 16.1916 | 20d Resistance | down (descending) | +0.28% / 452.0 pips |
| 15.8731 | 50d Support | down (descending) | -1.69% / 2733.6 pips |
| 16.6428 | 50d Resistance | down (descending) | +3.07% / 4964.0 pips |
Static Levels
| Level | Type | Touches | Distance |
|---|---|---|---|
| 16.9140 | Resistance | 2x | +4.73% / 7633.8 pips |
| 16.5797 | Resistance | 2x | +2.66% / 4290.9 pips |
| 16.4811 | Resistance | 3x | +2.05% / 3305.0 pips |
| 16.1285 | Support | 2x | -0.14% / 221.7 pips |
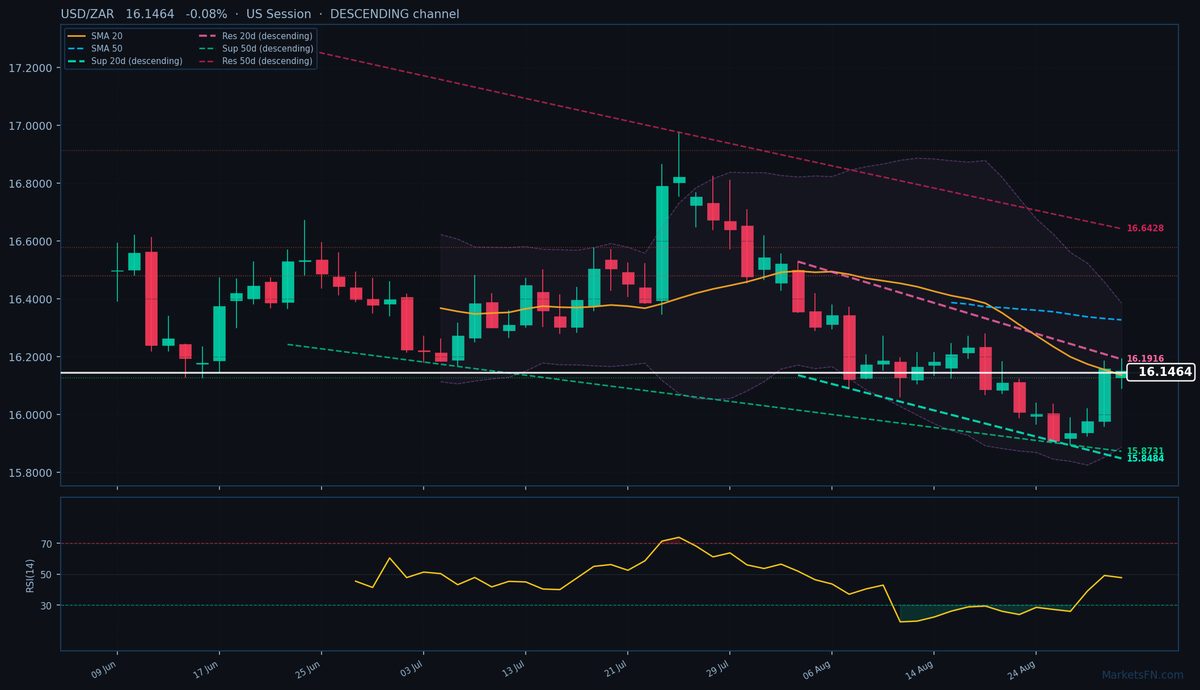
USD/ZAR is trading at 16.1464 (-0.08%), hovering just above the 20-day SMA (16.1368) but still below the 50-day SMA (16.3275), signaling a consolidation phase within a broader downtrend. The pair remains trapped between these moving averages, reflecting indecision as it tests the lower bounds of its 52-week range (15.7197 – 17.5061). Both the 20-day and 50-day dynamic channels are descending, with the nearest resistance trendline at 16.1916 (just 452 pips above current price) and support at 15.8484 (2,981 pips below). The proximity to the 20-day resistance suggests limited upside potential unless the pair breaks decisively higher.
Static levels show immediate support at 16.1285 (221 pips below), while the closest meaningful resistance cluster sits at 16.4811 (3,305 pips away). RSI at 47.8 confirms neutral momentum, neither oversold nor overbought, aligning with the range-bound price action. The descending channels and failure to reclaim the 50-day SMA suggest bears retain control, but a break above 16.1916 could trigger short-term bullish momentum.
Short-term, watch for a rejection at the 20-day dynamic resistance (16.1916) or a breakdown below the 20-day SMA (16.1368), which would confirm the downtrend’s continuation. The European session’s price action near the day’s high (16.1918) hints at potential resistance retesting—failure here could see a retracement toward 16.1285 support. ATR’s 0.1199 indicates subdued volatility, favoring range trades until a clear breakout materializes.
Disclaimer
The content on MarketsFN.com is provided for educational and informational purposes only and does not constitute financial advice. All investments involve risk and past performance does not guarantee future results.