USD/TRY: Up 0.05% to 48.2949 — RSI Overbought
MarketsFN Team
USD/TRY: Up 0.05% to 48.2949 — RSI Overbought
Published: September 02, 2026 · MarketsFN Team · US Session · Emerging FX
| Pair | Rate | Change | RSI(14) | SMA-20 | SMA-50 | 52W High | 52W Low | Pivot | R1 | S1 |
|---|---|---|---|---|---|---|---|---|---|---|
| USD/TRY | 48.2949 | +0.05% | 80.8 | 47.8661 | 47.3187 | 48.2727 | 41.2184 | 48.1909 | 48.2868 | 48.1174 |
S/R Support & Resistance Levels
Dynamic Trendlines
| Level | Type | Direction | Distance |
|---|---|---|---|
| 47.9968 | 20d Support | up (ascending) | -0.62% / 2980.5 pips |
| 48.3157 | 20d Resistance | up (ascending) | +0.04% / 208.3 pips |
| 47.9059 | 50d Support | up (ascending) | -0.81% / 3889.8 pips |
| 48.3358 | 50d Resistance | up (ascending) | +0.08% / 409.3 pips |
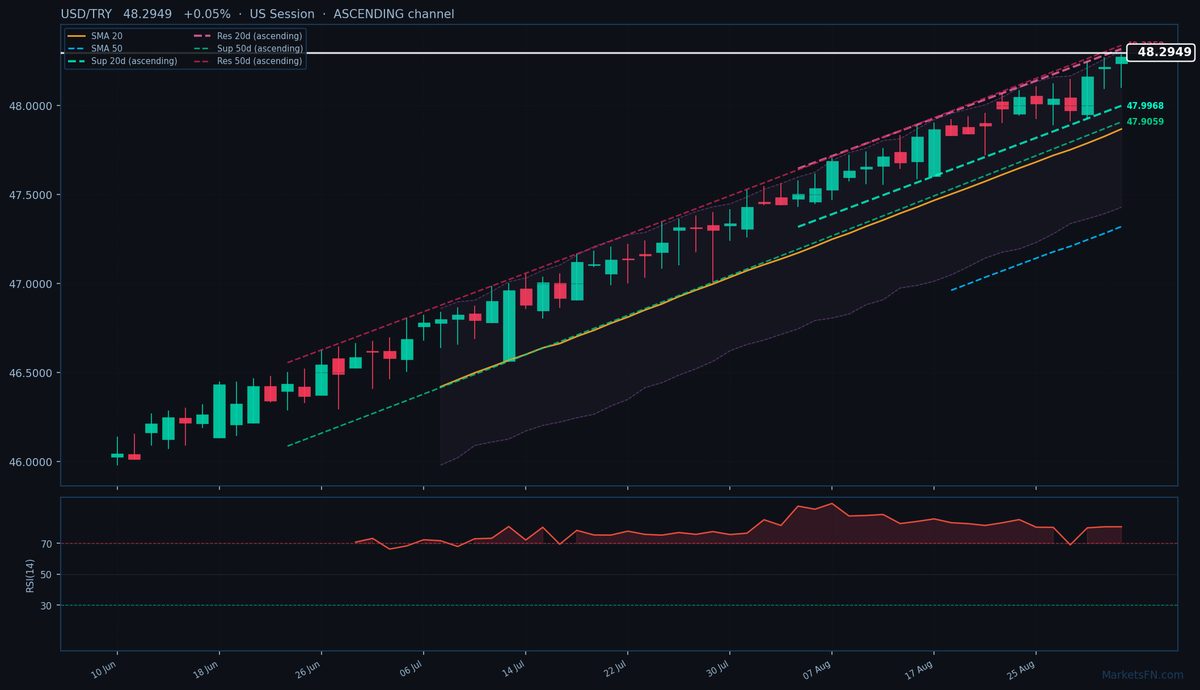
USD/TRY is trading at 48.2949 (+0.05%), pressing against all-time highs as the lira’s structural weakness persists. The pair remains firmly in an uptrend, trading above both the 20-day (47.8661) and 50-day (47.3187) SMAs, with the ascending dynamic channels confirming bullish momentum. The 20-day resistance trendline at 48.3157 is just 208.3 pips above current levels, while the 50-day resistance at 48.3358 sits 409.3 pips higher — both likely to cap near-term upside unless decisively broken. Dynamic support at 47.9968 (-0.57%, 2980.5 pips below) offers the first downside buffer. Static levels show immediate resistance at R1 (48.2868, just 81 pips away) and support at S1 (48.1174, 1775 pips below), though the latter appears vulnerable given the pair’s persistent bid tone.
The RSI at 80.8 screams overbought, but in TRY’s case, this is more a feature than a bug — sustained RSI extremes are common in hyperinflationary environments. With the 20-day ATR at 0.2031, today’s range (48.1014–48.2816) aligns with typical volatility, though a close above the previous all-time high (48.2727) would reinforce bullish momentum. The ascending channels suggest the path of least resistance remains higher, but traders should watch for potential profit-taking near the dynamic resistance cluster (48.3157–48.3358). A break above 48.3358 could trigger a squeeze toward 49.00 psychological resistance, while failure to hold 48.1174 (S1) may signal a short-term correction. The next catalyst is Turkey’s August inflation print (due September 5), which could accelerate lira depreciation if above consensus.
Disclaimer
The content on MarketsFN.com is provided for educational and informational purposes only and does not constitute financial advice. All investments involve risk and past performance does not guarantee future results.