USD/THB: Up 0.09% to 33.7600 — Testing 52-Week High
MarketsFN Team
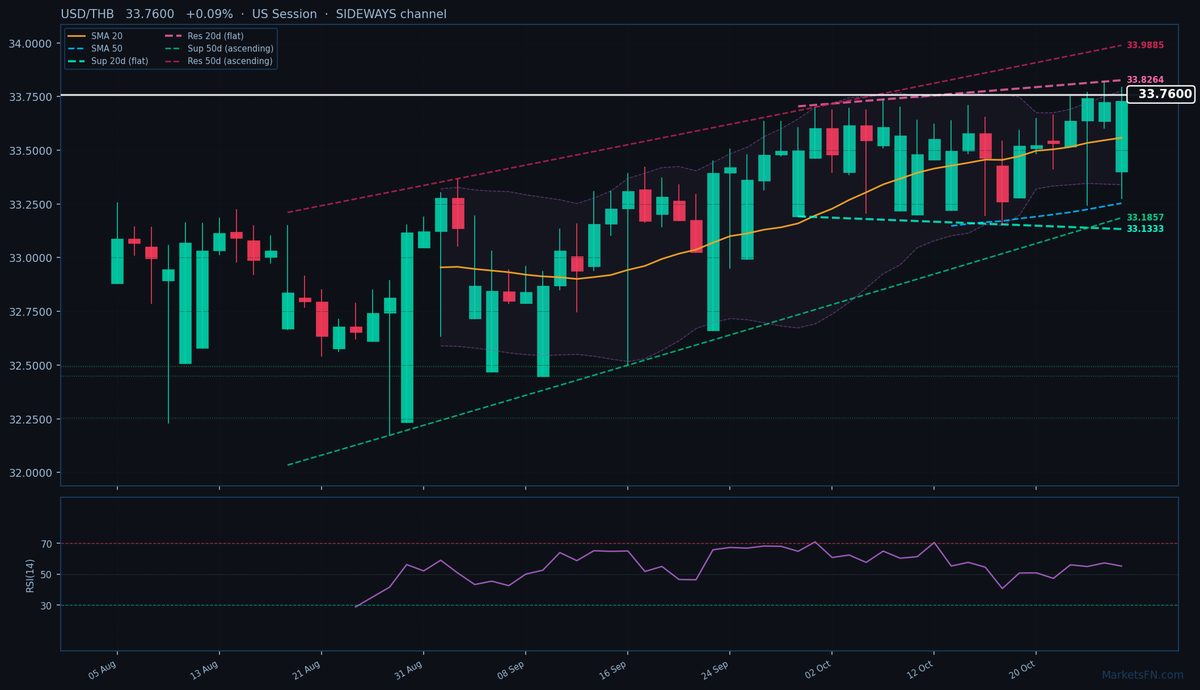
USD/THB: Up 0.09% to 33.7600 — Testing 52-Week High
Published: October 28, 2026 · MarketsFN Team · US Session · Emerging FX
| Pair | Rate | Change | RSI(14) | SMA-20 | SMA-50 | 52W High | 52W Low | Pivot | R1 | S1 |
|---|---|---|---|---|---|---|---|---|---|---|
| USD/THB | 33.7600 | +0.09% | 55.3 | 33.5583 | 33.2533 | 33.7470 | 30.5160 | 33.7160 | 33.8290 | 33.6120 |
S/R Support & Resistance Levels
Dynamic Trendlines
| Level | Type | Direction | Distance |
|---|---|---|---|
| 33.1333 | 20d Support | flat (flat) | -1.86% / 6267.5 pips |
| 33.8264 | 20d Resistance | flat (flat) | +0.20% / 664.2 pips |
| 33.1857 | 50d Support | up (ascending) | -1.70% / 5742.7 pips |
| 33.9885 | 50d Resistance | up (ascending) | +0.68% / 2285.4 pips |
Static Levels
| Level | Type | Touches | Distance |
|---|---|---|---|
| 32.4945 | Support | 2x | -3.67% / 12365.0 pips |
| 32.4505 | Support | 2x | -3.80% / 12805.0 pips |
| 32.2535 | Support | 2x | -4.38% / 14775.0 pips |
USD/THB is trading at 33.7600 (+0.09%), testing the upper bounds of its recent range as the pair consolidates near multi-year highs. The price remains firmly in an uptrend, trading above both the 20-day (33.5583) and 50-day (33.2533) SMAs, with the 50-day dynamic channel ascending — a bullish structural signal. Immediate dynamic resistance sits just 66.4 pips away at 33.8264 (20-day trendline), while the ascending 50-day resistance looms 228.5 pips higher at 33.9885. Downside protection comes from flat 20-day dynamic support at 33.1333 (626.7 pips below) and ascending 50-day support at 33.1857 (574.3 pips below), though neither is meaningfully close to current levels.
Static levels show a vacuum beneath current prices, with S1 at 33.6120 (148.0 pips below) acting as the nearest meaningful floor, while R1 at 33.8290 (69.0 pips above) aligns almost perfectly with the 20-day dynamic resistance — creating a clear technical ceiling. The neutral RSI at 55.3 suggests room for further upside before overbought conditions emerge.
Short-term, the pair looks poised to test the 33.8264-33.8290 resistance confluence. A break above could trigger momentum buying toward the 50-day dynamic resistance at 33.9885, while failure here may see a pullback toward S1 at 33.6120. With the 52-week high at 33.7470 already breached intraday, watch for a daily close above this level to confirm bullish continuation. The European session’s price action will be critical — either validating the breakout or exposing it as a false move.
Disclaimer
The content on MarketsFN.com is provided for educational and informational purposes only and does not constitute financial advice. All investments involve risk and past performance does not guarantee future results.