USD/THB: Up 0.08% to 33.5810 — RSI Overbought
MarketsFN Team
USD/THB: Up 0.08% to 33.5810 — RSI Overbought
Published: October 13, 2026 · MarketsFN Team · US Session · Emerging FX
| Pair | Rate | Change | RSI(14) | SMA-20 | SMA-50 | 52W High | 52W Low | Pivot | R1 | S1 |
|---|---|---|---|---|---|---|---|---|---|---|
| USD/THB | 33.5810 | +0.08% | 71.8 | 33.4177 | 33.1428 | 33.7470 | 30.5160 | 33.4400 | 33.6820 | 33.2400 |
S/R Support & Resistance Levels
Dynamic Trendlines
| Level | Type | Direction | Distance |
|---|---|---|---|
| 33.0872 | 20d Support | up (ascending) | -1.47% / 4938.5 pips |
| 33.8520 | 20d Resistance | up (ascending) | +0.81% / 2710.4 pips |
| 32.9237 | 50d Support | up (ascending) | -1.96% / 6572.7 pips |
| 33.7561 | 50d Resistance | flat (flat) | +0.52% / 1750.9 pips |
Static Levels
| Level | Type | Touches | Distance |
|---|---|---|---|
| 32.4945 | Support | 2x | -3.32% / 11145.0 pips |
| 32.4505 | Support | 2x | -3.45% / 11585.0 pips |
| 32.2535 | Support | 2x | -4.03% / 13555.0 pips |
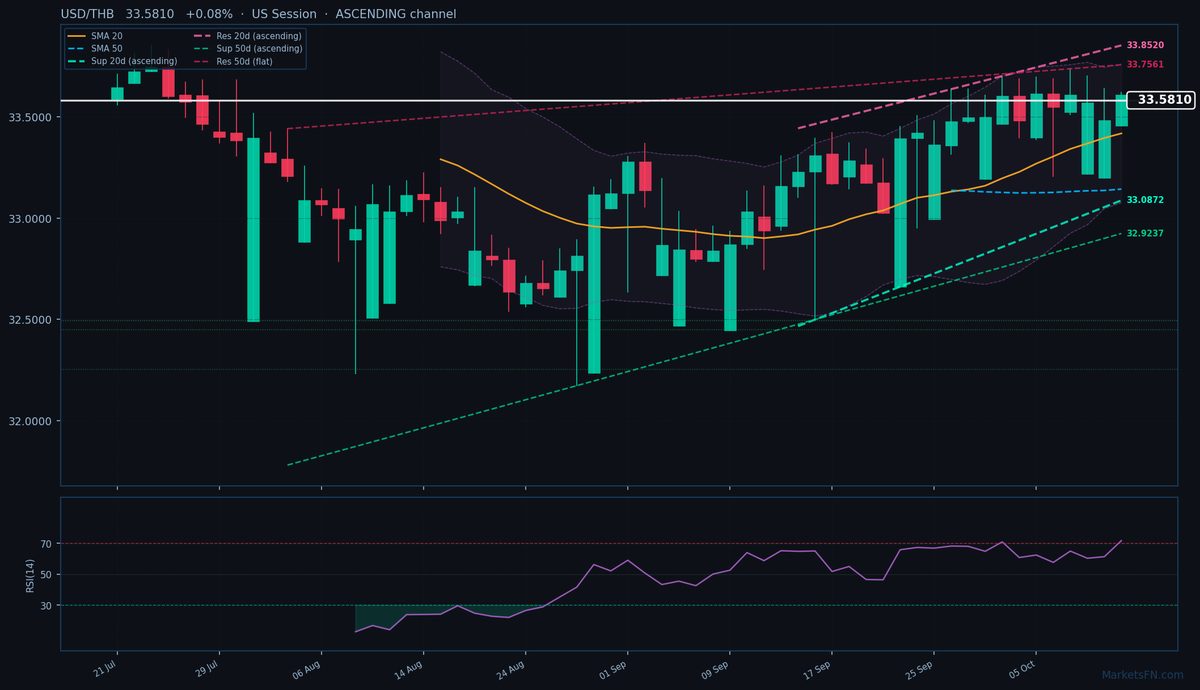
USD/THB is trading at 33.5810 (+0.08%), testing the upper bounds of its ascending trend as bullish momentum shows signs of exhaustion. The pair remains firmly above both the SMA-20 (33.4177) and SMA-50 (33.1428), confirming the uptrend, but today's narrow 1660-pip range (33.4540–33.6200) suggests consolidation near multi-year highs. The 20-day dynamic resistance at 33.8520 (+0.72%, 2710.4 pips above) remains the immediate upside target, while the ascending 20-day dynamic support at 33.0872 (-1.55%, 4938.5 pips below) provides a floor. Static levels show weak nearby support, with S1 at 33.2400 (-1.02%, 3410 pips below) untested in recent sessions, while R1 at 33.6820 (+0.30%, 1010 pips above) aligns with today’s high.
The RSI(14) at 71.8 flags overbought conditions, though divergence hasn’t yet materialized. With the ATR(14) at 0.3835, volatility remains elevated, increasing the risk of a pullback if the pair fails to breach 33.7470 (52-week high). The 50-day dynamic resistance at 33.7561 (+0.44%, 1750.9 pips above) reinforces this ceiling. Short-term, the ascending channel favors bulls, but the lack of meaningful static support below current levels raises vulnerability to profit-taking. A close below the SMA-20 (33.4177) would signal weakening momentum, while a break above 33.6820 (R1) could retest the 33.7470 record. The European session’s tepid price action suggests traders are awaiting fresh catalysts, with the overbought RSI warranting caution.
Disclaimer
The content on MarketsFN.com is provided for educational and informational purposes only and does not constitute financial advice. All investments involve risk and past performance does not guarantee future results.