USD/THB: Down 0.30% to 33.1280 — Price Holds Above SMA-20
MarketsFN Team
USD/THB: Down 0.30% to 33.1280 — Price Holds Above SMA-20
Published: September 02, 2026 · MarketsFN Team · US Session · Emerging FX
| Pair | Rate | Change | RSI(14) | SMA-20 | SMA-50 | 52W High | 52W Low | Pivot | R1 | S1 |
|---|---|---|---|---|---|---|---|---|---|---|
| USD/THB | 33.1280 | -0.30% | 57.6 | 32.9524 | 33.2145 | 33.7470 | 30.5160 | 33.1197 | 33.1923 | 33.0503 |
S/R Support & Resistance Levels
Dynamic Trendlines
| Level | Type | Direction | Distance |
|---|---|---|---|
| 32.1600 | 20d Support | flat (flat) | -2.92% / 9679.9 pips |
| 33.2690 | 20d Resistance | flat (flat) | +0.43% / 1410.0 pips |
| 31.8800 | 50d Support | down (descending) | -3.77% / 12480.2 pips |
| 33.3097 | 50d Resistance | down (descending) | +0.55% / 1817.3 pips |
Static Levels
| Level | Type | Touches | Distance |
|---|---|---|---|
| 32.2535 | Support | 2x | -2.94% / 9755.0 pips |
| 32.1695 | Support | 2x | -3.19% / 10595.0 pips |
| 31.5685 | Support | 2x | -5.00% / 16605.0 pips |
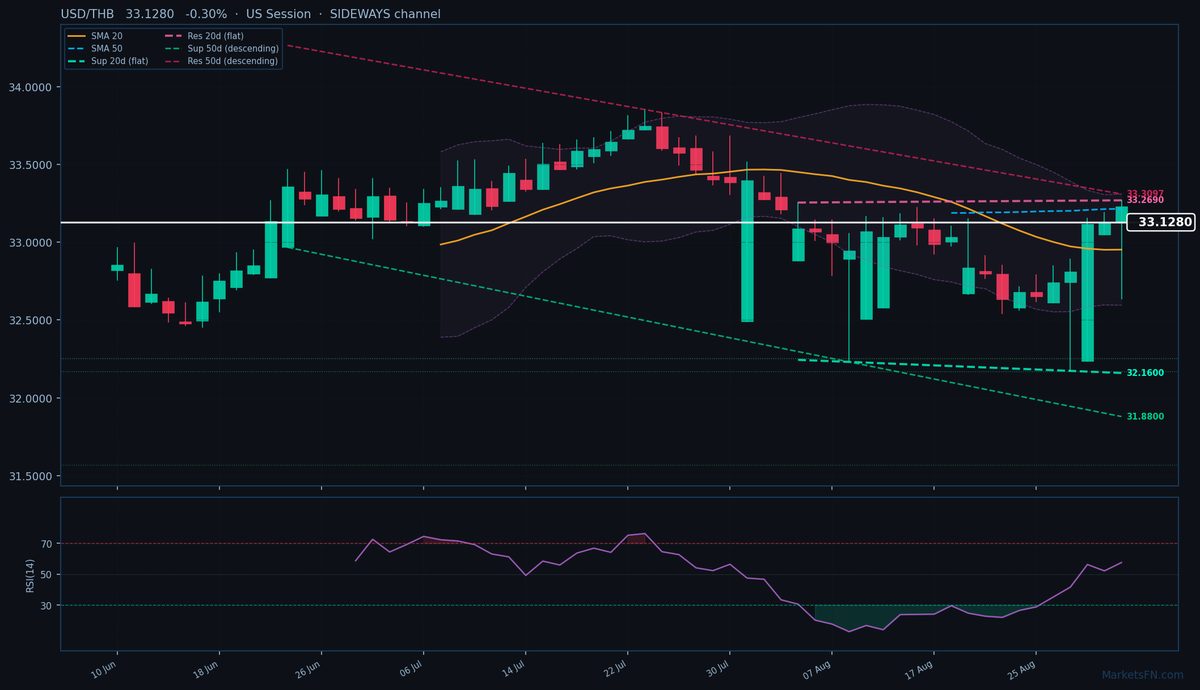
USD/THB is trading at 33.1280 (-0.30%), testing the lower bound of a descending 50-day channel as the pair struggles to sustain momentum above its 20-day SMA (32.9524). The current price sits between the 20-day and 50-day SMAs (33.2145), reflecting indecision after last week’s rejection at the 50-day dynamic resistance (33.3097, 1817 pips away). Today’s range (32.6350–33.2690) aligns almost perfectly with the 20-day dynamic resistance (33.2690, 1410 pips above), suggesting sellers are defending this descending trendline.
The 50-day channel’s downward slope (-4.06% from current to support at 31.8800, 12480 pips away) contrasts with the flatter 20-day channel, hinting at near-term consolidation despite the broader bearish bias. Immediate static levels to watch are S1 at 33.0503 (784 pips below) and R1 at 33.1923 (643 pips above) — a break above R1 could trigger a retest of the 50-day SMA, while failure at S1 opens a path toward the 20-day dynamic support (32.1600, 9679 pips lower). RSI at 57.6 shows neutral momentum, but the rejection at today’s high (33.2690) and the 50-day resistance trendline’s downward slope favor fading rallies.
The short-term outlook hinges on whether the pair holds above the 20-day SMA. A close below 32.9524 would confirm bearish control, targeting the static support cluster at 32.2535 (9755 pips down). Friday’s US NFP data could break the stalemate — stronger-than-expected prints may reignite USD upside, testing the 50-day resistance trendline’s integrity.
Disclaimer
The content on MarketsFN.com is provided for educational and informational purposes only and does not constitute financial advice. All investments involve risk and past performance does not guarantee future results.