USD/SGD: Down 0.19% to 1.2691 — RSI Oversold
MarketsFN Team
USD/SGD: Down 0.19% to 1.2691 — RSI Oversold
Published: August 21, 2026 · MarketsFN Team · US Session · Emerging FX
| Pair | Rate | Change | RSI(14) | SMA-20 | SMA-50 | 52W High | 52W Low | Pivot | R1 | S1 |
|---|---|---|---|---|---|---|---|---|---|---|
| USD/SGD | 1.2691 | -0.19% | 28.9 | 1.2800 | 1.2867 | 1.3075 | 1.2595 | 1.2713 | 1.2728 | 1.2701 |
S/R Support & Resistance Levels
Dynamic Trendlines
| Level | Type | Direction | Distance |
|---|---|---|---|
| 1.2691 | 20d Support | down (descending) | +0.00% / 0.3 pips |
| 1.2770 | 20d Resistance | down (descending) | +0.62% / 79.0 pips |
| 1.2693 | 50d Support | flat (flat) | +0.02% / 2.0 pips |
| 1.2896 | 50d Resistance | flat (flat) | +1.62% / 205.2 pips |
Static Levels
| Level | Type | Touches | Distance |
|---|---|---|---|
| 1.2936 | Resistance | 2x | +1.87% / 237.8 pips |
| 1.2899 | Resistance | 2x | +1.58% / 201.0 pips |
| 1.2840 | Resistance | 2x | +1.12% / 142.3 pips |
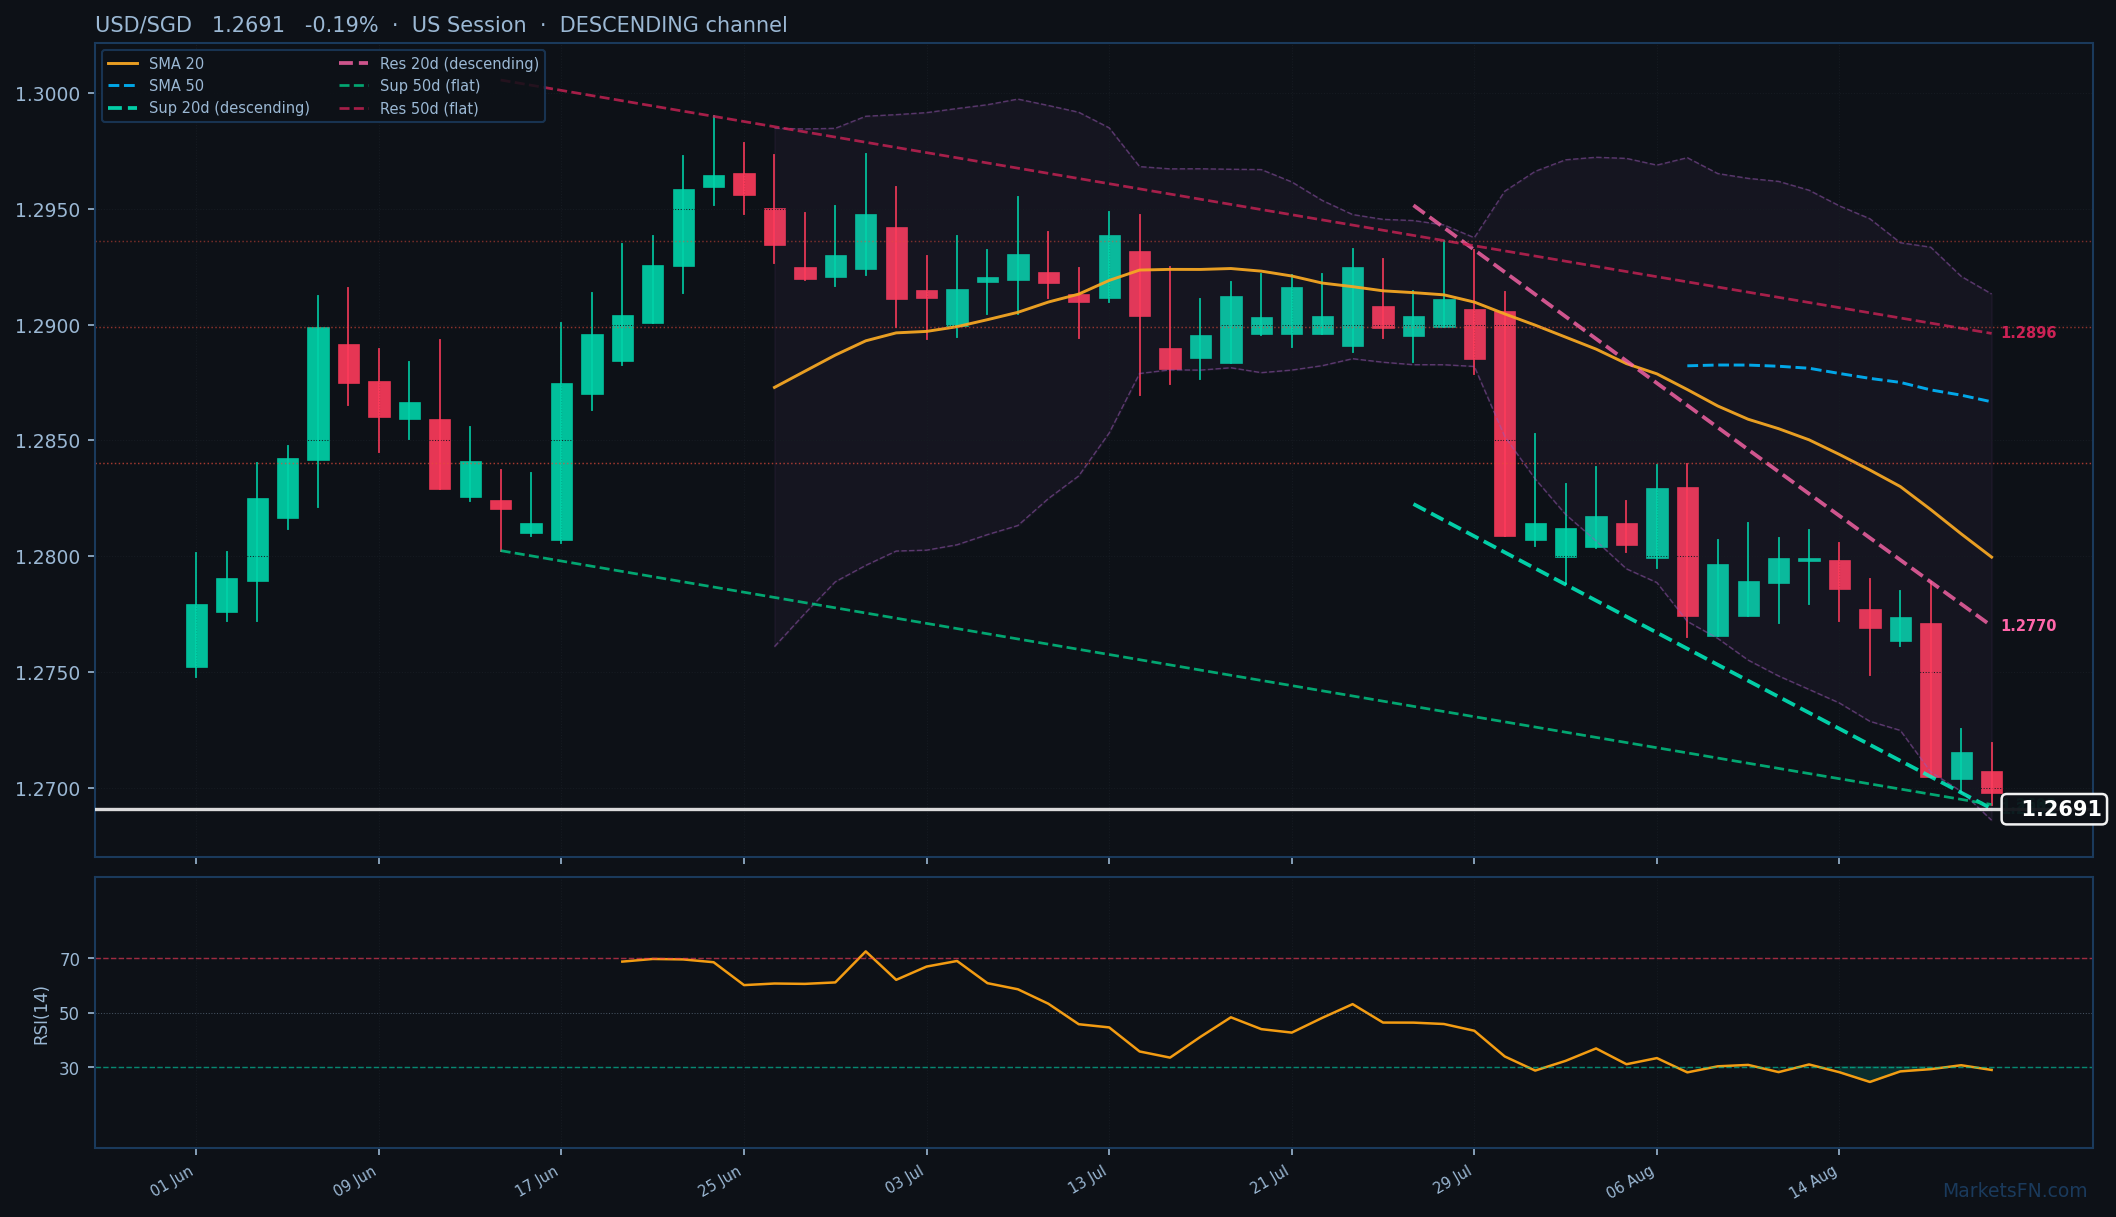
USD/SGD is trading at 1.2691 (-0.19%) as it continues to exhibit a downtrend, remaining below both the 20-day simple moving average (SMA) of 1.2800 and the 50-day SMA of 1.2867. The current price is precariously positioned at the 20-day dynamic support trendline, which is also descending, just 0.3 pips away at 1.2691. The nearest dynamic resistance trendline is significantly higher at 1.2770, 79.0 pips above the current rate.
In terms of static levels, the closest support level is S1 at 1.2701, which is 9.0 pips below the current price, while the nearest resistance level, R1, is at 1.2728, 3.7 pips above. This proximity to S1 suggests a potential test of support, especially given the oversold conditions indicated by the RSI(14) at 28.9, which typically signals a potential reversal or bounce.
The short-term outlook for USD/SGD remains cautious as the currency pair is trapped within a descending channel, reflecting bearish sentiment. The market may be underpricing the potential for a bounce if it can hold above the immediate support at S1. A decisive move above R1 at 1.2728 could signal a shift in momentum, while a breach below S1 would likely reinforce the downtrend, opening the door to further declines. Traders should watch for any signs of reversal or continued weakness in the coming sessions.
Disclaimer
The content on MarketsFN.com is provided for educational and informational purposes only and does not constitute financial advice. All investments involve risk and past performance does not guarantee future results.