USD/MXN: Up 0.70% to 18.1892 — RSI Overbought
MarketsFN Team
USD/MXN: Up 0.70% to 18.1892 — RSI Overbought
Published: October 01, 2026 · MarketsFN Team · US Session · Emerging FX
| Pair | Rate | Change | RSI(14) | SMA-20 | SMA-50 | 52W High | 52W Low | Pivot | R1 | S1 |
|---|---|---|---|---|---|---|---|---|---|---|
| USD/MXN | 18.1892 | +0.70% | 91.5 | 17.3570 | 17.2131 | 18.6856 | 16.8835 | 18.0499 | 18.1628 | 17.9489 |
S/R Support & Resistance Levels
Dynamic Trendlines
| Level | Type | Direction | Distance |
|---|---|---|---|
| 17.5293 | 20d Support | up (ascending) | -3.63% / 6598.6 pips |
| 18.2956 | 20d Resistance | up (ascending) | +0.59% / 1064.3 pips |
| 16.9592 | 50d Support | up (ascending) | -6.76% / 12299.8 pips |
| 18.2757 | 50d Resistance | up (ascending) | +0.48% / 865.2 pips |
Static Levels
| Level | Type | Touches | Distance |
|---|---|---|---|
| 18.8632 | Resistance | 2x | +3.71% / 6740.7 pips |
| 17.8683 | Support | 2x | -1.76% / 3208.3 pips |
| 17.1529 | Support | 2x | -5.70% / 10362.6 pips |
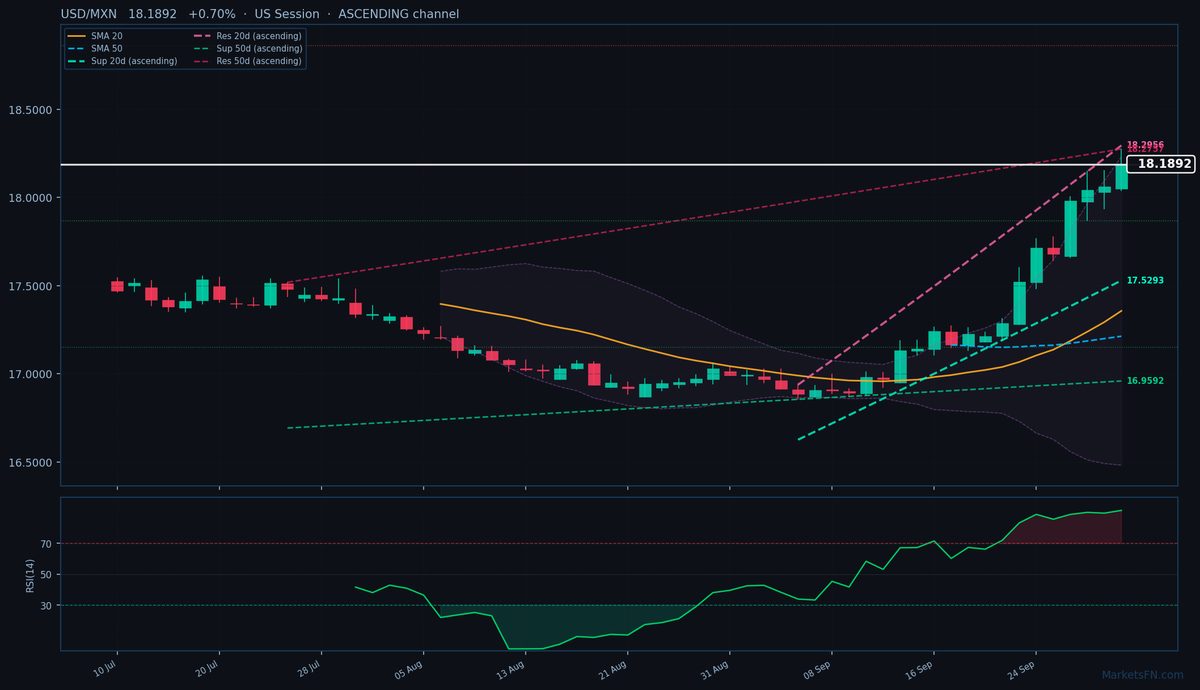
USD/MXN is trading at 18.1892 (+0.70%), extending its relentless uptrend as the pair pushes further into overbought territory. The move confirms bullish dominance, with price now trading well above both the 20-day (17.3570) and 50-day (17.2131) SMAs—a clear technical confirmation of the trend's strength. The ascending 20-day dynamic channel (support at 17.5293, resistance at 18.2956) shows the pair is just 1,064 pips from testing the upper boundary, while the 50-day channel (resistance at 18.2757) sits even closer at just 865 pips overhead.
Momentum is extreme, with RSI(14) at 91.5—deeply overbought and signaling potential exhaustion, though divergences have yet to appear. The nearest static support (S1 at 17.8683) lies 3,208 pips below, offering little immediate protection if profit-taking emerges. Conversely, static resistance (R1 at 18.8632) remains distant at 6,741 pips away, leaving room for further upside.
Short-term, the pair is testing the upper bounds of its daily range (18.2757), and a break here could accelerate gains toward the 52-week high (18.6856). However, with ATR(14) at 0.1943, volatility remains elevated, and the extreme RSI warns of a potential pullback. The key near-term catalyst is whether the dynamic resistance at 18.2956 holds—a rejection here could trigger a retracement toward 17.8683, while a breakout would confirm continuation toward 18.6856. Traders should watch for RSI divergence or a close below the pivot (18.0499) as early reversal signals.
Disclaimer
The content on MarketsFN.com is provided for educational and informational purposes only and does not constitute financial advice. All investments involve risk and past performance does not guarantee future results.