USD/MXN: Up 0.16% to 16.9947 — Descending Channel
MarketsFN Team
USD/MXN: Up 0.16% to 16.9947 — Descending Channel
Published: September 03, 2026 · MarketsFN Team · US Session · Emerging FX
| Pair | Rate | Change | RSI(14) | SMA-20 | SMA-50 | 52W High | 52W Low | Pivot | R1 | S1 |
|---|---|---|---|---|---|---|---|---|---|---|
| USD/MXN | 16.9947 | +0.16% | 48.6 | 17.0069 | 17.2590 | 18.6856 | 16.9164 | 16.9804 | 17.0125 | 16.9352 |
S/R Support & Resistance Levels
Dynamic Trendlines
| Level | Type | Direction | Distance |
|---|---|---|---|
| 16.7785 | 20d Support | down (descending) | -1.27% / 2161.9 pips |
| 17.0269 | 20d Resistance | down (descending) | +0.19% / 321.6 pips |
| 16.7622 | 50d Support | down (descending) | -1.37% / 2325.7 pips |
| 17.1147 | 50d Resistance | down (descending) | +0.71% / 1200.1 pips |
Static Levels
| Level | Type | Touches | Distance |
|---|---|---|---|
| 17.5648 | Resistance | 2x | +3.28% / 5581.4 pips |
| 17.5352 | Resistance | 2x | +3.11% / 5285.5 pips |
| 17.4358 | Resistance | 2x | +2.52% / 4291.5 pips |
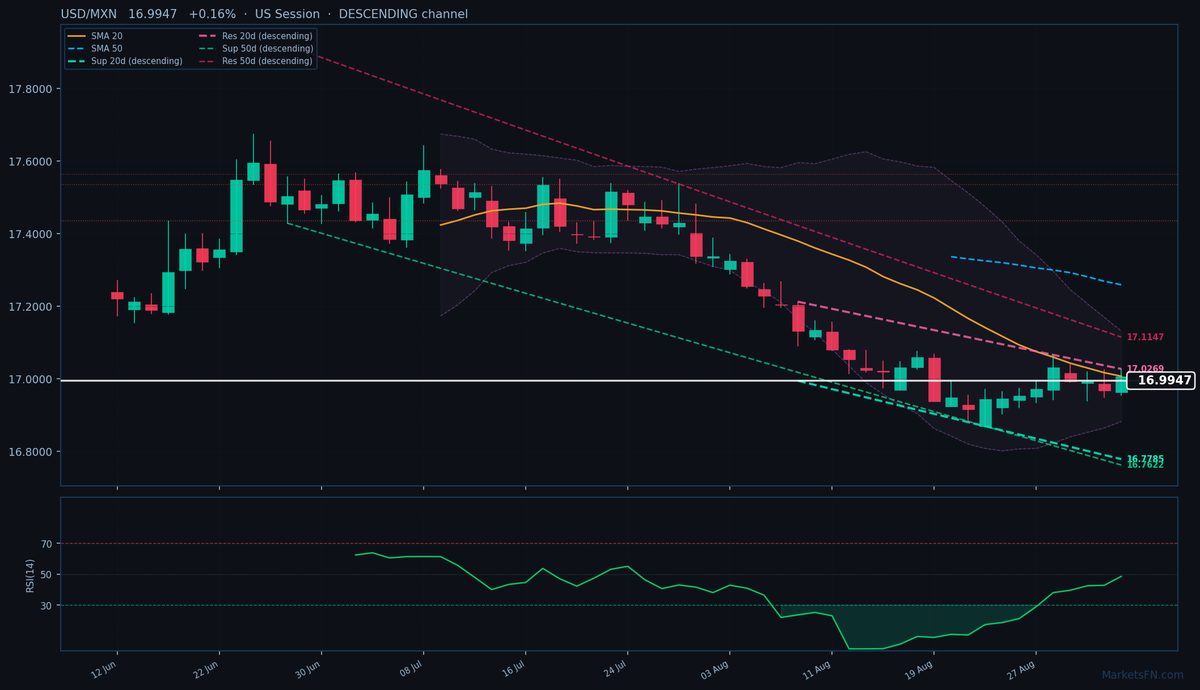
USD/MXN is trading at 16.9947 (+0.16%), testing the lower bounds of its descending 20-day dynamic resistance trendline at 17.0269, just 321.6 pips above. The pair remains firmly in a downtrend, trading below both the 20-day SMA (17.0069) and 50-day SMA (17.2590), with the 20-day dynamic channel sloping downward at an average rate. Price action is compressing near the pivot point (16.9804), with immediate static support at S1 (16.9352, 595.5 pips below) and resistance at R1 (17.0125, just 177.8 pips above). The RSI at 48.6 shows neutral momentum, failing to confirm either bullish or bearish conviction despite the slight intraday uptick.
The broader technical picture favors continued downside pressure, with the 50-day dynamic resistance trendline looming at 17.1147 (1,200.1 pips away) and static resistance clusters far above at 17.4358 (4,291.5 pips away). However, the proximity to the 20-day dynamic resistance suggests a potential breakout attempt—failure here would reinforce the downtrend, while a close above could signal short-term exhaustion. Watch for a decisive break below S1 (16.9352) to confirm bearish momentum, or a sustained hold above the 20-day SMA to challenge the descending channel. The European session’s narrow range (16.9549–17.0270) indicates hesitation; ATR(14) of 0.0765 suggests volatility may expand soon. Key catalyst: A close above 17.0270 (today’s high) or below 16.9352 (S1) to dictate next directional bias.
Disclaimer
The content on MarketsFN.com is provided for educational and informational purposes only and does not constitute financial advice. All investments involve risk and past performance does not guarantee future results.