USD/MXN: Down 0.33% to 17.9827 — RSI Overbought
MarketsFN Team
USD/MXN: Down 0.33% to 17.9827 — RSI Overbought
Published: September 30, 2026 · MarketsFN Team · US Session · Emerging FX
| Pair | Rate | Change | RSI(14) | SMA-20 | SMA-50 | 52W High | 52W Low | Pivot | R1 | S1 |
|---|---|---|---|---|---|---|---|---|---|---|
| USD/MXN | 17.9827 | -0.33% | 85.7 | 17.2894 | 17.1980 | 18.6856 | 16.8835 | 18.0200 | 18.1696 | 17.8923 |
S/R Support & Resistance Levels
Dynamic Trendlines
| Level | Type | Direction | Distance |
|---|---|---|---|
| 17.4347 | 20d Support | up (ascending) | -3.05% / 5479.8 pips |
| 18.2120 | 20d Resistance | up (ascending) | +1.28% / 2293.7 pips |
| 16.8265 | 50d Support | flat (flat) | -6.43% / 11562.2 pips |
| 18.1607 | 50d Resistance | up (ascending) | +0.99% / 1779.9 pips |
Static Levels
| Level | Type | Touches | Distance |
|---|---|---|---|
| 18.8632 | Resistance | 2x | +4.90% / 8805.3 pips |
| 18.0365 | Resistance | 2x | +0.30% / 538.0 pips |
| 17.8683 | Support | 2x | -0.64% / 1143.7 pips |
| 17.1529 | Support | 2x | -4.61% / 8298.0 pips |
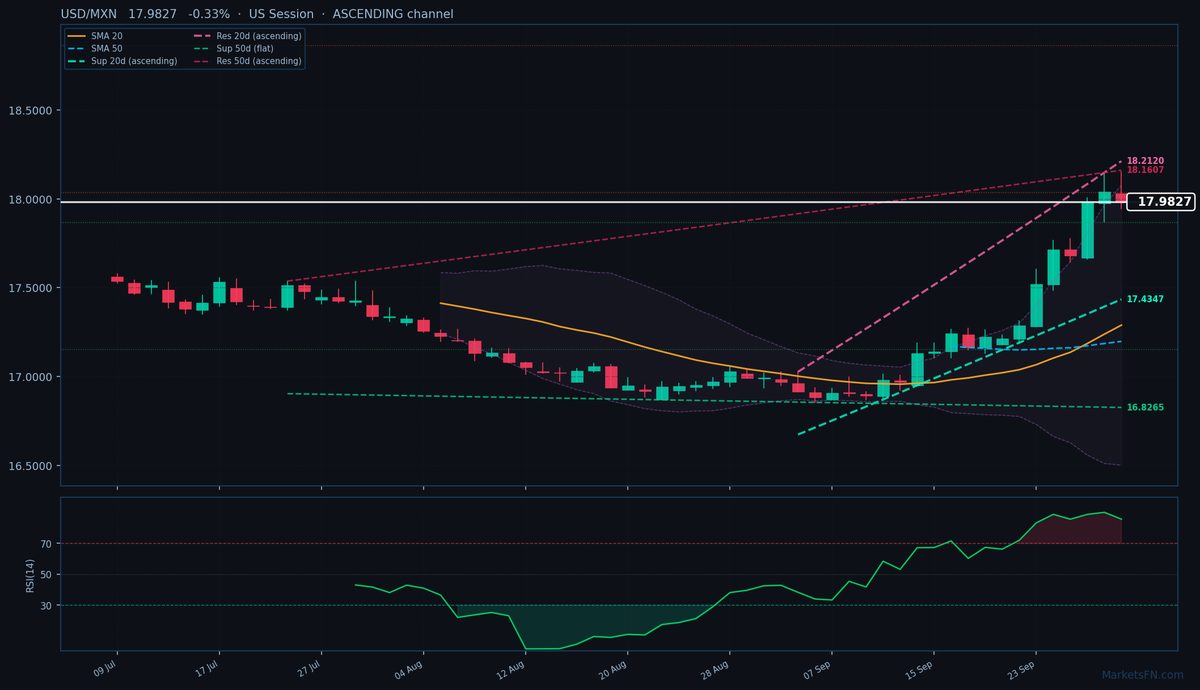
USD/MXN is trading at 17.9827 (-0.33%), consolidating near the upper bounds of its 52-week range (16.8835–18.6856) as the pair tests overbought territory. The rate remains firmly in an uptrend, trading above both the 20-day (17.2894) and 50-day (17.1980) SMAs, with the 20-day dynamic channel ascending at an average slope. Immediate dynamic resistance sits at 18.2120 (+1.28%, 2293.7 pips above), while dynamic support holds at 17.4347 (-3.05%, 5479.8 pips below). The 50-day channel shows a flatter trajectory, with resistance at 18.1607 (+0.99%, 1779.9 pips away) and distant support at 16.8265 (-6.43%, 11562.2 pips below).
Static levels highlight near-term pivot points: R1 at 18.0365 (538.0 pips above) and S1 at 17.8683 (1143.7 pips below), both tested twice historically. The RSI(14) at 85.7 signals extreme overbought conditions, suggesting limited upside without a corrective pullback. Intraday volatility (ATR 0.1828) aligns with the European session’s typical range (17.9448–18.1508 today).
Short-term, the pair faces resistance near the psychological 18.0000 level, with a break above R1 (18.0365) potentially targeting the dynamic resistance at 18.2120. However, the stretched RSI and proximity to the 52-week high (18.6856) heighten reversal risks. A failure to hold above S1 (17.8683) could trigger a deeper retracement toward the 20-day SMA (17.2894). Confirmation of trend exhaustion would require a close below the 20-day dynamic support (17.4347), while sustained bullish momentum hinges on clearing 18.2120.
Disclaimer
The content on MarketsFN.com is provided for educational and informational purposes only and does not constitute financial advice. All investments involve risk and past performance does not guarantee future results.