USD/MXN: Down 0.10% to 18.4694 — Ascending Channel
MarketsFN Team
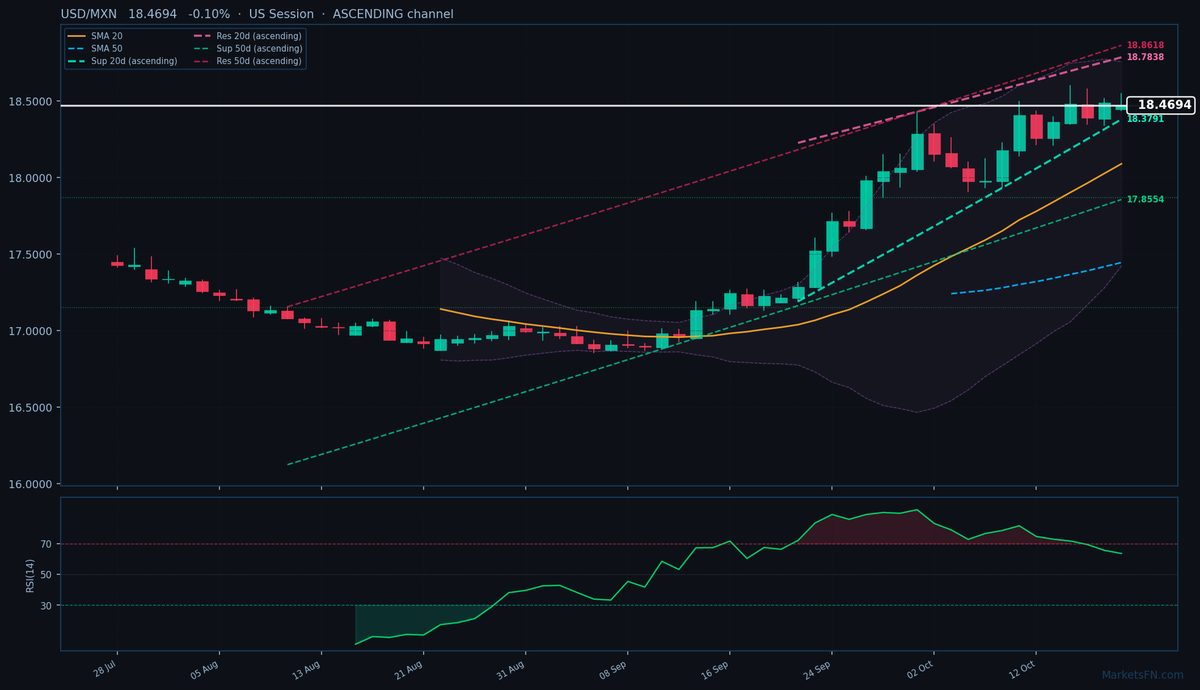
USD/MXN: Down 0.10% to 18.4694 — Ascending Channel
Published: October 19, 2026 · MarketsFN Team · US Session · Emerging FX
| Pair | Rate | Change | RSI(14) | SMA-20 | SMA-50 | 52W High | 52W Low | Pivot | R1 | S1 |
|---|---|---|---|---|---|---|---|---|---|---|
| USD/MXN | 18.4694 | -0.10% | 63.6 | 18.0885 | 17.4442 | 18.6856 | 16.8835 | 18.4466 | 18.5534 | 18.3803 |
S/R Support & Resistance Levels
Dynamic Trendlines
| Level | Type | Direction | Distance |
|---|---|---|---|
| 18.3791 | 20d Support | up (ascending) | -0.49% / 903.4 pips |
| 18.7838 | 20d Resistance | up (ascending) | +1.70% / 3143.4 pips |
| 17.8554 | 50d Support | up (ascending) | -3.32% / 6140.9 pips |
| 18.8618 | 50d Resistance | up (ascending) | +2.12% / 3923.1 pips |
Static Levels
| Level | Type | Touches | Distance |
|---|---|---|---|
| 17.8683 | Support | 2x | -3.26% / 6015.6 pips |
| 17.1529 | Support | 2x | -7.13% / 13169.9 pips |
USD/MXN is trading at 18.4694 (-0.10%), consolidating near the upper end of its 52-week range (16.8835 – 18.6856) after a mild pullback from yesterday's close at 18.4871. The pair remains firmly in an uptrend, trading above both the 20-day SMA (18.0885) and 50-day SMA (17.4442), with the 20-day dynamic support trendline ascending at 18.3791 (-903.4 pips below current price). The 20-day dynamic resistance sits at 18.7838 (+3143.4 pips), confirming the ascending channel structure. Momentum is neutral with RSI(14) at 63.6, though the proximity to overbought territory (70+) warrants caution for bulls.
Near-term static support is at S1 pivot 18.3803 (-892.1 pips), while resistance looms at R1 18.5534 (+840.0 pips). The pair has room to test the upper bounds of its ascending channels, but the 52-week high at 18.6856 (+2166.2 pips) remains the critical ceiling. ATR(14) of 0.2316 suggests subdued volatility, though the European session could see a breakout attempt.
The short-term bias leans bullish given the ascending channels and SMA positioning, but traders should watch for rejection at R1 or a break below S1 to confirm a deeper correction. The next catalyst is whether the pair can hold above the 20-day dynamic support (18.3791) — a close below would signal trend exhaustion. Until then, dips toward 18.38-18.44 remain buying opportunities within the broader uptrend.
Disclaimer
The content on MarketsFN.com is provided for educational and informational purposes only and does not constitute financial advice. All investments involve risk and past performance does not guarantee future results.