USD/MXN: Down 0.07% to 16.9791 — Descending Channel
MarketsFN Team
USD/MXN: Down 0.07% to 16.9791 — Descending Channel
Published: September 01, 2026 · MarketsFN Team · US Session · Emerging FX
| Pair | Rate | Change | RSI(14) | SMA-20 | SMA-50 | 52W High | 52W Low | Pivot | R1 | S1 |
|---|---|---|---|---|---|---|---|---|---|---|
| USD/MXN | 16.9791 | -0.07% | 44.6 | 17.0305 | 17.2815 | 18.6856 | 16.9164 | 17.0069 | 17.0239 | 16.9747 |
S/R Support & Resistance Levels
Dynamic Trendlines
| Level | Type | Direction | Distance |
|---|---|---|---|
| 16.7700 | 20d Support | down (descending) | -1.23% / 2090.1 pips |
| 17.0370 | 20d Resistance | down (descending) | +0.34% / 579.6 pips |
| 16.7889 | 50d Support | down (descending) | -1.12% / 1901.7 pips |
| 17.1880 | 50d Resistance | down (descending) | +1.23% / 2089.9 pips |
Static Levels
| Level | Type | Touches | Distance |
|---|---|---|---|
| 17.5648 | Resistance | 2x | +3.27% / 5564.0 pips |
| 17.5352 | Resistance | 2x | +3.10% / 5268.1 pips |
| 17.4358 | Resistance | 2x | +2.51% / 4274.1 pips |
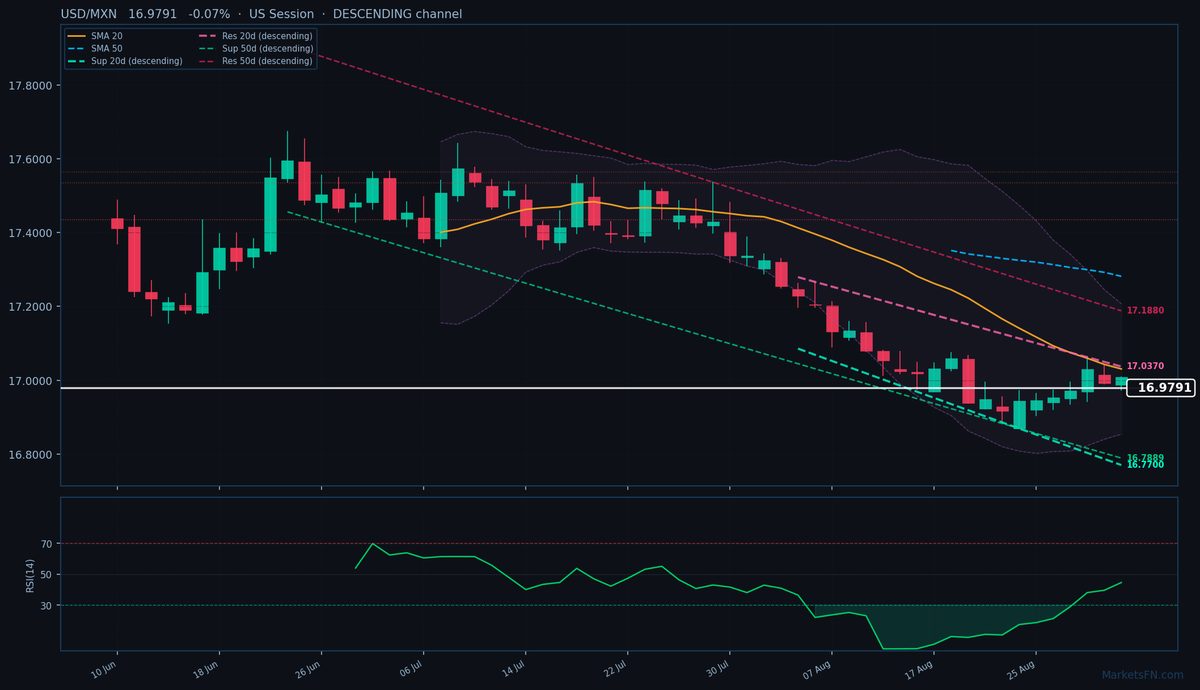
USD/MXN is trading at 16.9791 (-0.07%), continuing its downtrend as the pair remains firmly below both the SMA-20 (17.0305) and SMA-50 (17.2815), confirming bearish momentum. The rate sits just 579.6 pips below the descending 20-day dynamic resistance trendline at 17.0370, while the nearest dynamic support trendline stands at 16.7700, 2090.1 pips below current levels. Both the 20-day and 50-day channels are descending, reinforcing the broader bearish structure.
Static levels show S1 pivot support at 16.9747, a mere 44.4 pips below the current price, while R1 resistance looms at 17.0239, 448.8 pips above. The RSI at 44.6 sits in neutral territory, offering no clear divergence to signal a reversal. With the ATR(14) at 0.0721, today’s range of 16.9730–17.0091 aligns with recent volatility, though the failure to breach 17.0091 suggests sellers remain in control.
The short-term outlook remains bearish unless USD/MXN can reclaim the SMA-20, which would require a 514-pip rally. A break below S1 (16.9747) could accelerate losses toward the dynamic support at 16.7700. Watch for a close above the 20-day resistance trendline (17.0370) to invalidate the downtrend, but until then, rallies should be sold. The next catalyst is the US NFP report due Friday—a strong print could revive USD demand and test the descending resistance.
Disclaimer
The content on MarketsFN.com is provided for educational and informational purposes only and does not constitute financial advice. All investments involve risk and past performance does not guarantee future results.