USD/JPY: Up 0.17% to 158.31 — Ascending Channel
MarketsFN Team
USD/JPY: Up 0.17% to 158.31 — Ascending Channel
Published: October 08, 2026 · MarketsFN Team · US Session
| Pair | Rate | Change | RSI(14) | SMA-20 | SMA-50 | 52W High | 52W Low | Pivot | R1 | S1 |
|---|---|---|---|---|---|---|---|---|---|---|
| USD/JPY | 158.31 | +0.17% | 62.2 | 157.06 | 157.67 | 163.84 | 150.73 | 158.13 | 158.42 | 157.76 |
📊 Support & Resistance Levels
Dynamic Trendlines
| Level | Type | Direction | Distance |
|---|---|---|---|
| 157.58 | 20d Support | ↗ ascending | -0.46% / 73.0 pips |
| 160.49 | 20d Resistance | ↗ ascending | +1.38% / 217.9 pips |
| 151.09 | 50d Support | ↘ descending | -4.56% / 722.3 pips |
| 158.90 | 50d Resistance | ↘ descending | +0.37% / 58.8 pips |
Static Levels
| Level | Type | Touches | Distance |
|---|---|---|---|
| 159.85 | Resistance | 2× | +1.09% / 172.8 pips |
| 146.58 | Support | 2× | -7.30% / 1154.2 pips |
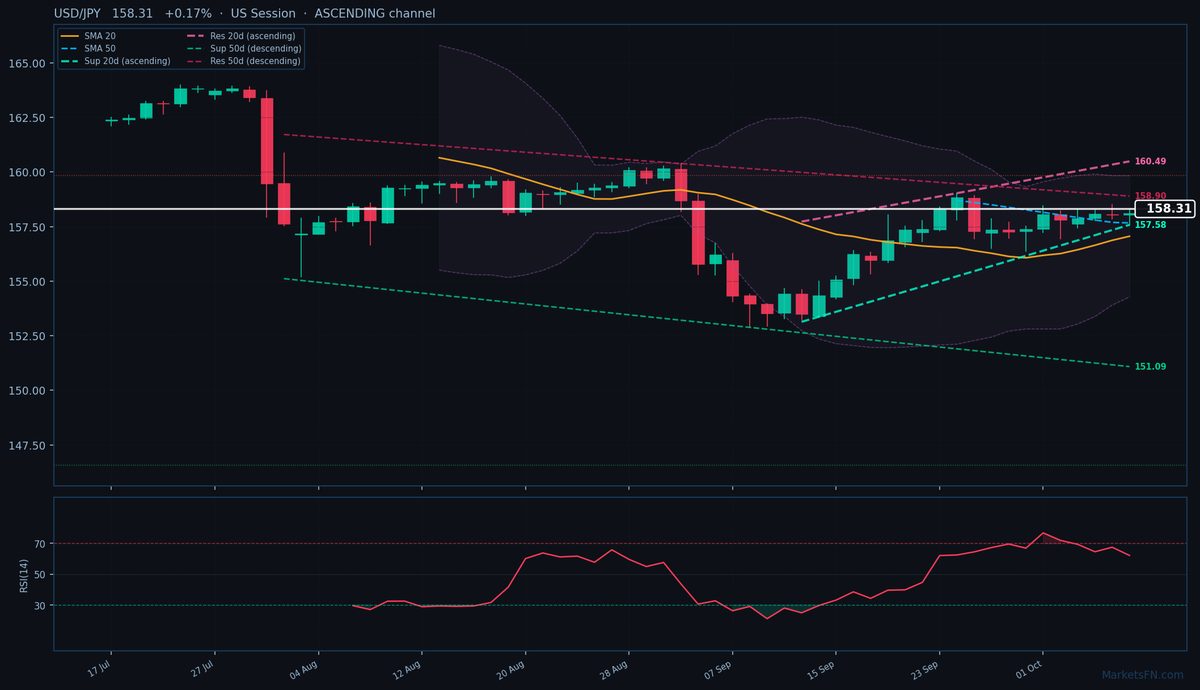
USD/JPY is trading at 158.31 (+0.17%), testing the upper bounds of its 20-day ascending channel as bullish momentum builds. The pair remains firmly above both the 20-day (157.06) and 50-day (157.67) SMAs, confirming the short-term uptrend. However, the conflicting channel slopes — a 20-day ascending channel versus a 50-day descending one — highlight the tug-of-war between near-term bullishness and medium-term bearish pressure. The immediate dynamic support sits at 157.58 (-73.0 pips), while resistance looms at 158.90 (+58.8 pips) from the descending 50-day trendline. A break above this level could accelerate gains toward the 20-day dynamic resistance at 160.49 (+217.9 pips).
Static levels show sparse recent activity, with the nearest notable resistance at 159.85 (+172.8 pips) and support far below at 146.58 (-1154.2 pips), rendering them less relevant for intraday trading. The RSI at 62.2 suggests neutral momentum, leaving room for further upside before overbought conditions emerge. With the ATR at 1.05, today’s range of 157.58–158.30 aligns with typical volatility.
The short-term bias leans bullish as long as price holds above the 20-day SMA and dynamic support at 157.58. A close above 158.90 would confirm breakout potential toward 160.49, while a drop below 157.58 could trigger a retest of the 50-day SMA at 157.67. Watch for US session momentum to dictate whether the pair challenges the descending 50-day resistance or consolidates near current levels. The next catalyst will be whether the 20-day ascending channel can overpower the broader 50-day downtrend.
Disclaimer
The content on MarketsFN.com is provided for educational and informational purposes only and does not constitute financial advice. All investments involve risk and past performance does not guarantee future results.