USD/JPY: Up 0.02% to 157.31 — Ascending Channel
MarketsFN Team
USD/JPY: Up 0.02% to 157.31 — Ascending Channel
Published: September 30, 2026 · MarketsFN Team · US Session
| Pair | Rate | Change | RSI(14) | SMA-20 | SMA-50 | 52W High | 52W Low | Pivot | R1 | S1 |
|---|---|---|---|---|---|---|---|---|---|---|
| USD/JPY | 157.31 | +0.02% | 63.1 | 156.04 | 158.26 | 163.84 | 150.41 | 157.32 | 157.66 | 156.93 |
📊 Support & Resistance Levels
Dynamic Trendlines
| Level | Type | Direction | Distance |
|---|---|---|---|
| 156.37 | 20d Support | ↗ ascending | -0.59% / 93.3 pips |
| 159.05 | 20d Resistance | → flat | +1.11% / 174.1 pips |
| 151.47 | 50d Support | ↘ descending | -3.71% / 583.9 pips |
| 158.56 | 50d Resistance | ↘ descending | +0.80% / 125.6 pips |
Static Levels
| Level | Type | Touches | Distance |
|---|---|---|---|
| 159.85 | Resistance | 2× | +1.94% / 304.4 pips |
| 157.91 | Resistance | 2× | +0.71% / 110.6 pips |
| 146.58 | Support | 2× | -6.52% / 1022.6 pips |
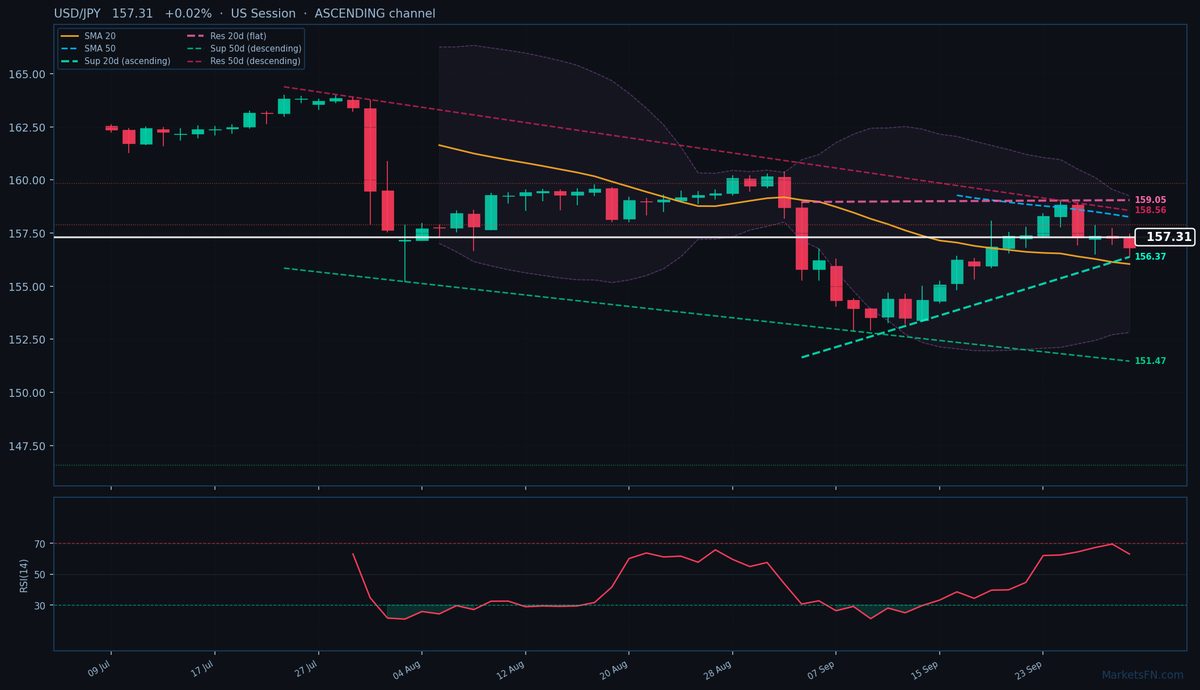
USD/JPY is trading at 157.31 (+0.02%), trapped in a consolidation phase between its 20-day SMA (156.04, +127 pips below) and 50-day SMA (158.26, -95 pips above), reflecting indecision after the pair’s failed attempt to reclaim the 50-day moving average last week. The 20-day dynamic channel remains ascending, with immediate support at 156.37 (-93 pips, tested as today’s low) and resistance at 159.05 (+174 pips, flat). However, the broader 50-day channel is descending, highlighting structural bearish pressure with resistance at 158.56 (+125 pips) and distant support at 151.47 (-584 pips).
Static levels show a congested near-term range, with S1 at 156.93 (-38 pips, aligning with today’s low) and R1 at 157.66 (+35 pips, untested today). The RSI at 63.1 suggests neutral momentum, but the proximity to overbought territory (70+) raises caution for bulls. With ATR(14) at 1.30, today’s 109-pip range is typical, though the failure to hold above the pivot (157.32) signals weak follow-through.
The short-term outlook hinges on whether USD/JPY can breach the 50-day SMA (158.26) to confirm a bullish reversal within the ascending 20-day channel. A break below 156.37 (20-day dynamic support) would expose the 20-day SMA (156.04) and invalidate the near-term uptrend. Watch for US PCE data tomorrow — a hotter print could revive dollar strength and test the descending 50-day resistance (158.56).
Disclaimer
The content on MarketsFN.com is provided for educational and informational purposes only and does not constitute financial advice. All investments involve risk and past performance does not guarantee future results.