USD/JPY: Down 2.06% to 155.42 — Bearish — Below Key MAs
MarketsFN Team
USD/JPY: Down 2.06% to 155.42 — Bearish — Below Key MAs
Published: September 03, 2026 · MarketsFN Team · US Session
| Pair | Rate | Change | RSI(14) | SMA-20 | SMA-50 | 52W High | 52W Low | Pivot | R1 | S1 |
|---|---|---|---|---|---|---|---|---|---|---|
| USD/JPY | 155.42 | -2.06% | 35.4 | 159.11 | 160.63 | 163.84 | 146.46 | 159.09 | 159.99 | 157.79 |
📊 Support & Resistance Levels
Dynamic Trendlines
| Level | Type | Direction | Distance |
|---|---|---|---|
| 156.35 | 20d Support | → flat | +0.60% / 92.6 pips |
| 160.45 | 20d Resistance | ↗ ascending | +3.23% / 502.2 pips |
| 152.32 | 50d Support | ↘ descending | -2.00% / 310.4 pips |
| 161.11 | 50d Resistance | ↘ descending | +3.66% / 568.5 pips |
Static Levels
| Level | Type | Touches | Distance |
|---|---|---|---|
| 159.85 | Resistance | 2× | +1.81% / 283.8 pips |
| 157.91 | Resistance | 2× | +0.57% / 89.9 pips |
| 146.59 | Support | 3× | -6.64% / 1042.0 pips |
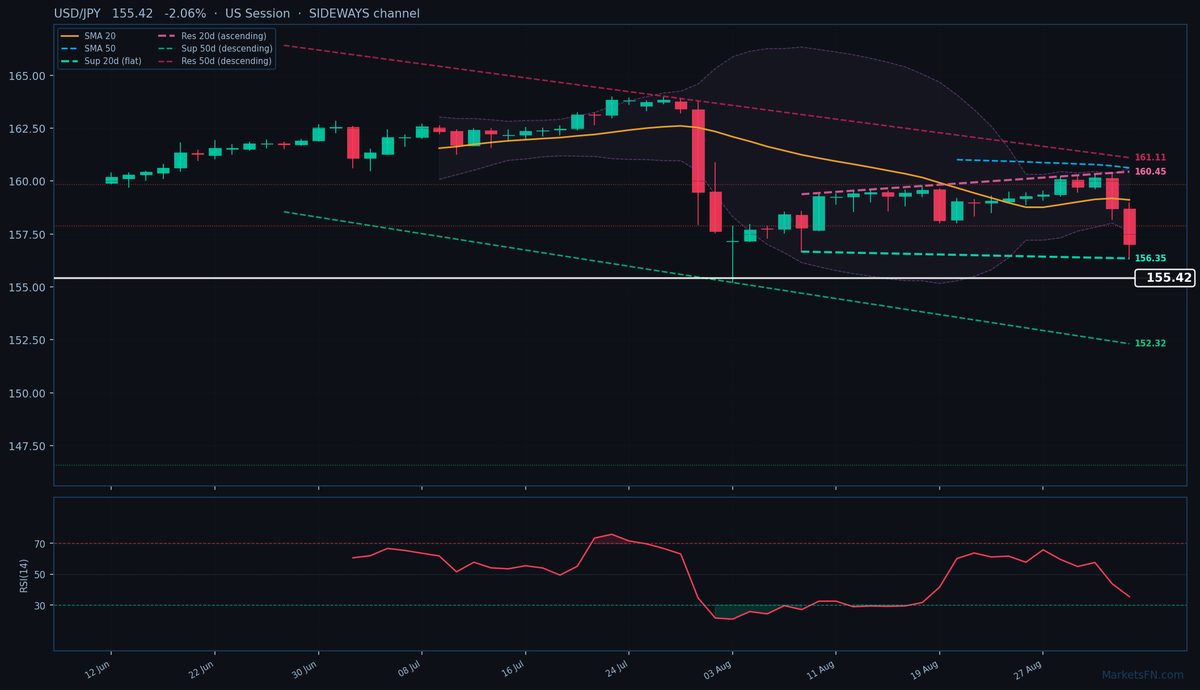
USD/JPY is trading at 155.42 (-2.06%), breaking decisively below its 20-day and 50-day SMAs (159.11 and 160.63 respectively) in a bearish confirmation of the downtrend. The pair has now erased 92.6 pips from the 20-day dynamic support trendline at 156.35, which is flat and acting as immediate resistance. The 20-day channel remains sideways, but the 50-day dynamic channel is firmly descending, with resistance at 161.11 (568.5 pips above) and support at 152.32 (310.4 pips below). This structural weakness suggests further downside potential unless the pair reclaims the 20-day SMA.
Static levels highlight the bearish momentum: R1 at 157.91 (89.9 pips above) is the nearest resistance, while S1 at 146.59 (1,042 pips below) remains distant but within the descending channel’s trajectory. The RSI at 35.4 is neutral but leaning oversold, indicating room for continuation or consolidation before a potential reversal. With the ATR at 1.01, today’s 2.06% drop is unusually volatile, suggesting capitulation by USD bulls.
Short-term, the pair must hold above the 20-day dynamic support at 156.35 to avoid a retest of the 50-day dynamic support at 152.32. A close above R1 (157.91) would signal a relief rally, but the descending 50-day resistance at 161.11 remains the key hurdle for any bullish reversal. Watch for US session liquidity to confirm whether this breakdown sustains or attracts dip-buyers. The next 48 hours will test whether this is a technical correction or the start of a deeper trend reversal.
Disclaimer
The content on MarketsFN.com is provided for educational and informational purposes only and does not constitute financial advice. All investments involve risk and past performance does not guarantee future results.