USD/JPY: Down 1.18% to 154.38 — Descending Channel
MarketsFN Team
USD/JPY: Down 1.18% to 154.38 — Descending Channel
Published: September 07, 2026 · MarketsFN Team · US Session
| Pair | Rate | Change | RSI(14) | SMA-20 | SMA-50 | 52W High | 52W Low | Pivot | R1 | S1 |
|---|---|---|---|---|---|---|---|---|---|---|
| USD/JPY | 154.38 | -1.18% | 32.7 | 158.98 | 160.49 | 163.84 | 146.46 | 156.68 | 158.07 | 154.40 |
📊 Support & Resistance Levels
Dynamic Trendlines
| Level | Type | Direction | Distance |
|---|---|---|---|
| 155.17 | 20d Support | ↘ descending | +0.51% / 78.6 pips |
| 160.50 | 20d Resistance | ↗ ascending | +3.96% / 612.0 pips |
| 152.48 | 50d Support | ↘ descending | -1.23% / 190.2 pips |
| 160.45 | 50d Resistance | ↘ descending | +3.93% / 606.9 pips |
Static Levels
| Level | Type | Touches | Distance |
|---|---|---|---|
| 159.85 | Resistance | 2× | +2.32% / 362.4 pips |
| 157.91 | Resistance | 2× | +1.08% / 168.5 pips |
| 146.59 | Support | 3× | -6.17% / 963.4 pips |
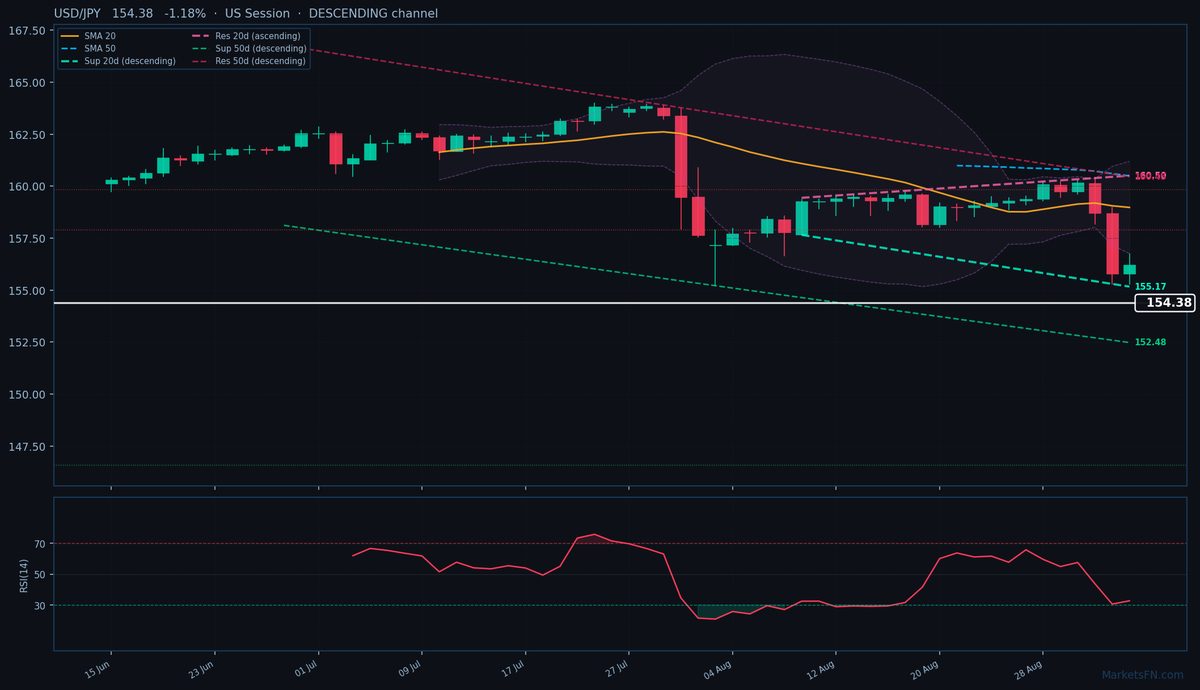
USD/JPY is trading at 154.38 (-1.18%), accelerating its downtrend as it breaches the psychologically critical 155.00 level and confirms bearish momentum below both the 20-day (158.98) and 50-day (160.49) SMAs. The pair now sits 4.60% below its 50-day average, the widest negative deviation since March, signaling entrenched selling pressure. Price action is firmly contained within a descending 20-day channel (slope -0.68%), with immediate dynamic resistance at 160.50 (+612 pips, ascending) and support at 155.17 (-78.6 pips, descending). The 50-day channel paints a steeper bearish picture with resistance at 160.45 (+606.9 pips, descending) and support at 152.48 (-190.2 pips, descending).
Static levels highlight the lack of nearby support, with S1 at 146.59 (-963.4 pips) far below current trading. The nearest meaningful resistance cluster is R1 at 157.91 (+168.5 pips), which aligns with the 20-day SMA — now a key upside cap. RSI at 32.7 shows room for further downside before oversold conditions emerge, while the ATR of 1.13 suggests today’s 145-pip range exceeds typical volatility.
The short-term outlook remains bearish unless USD/JPY reclaims the 20-day SMA (158.98), with the next test being whether the pair holds above the 20-day dynamic support at 155.17 (-78.6 pips). A break below this level would confirm acceleration toward the 50-day dynamic support at 152.48. Watch for intervention rhetoric from Japanese officials as the pair approaches 153.00, historically a trigger zone for verbal jawboning.
Disclaimer
The content on MarketsFN.com is provided for educational and informational purposes only and does not constitute financial advice. All investments involve risk and past performance does not guarantee future results.