USD/JPY: Down 0.29% to 156.81 — Price Holds Above SMA-20
MarketsFN Team
USD/JPY: Down 0.29% to 156.81 — Price Holds Above SMA-20
Published: September 30, 2026 · MarketsFN Team
| Pair | Rate | Change | RSI(14) | SMA-20 | SMA-50 | 52W High | 52W Low | Pivot | R1 | S1 |
|---|---|---|---|---|---|---|---|---|---|---|
| USD/JPY | 156.81 | -0.29% | 67.4 | 156.10 | 158.37 | 163.86 | 153.42 | 157.35 | 157.70 | 157.01 |
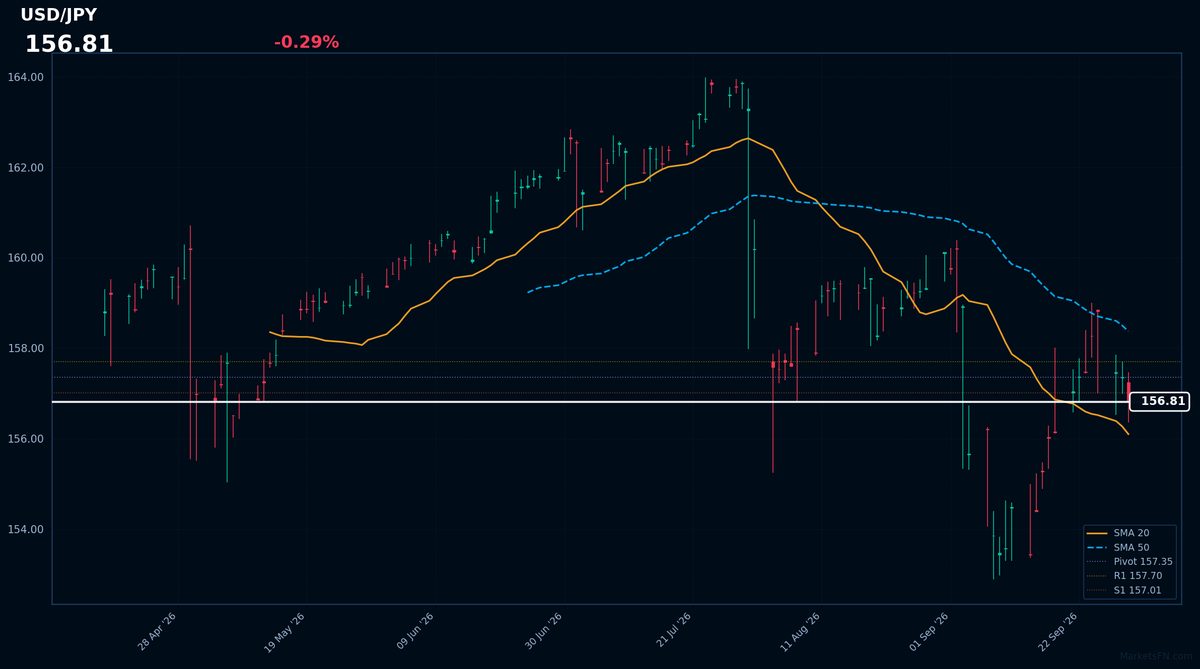
USD/JPY is trading at 156.81, down 0.29% on the day, as it consolidates near the lower end of its recent range. The pair has been oscillating within a 153.42 to 163.86 band over the past 52 weeks, and today's move continues this contained price action. The rate is currently positioned above its 20-day simple moving average of 156.10, indicating some short-term strength, but remains below the 50-day SMA of 158.37, suggesting the longer-term trend is still bearish.
From a technical perspective, the RSI is at 67.4, indicating neutral territory and neither overbought nor oversold conditions. The average true range is 1.40, suggesting moderate daily volatility. The pivot point is at 157.35, with resistance at 157.70 (R1) and support at 157.01 (S1). The current price action is testing the support level, with a break below 157.01 potentially leading to further downside.
The market may be underpricing the potential for a continued consolidation phase, given the conflicting signals from the short and longer-term moving averages. A break above the 50-day SMA would be required to confirm a more significant bullish reversal. The forward catalyst to watch is the US non-farm payrolls data, due out later this week, which could provide a catalyst for a breakout or further consolidation.
Disclaimer
The content on MarketsFN.com is provided for educational and informational purposes only. It does not constitute financial advice or investment recommendations. All investments involve risks and past performance does not guarantee future results. You are solely responsible for your investment decisions.