USD/JPY: Down 0.24% to 159.71 — Ascending Channel
MarketsFN Team
USD/JPY: Down 0.24% to 159.71 — Ascending Channel
Published: August 31, 2026 · MarketsFN Team · US Session
| Pair | Rate | Change | RSI(14) | SMA-20 | SMA-50 | 52W High | 52W Low | Pivot | R1 | S1 |
|---|---|---|---|---|---|---|---|---|---|---|
| USD/JPY | 159.71 | -0.24% | 55.6 | 159.02 | 160.81 | 163.84 | 146.46 | 159.86 | 160.43 | 159.53 |
📊 Support & Resistance Levels
Dynamic Trendlines
| Level | Type | Direction | Distance |
|---|---|---|---|
| 159.08 | 20d Support | ↗ ascending | -0.39% / 62.5 pips |
| 160.30 | 20d Resistance | ↗ ascending | +0.37% / 58.9 pips |
| 151.71 | 50d Support | ↘ descending | -5.01% / 800.1 pips |
| 162.43 | 50d Resistance | ↘ descending | +1.70% / 272.0 pips |
Static Levels
| Level | Type | Touches | Distance |
|---|---|---|---|
| 159.85 | Resistance | 2× | +0.04% / 7.0 pips |
| 146.59 | Support | 3× | -8.25% / 1318.9 pips |
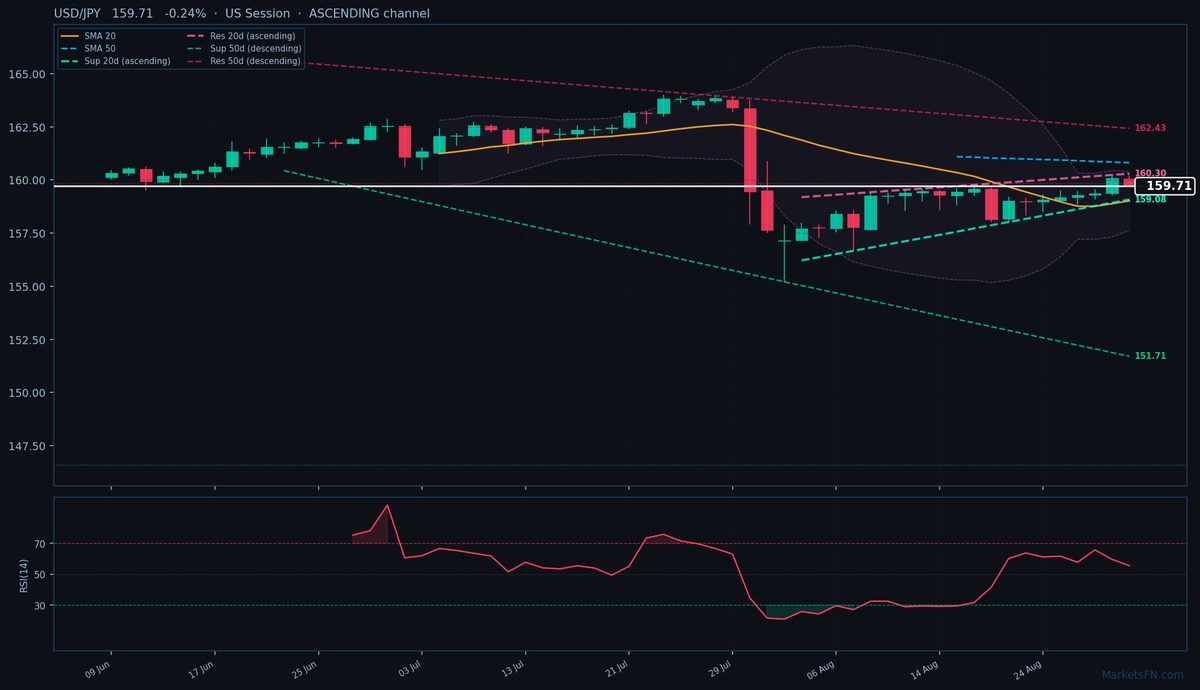
USD/JPY is trading at 159.71 (-0.24%), caught in a textbook consolidation phase between its 20-day SMA (159.02, +69 pips above) and 50-day SMA (160.81, -110 pips below). The pair is compressing within an ascending 20-day dynamic channel, with immediate support at 159.08 (-62.5 pips) and resistance at 160.30 (+58.9 pips) — a tight 119-pip range that reflects indecision ahead of key US data. The broader 50-day channel remains descending, but its extreme support (151.71, -800 pips) and resistance (162.43, +272 pips) are too distant to matter tactically.
Static levels show a near-term battleground at R1 (159.85, +7 pips), which aligns with today’s high (160.19) and could cap upside attempts. The RSI at 55.6 confirms neutral momentum, though the pair’s failure to hold above the 20-day SMA suggests fading bullish conviction. With ATR at 0.77, today’s range (159.73-160.19) is unusually tight — typically a precursor to volatility expansion.
The immediate risk is a retest of the 20-day dynamic support (159.08), which would confirm the consolidation’s lower bound. A break above R1 (159.85) needs to clear the 50-day SMA (160.81) to signal renewed upside. Watch for today’s US core PCE data — any miss could trigger a test of the 20-day dynamic support, while a beat may fuel a squeeze toward 160.30 resistance. The ascending 20-day channel favors buying dips, but only above 159.08.
Disclaimer
The content on MarketsFN.com is provided for educational and informational purposes only and does not constitute financial advice. All investments involve risk and past performance does not guarantee future results.