USD/HUF: Up 0.68% to 316.23 — Descending Channel
MarketsFN Team
USD/HUF: Up 0.68% to 316.23 — Descending Channel
Published: September 01, 2026 · MarketsFN Team · US Session · Emerging FX
| Pair | Rate | Change | RSI(14) | SMA-20 | SMA-50 | 52W High | 52W Low | Pivot | R1 | S1 |
|---|---|---|---|---|---|---|---|---|---|---|
| USD/HUF | 316.23 | +0.68% | 48.4 | 313.32 | 313.56 | 343.74 | 300.33 | 314.40 | 315.05 | 313.44 |
S/R Support & Resistance Levels
Dynamic Trendlines
| Level | Type | Direction | Distance |
|---|---|---|---|
| 306.94 | 20d Support | down (descending) | -2.94% / 929.6 pips |
| 315.16 | 20d Resistance | down (descending) | -0.34% / 107.0 pips |
| 308.03 | 50d Support | flat (flat) | -2.59% / 820.1 pips |
| 319.22 | 50d Resistance | down (descending) | +0.95% / 299.1 pips |
Static Levels
| Level | Type | Touches | Distance |
|---|---|---|---|
| 344.84 | Resistance | 2x | +9.48% / 2986.1 pips |
| 332.94 | Resistance | 2x | +5.70% / 1796.6 pips |
| 315.15 | Resistance | 2x | +0.05% / 16.8 pips |
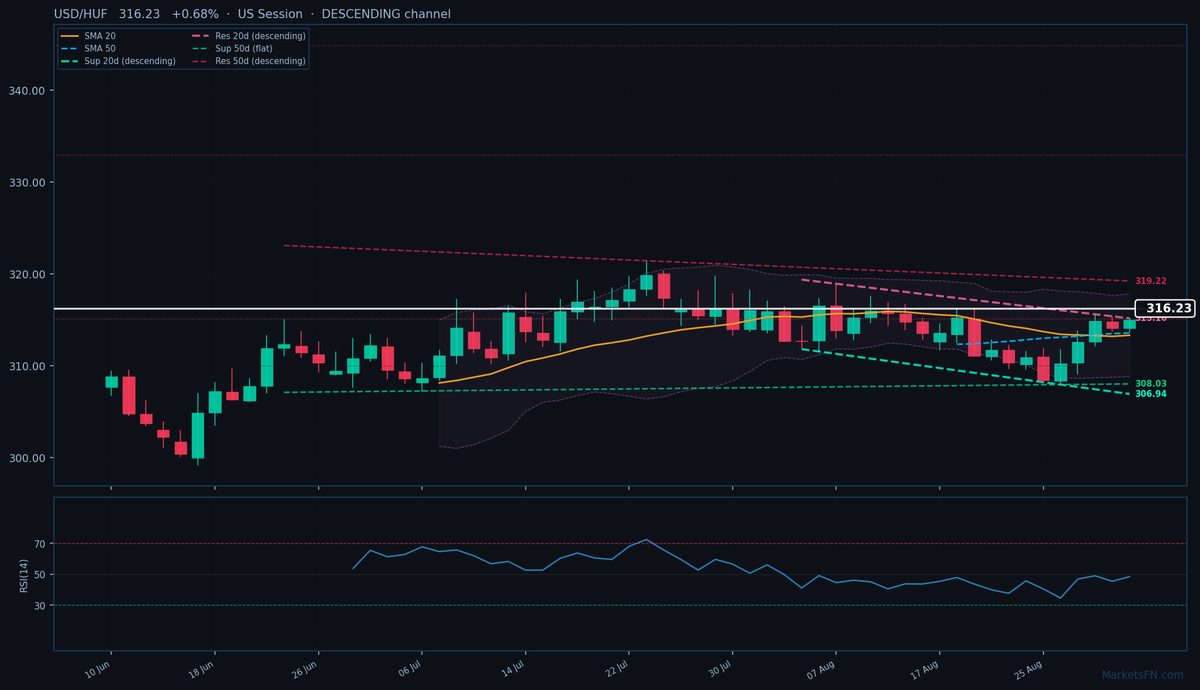
USD/HUF is trading at 316.23 (+0.68%), testing the upper bounds of a descending 20-day channel as the pair consolidates above key moving averages. The rate sits firmly above both the SMA-20 (313.32) and SMA-50 (313.56), confirming short-term bullish momentum despite the broader downtrend. However, the 20-day dynamic resistance trendline looms just 107.0 pips above at 315.16, while the 50-day dynamic resistance is 299.1 pips away at 319.22 — both descending, reflecting persistent selling pressure at higher levels. Static resistance at R1 (315.15) is only 16.8 pips away, having been tested twice previously, while S1 support at 313.44 sits 279.0 pips below.
The RSI at 48.4 remains neutral, offering no clear directional bias, but the pair’s ability to hold above the SMAs suggests underlying demand. With the 20-day channel descending and the 50-day channel sideways, the immediate upside appears capped unless USD/HUF can decisively break the 315.15-315.16 confluence zone. Failure to do so may see a retest of the SMA-20/SMA-50 cluster near 313.30-313.60.
Short-term traders should watch for a close above 315.16 to confirm a breakout, which could target 319.22 next. Conversely, a rejection here may trigger a pullback toward 313.44 support. The European session’s price action will be critical — a sustained hold above 315.15 would signal bullish conviction in an otherwise bearish medium-term structure.
Disclaimer
The content on MarketsFN.com is provided for educational and informational purposes only and does not constitute financial advice. All investments involve risk and past performance does not guarantee future results.