USD/HUF: Down 1.02% to 325.05 — RSI Overbought
MarketsFN Team
USD/HUF: Down 1.02% to 325.05 — RSI Overbought
Published: October 06, 2026 · MarketsFN Team · US Session · Emerging FX
| Pair | Rate | Change | RSI(14) | SMA-20 | SMA-50 | 52W High | 52W Low | Pivot | R1 | S1 |
|---|---|---|---|---|---|---|---|---|---|---|
| USD/HUF | 325.05 | -1.02% | 76.0 | 318.97 | 315.80 | 343.74 | 300.33 | 327.21 | 329.03 | 325.28 |
S/R Support & Resistance Levels
Dynamic Trendlines
| Level | Type | Direction | Distance |
|---|---|---|---|
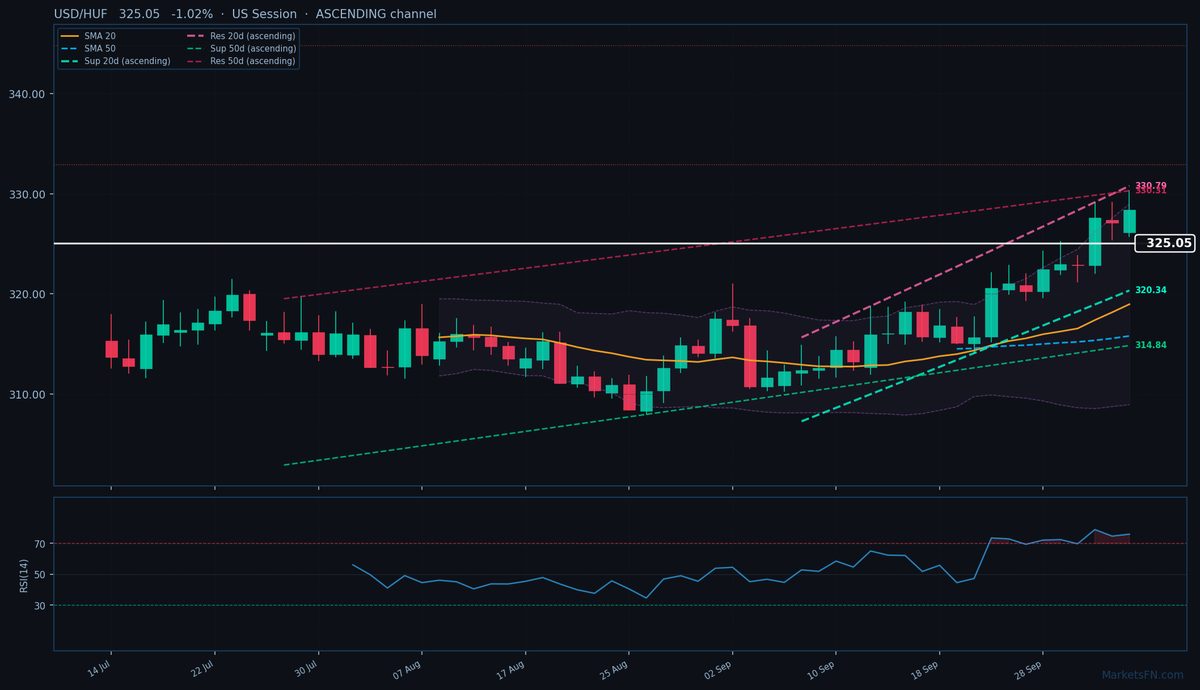
| 320.34 | 20d Support | up (ascending) | -1.45% / 471.1 pips |
| 330.79 | 20d Resistance | up (ascending) | +1.77% / 574.1 pips |
| 314.84 | 50d Support | up (ascending) | -3.14% / 1021.2 pips |
| 330.31 | 50d Resistance | up (ascending) | +1.62% / 525.7 pips |
Static Levels
| Level | Type | Touches | Distance |
|---|---|---|---|
| 344.84 | Resistance | 2x | +5.01% / 1643.8 pips |
| 332.94 | Resistance | 2x | +1.38% / 454.3 pips |
USD/HUF is trading at 325.05 (-1.02%), retreating from yesterday's close of 328.40 but holding firmly above both the 20-day (318.97) and 50-day (315.80) SMAs, confirming the broader uptrend remains intact. The pair is trading within an ascending 20-day dynamic channel (support at 320.34, -471.1 pips; resistance at 330.79, +574.1 pips), with the 50-day channel also sloping upward (support at 314.84, -1021.2 pips; resistance at 330.31, +525.7 pips). This structure suggests persistent bullish momentum, though today's pullback tests the immediate static support at S1 (325.28, just 23 pips below current levels), while R1 (329.03) looms 398 pips above.
The RSI(14) at 76.0 flags overbought conditions, potentially capping near-term gains, but the sustained break above key moving averages and the ascending channel tilt the bias upward. Today's European session range (325.74-330.31) shows sellers defending the 330 handle, but the higher lows pattern since late August remains unchallenged. A decisive hold above S1 could see a retest of dynamic resistance near 330.31-330.79, while a breakdown below 325.28 opens a path toward the 20-day SMA at 318.97.
Watch for a close above 327.21 (today's pivot) to confirm bullish continuation, or a break below 325.28 to signal deeper correction. The next catalyst is Hungary's October 10 CPI print—hotter-than-expected inflation could revive HUF selling pressure given the MNB's dovish tilt.
Disclaimer
The content on MarketsFN.com is provided for educational and informational purposes only and does not constitute financial advice. All investments involve risk and past performance does not guarantee future results.