USD/HUF: Down 0.38% to 310.56 — Descending Channel
MarketsFN Team
USD/HUF: Down 0.38% to 310.56 — Descending Channel
Published: August 21, 2026 · MarketsFN Team · US Session · Emerging FX
| Pair | Rate | Change | RSI(14) | SMA-20 | SMA-50 | 52W High | 52W Low | Pivot | R1 | S1 |
|---|---|---|---|---|---|---|---|---|---|---|
| USD/HUF | 310.56 | -0.38% | 38.8 | 314.36 | 312.67 | 343.74 | 300.33 | 311.72 | 312.79 | 310.66 |
S/R Support & Resistance Levels
Dynamic Trendlines
| Level | Type | Direction | Distance |
|---|---|---|---|
| 310.55 | 20d Support | down (descending) | -0.00% / 1.5 pips |
| 316.25 | 20d Resistance | down (descending) | +1.83% / 568.9 pips |
| 310.55 | 50d Support | up (ascending) | -0.01% / 1.6 pips |
| 327.21 | 50d Resistance | up (ascending) | +5.36% / 1664.8 pips |
Static Levels
| Level | Type | Touches | Distance |
|---|---|---|---|
| 344.84 | Resistance | 2x | +10.87% / 3379.6 pips |
| 332.94 | Resistance | 2x | +7.04% / 2190.1 pips |
| 315.15 | Resistance | 2x | +1.32% / 410.3 pips |
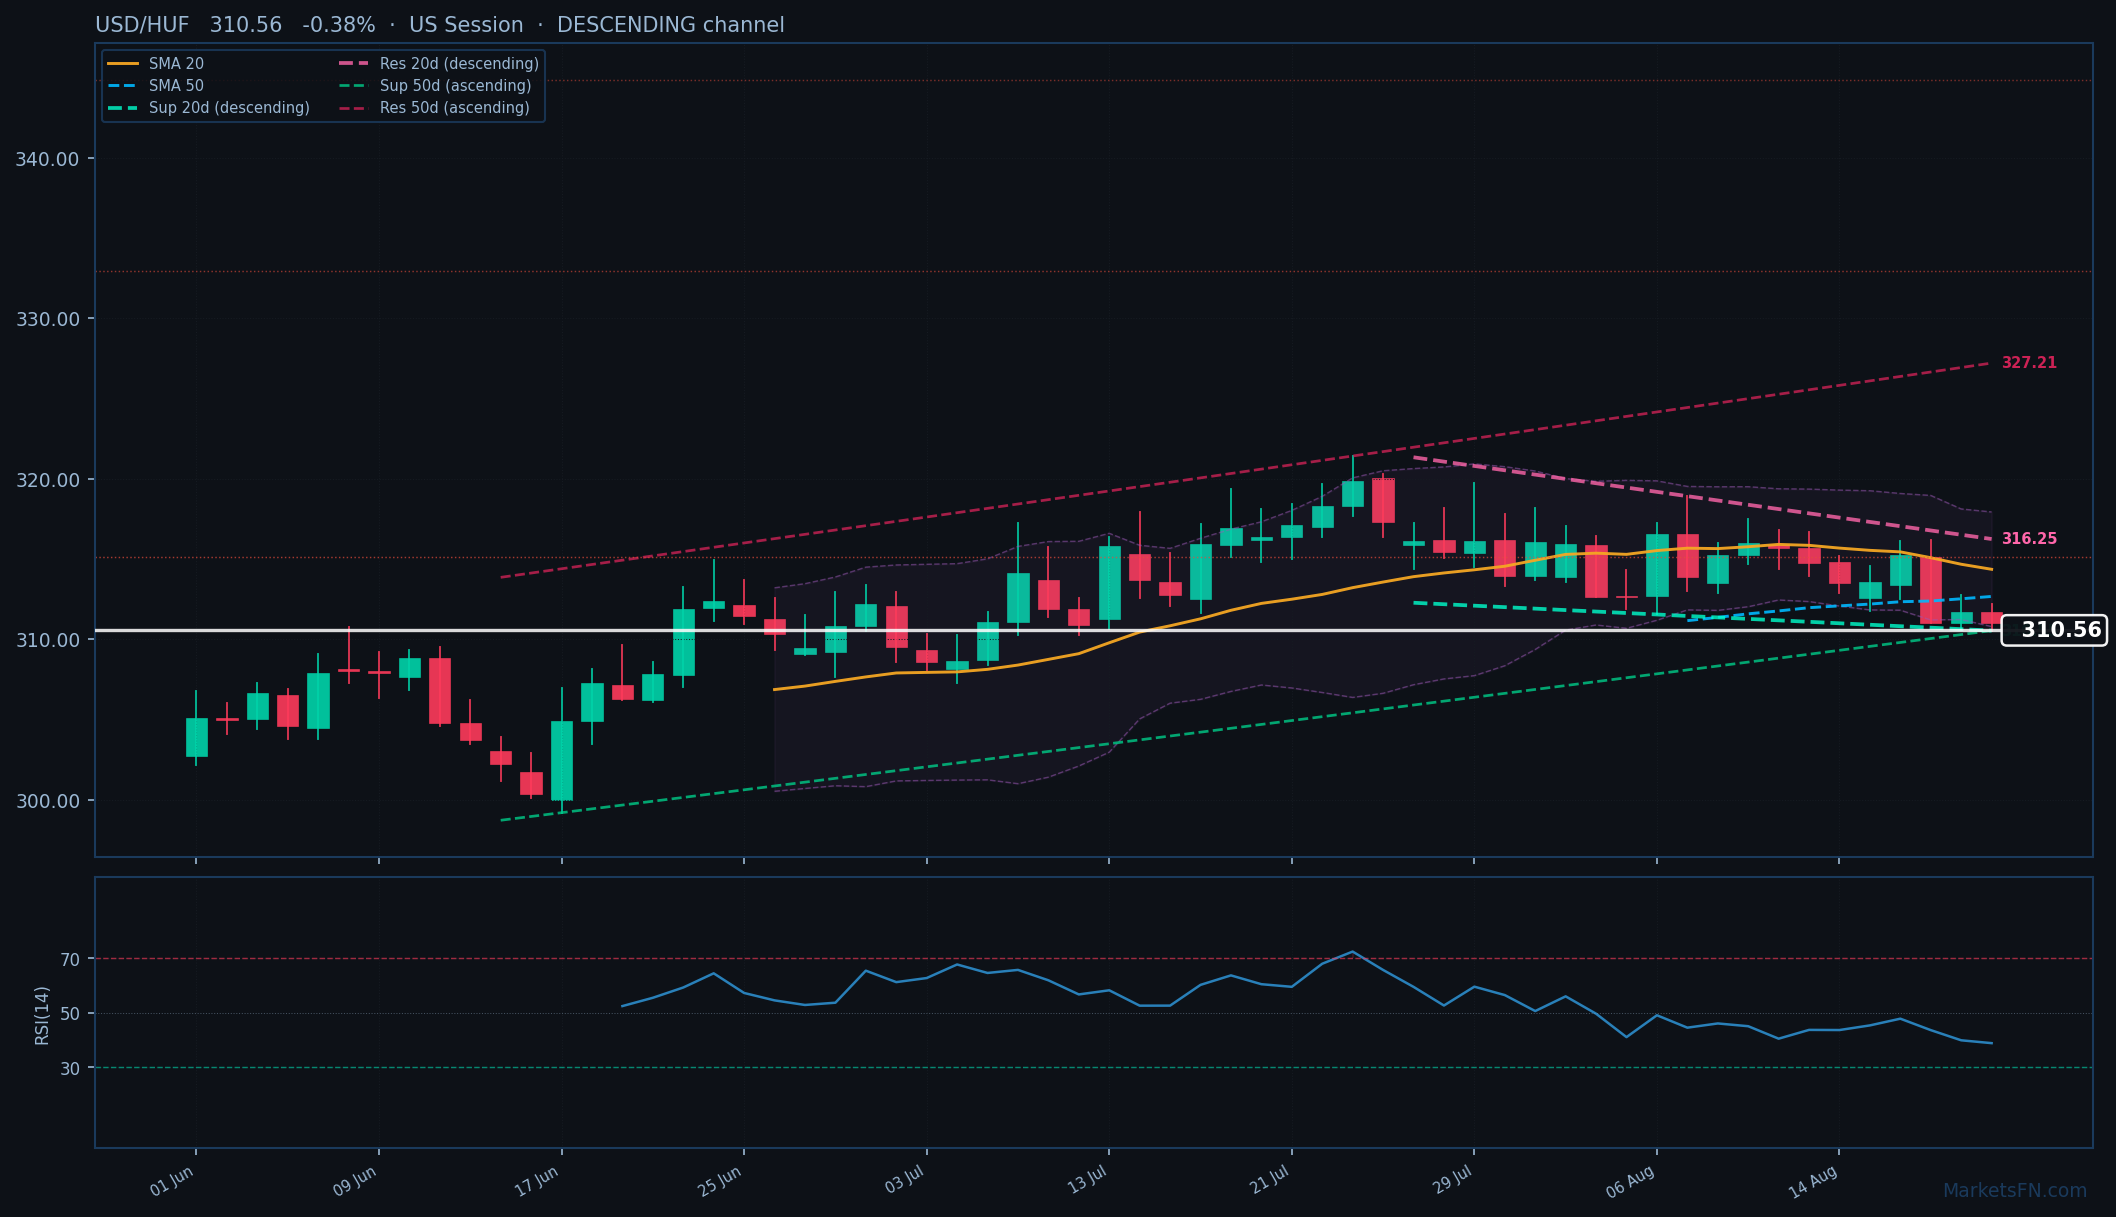
USD/HUF is trading at 310.56 (-0.38%) as it continues to exhibit a downtrend, closing below both the 20-day simple moving average (SMA) of 314.36 and the 50-day SMA of 312.67. This positioning indicates bearish sentiment, with the price action reflecting a lack of upward momentum. The 20-day dynamic support trendline is positioned at 310.55, just 1.5 pips below the current rate, while the 20-day dynamic resistance trendline stands at 316.25, 568.9 pips above, reinforcing the descending channel structure.
In terms of static levels, the nearest support level is S1 at 310.66, only 10 pips above the current price, while the first resistance level, R1, is at 312.79, 223 pips away. These levels will be critical in determining short-term price movements. The RSI(14) is currently at 38.8, indicating neutral territory, which suggests that the market is neither overbought nor oversold, but it does reflect a lack of bullish conviction.
Looking ahead, the short-term outlook remains cautious as the USD/HUF is trapped within a descending channel. A breach below the dynamic support at 310.55 could signal further downside potential, while a move above R1 at 312.79 would indicate a shift in momentum. Traders should watch for any developments that could influence market sentiment, particularly economic data releases or geopolitical events that may impact the Hungarian Forint.
Disclaimer
The content on MarketsFN.com is provided for educational and informational purposes only and does not constitute financial advice. All investments involve risk and past performance does not guarantee future results.