USD/CHF: Up 0.29% to 0.8335 — Ascending Channel
MarketsFN Team
USD/CHF: Up 0.29% to 0.8335 — Ascending Channel
Published: October 07, 2026 · MarketsFN Team · US Session
| Pair | Rate | Change | RSI(14) | SMA-20 | SMA-50 | 52W High | 52W Low | Pivot | R1 | S1 |
|---|---|---|---|---|---|---|---|---|---|---|
| USD/CHF | 0.8335 | +0.29% | 62.7 | 0.8249 | 0.8148 | 0.8357 | 0.7632 | 0.8312 | 0.8325 | 0.8298 |
📊 Support & Resistance Levels
Dynamic Trendlines
| Level | Type | Direction | Distance |
|---|---|---|---|
| 0.8260 | 20d Support | ↗ ascending | -0.90% / 75.2 pips |
| 0.8431 | 20d Resistance | ↗ ascending | +1.14% / 95.2 pips |
| 0.8238 | 50d Support | ↗ ascending | -1.17% / 97.5 pips |
| 0.8401 | 50d Resistance | ↗ ascending | +0.78% / 65.2 pips |
Static Levels
| Level | Type | Touches | Distance |
|---|---|---|---|
| 0.8044 | Support | 2× | -3.49% / 291.0 pips |
| 0.7909 | Support | 2× | -5.11% / 426.1 pips |
| 0.7766 | Support | 3× | -6.83% / 569.3 pips |
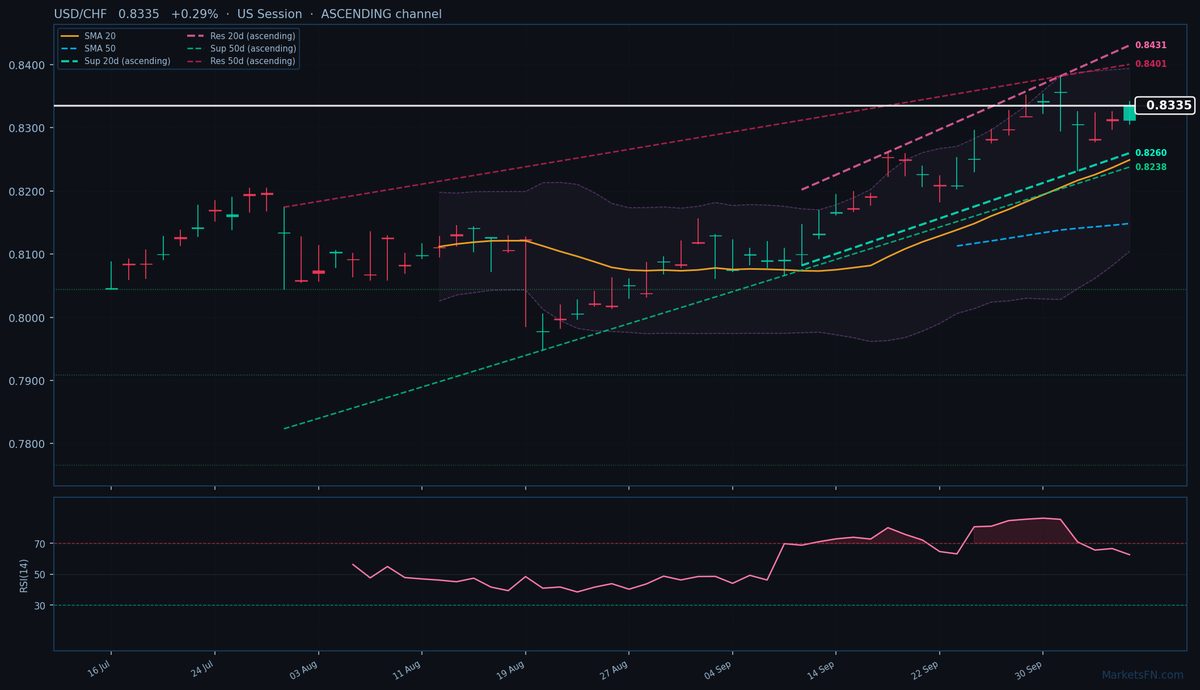
USD/CHF is trading at 0.8335 (+0.29%), testing the upper bounds of its 52-week range (0.8357) as the pair extends its bullish momentum. The rate sits comfortably above both the 20-day (0.8249) and 50-day (0.8148) SMAs, confirming the uptrend’s structural integrity. Today’s push into the 0.8342 session high brings the pair within 22.2 pips of the yearly peak, a critical technical threshold that could trigger profit-taking or breakout acceleration.
The 20-day dynamic channel remains ascending, with immediate support at 0.8260 (-75.2 pips) and resistance at 0.8431 (+95.2 pips). The 50-day channel mirrors this structure (support: 0.8238, -97.5 pips; resistance: 0.8401, +65.2 pips), reinforcing the broader uptrend. Static levels show sparse nearby support, with S1 at 0.8044 (-291.0 pips) — too distant to matter intraday — while R1 at 0.8325 (-10 pips) was breached early in the session.
RSI at 62.7 suggests neutral momentum, leaving room for further upside before overbought conditions emerge. The ATR(14) of 0.0056 indicates today’s range expansion is within normal volatility bounds. Short-term, the 52-week high at 0.8357 is the clear battleground — a break could open a path to 0.8400, while rejection may test dynamic support near 0.8260. Watch for US session flows to confirm whether this is a genuine breakout or exhaustion ahead of the psychological 0.8350 level.
Disclaimer
The content on MarketsFN.com is provided for educational and informational purposes only and does not constitute financial advice. All investments involve risk and past performance does not guarantee future results.