USD/CHF: Up 0.09% to 0.8168 — RSI Overbought
MarketsFN Team
USD/CHF: Up 0.09% to 0.8168 — RSI Overbought
Published: September 14, 2026 · MarketsFN Team · US Session
| Pair | Rate | Change | RSI(14) | SMA-20 | SMA-50 | 52W High | 52W Low | Pivot | R1 | S1 |
|---|---|---|---|---|---|---|---|---|---|---|
| USD/CHF | 0.8168 | +0.09% | 76.2 | 0.8078 | 0.8096 | 0.8189 | 0.7609 | 0.8151 | 0.8181 | 0.8131 |
📊 Support & Resistance Levels
Dynamic Trendlines
| Level | Type | Direction | Distance |
|---|---|---|---|
| 0.8092 | 20d Support | ↗ ascending | -0.93% / 75.9 pips |
| 0.8195 | 20d Resistance | ↗ ascending | +0.32% / 26.1 pips |
| 0.7902 | 50d Support | ↘ descending | -3.26% / 266.5 pips |
| 0.8195 | 50d Resistance | → flat | +0.32% / 26.1 pips |
Static Levels
| Level | Type | Touches | Distance |
|---|---|---|---|
| 0.7924 | Support | 2× | -3.24% / 265.3 pips |
| 0.7910 | Support | 2× | -3.41% / 279.6 pips |
| 0.7904 | Support | 2× | -3.49% / 285.8 pips |
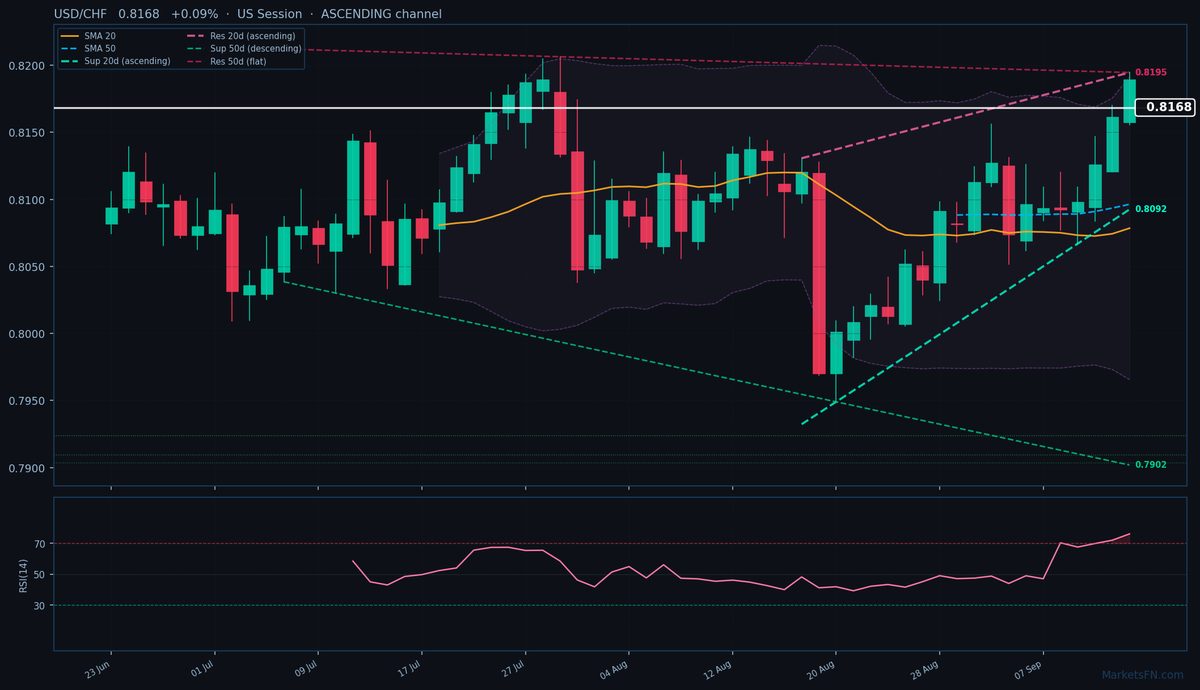
USD/CHF is trading at 0.8168 (+0.09%), testing the upper bounds of its 52-week range (0.8189) as bullish momentum persists. The pair remains firmly in an uptrend, trading above both the 20-day SMA (0.8078) and 50-day SMA (0.8096), with today’s intraday high (0.8195) matching the 20-day dynamic resistance trendline — just 26.1 pips from current levels. The ascending 20-day channel (slope: +0.06%) confirms near-term strength, though the 50-day channel shows conflicting signals with a descending support trendline (-3.51% slope, 266.5 pips below) and flat resistance.
Static levels highlight immediate upside potential, with R1 at 0.8181 (13.3 pips away) as the nearest hurdle, while S1 at 0.8131 (37.7 pips below) offers minor support. The RSI(14) at 76.2 flags overbought conditions, suggesting consolidation or pullback risks near the 52-week high. However, the ATR(14) of 0.0050 indicates subdued volatility, potentially limiting downside.
Short-term, the pair’s ability to hold above the 20-day dynamic support (0.8092, -75.9 pips) will dictate whether the uptrend extends toward the 52-week peak. A break above 0.8195 could trigger a test of 0.8189, while failure to sustain gains may see a retreat toward S1. The US session’s momentum will be pivotal — watch for a close above 0.8181 to confirm bullish continuation.
Disclaimer
The content on MarketsFN.com is provided for educational and informational purposes only and does not constitute financial advice. All investments involve risk and past performance does not guarantee future results.