S&P 5005,963+0.54%
NASDAQ21,443+0.87%
DOW43,892+0.31%
DAX23,888+0.44%
FTSE 1008,721-0.12%
EUR/USD1.1465+0.07%
GBP/USD1.3220+0.14%
USD/JPY161.31-0.03%
Gold3,241+0.22%
WTI Oil76.40+0.81%
Bitcoin103,241+1.43%
10Y UST4.47%-9bp
S&P 5005,963+0.54%
NASDAQ21,443+0.87%
DOW43,892+0.31%
DAX23,888+0.44%
FTSE 1008,721-0.12%
EUR/USD1.1465+0.07%
GBP/USD1.3220+0.14%
USD/JPY161.31-0.03%
Gold3,241+0.22%
WTI Oil76.40+0.81%
Bitcoin103,241+1.43%
10Y UST4.47%-9bp
MarketsFN
Forex

USD/SGD drops after triple resistance test

MarketsFN Team

β€’1 min read
USD/SGD drops after triple resistance test

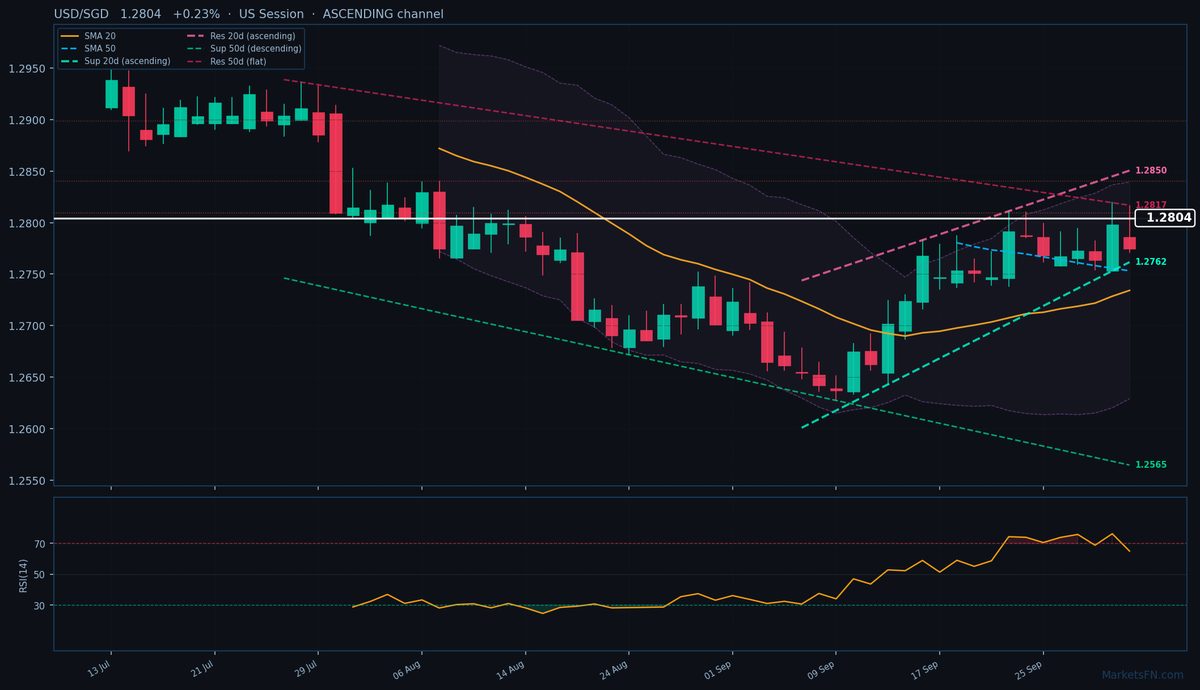
USD/SGD tested its triple top in area 1.3572 and the dropped in three sessions by 0.65%. Today the pair is down by 0.14% to 1.3488.

This one however was not the only technical resistance for the pair because at near last week high there were also the 200 day SMA and the 38.2 Fibonacci retracement of the downtrend started last September and ended in January.

In the reactive spectrum of technical analysis we can say that USD/SGD made a triangle formation where the trendline that links lower lows will be relevant to assess the possible downtrend of the pair. Below 1.33 possible another bearish leg, while in case of a breakout of 1.3572 USD/SGD could rally and and possibly develop a bullish channel, but this is one of the many predictive hypothesis.
Related Articles

GBP/USD: Up 0.16% to 1.3650 β€” RSI Signals Overbought
Trending
Forex

GBP/USD: Up 0.16% to 1.3650 β€” RSI Signals Overbought

MarketsFN Team
1 minAug 21, 2026
AUD/USD: Up 0.52% to 0.7148 β€” Bullish β€” Price Above Key MAs
Trending
Forex

AUD/USD: Up 0.52% to 0.7148 β€” Bullish β€” Price Above Key MAs

MarketsFN Team
1 minAug 21, 2026
Fibonacci Retracement Analysis: EUR/USD and USD/CAD Near Key Levels
Trending
Forex

Fibonacci Retracement Analysis: EUR/USD and USD/CAD Near Key Levels

MarketsFN Team
3 minAug 21, 2026