US jobless claims drop 5.3% to 215,000, signaling labor market stability
MarketsFN Data Team
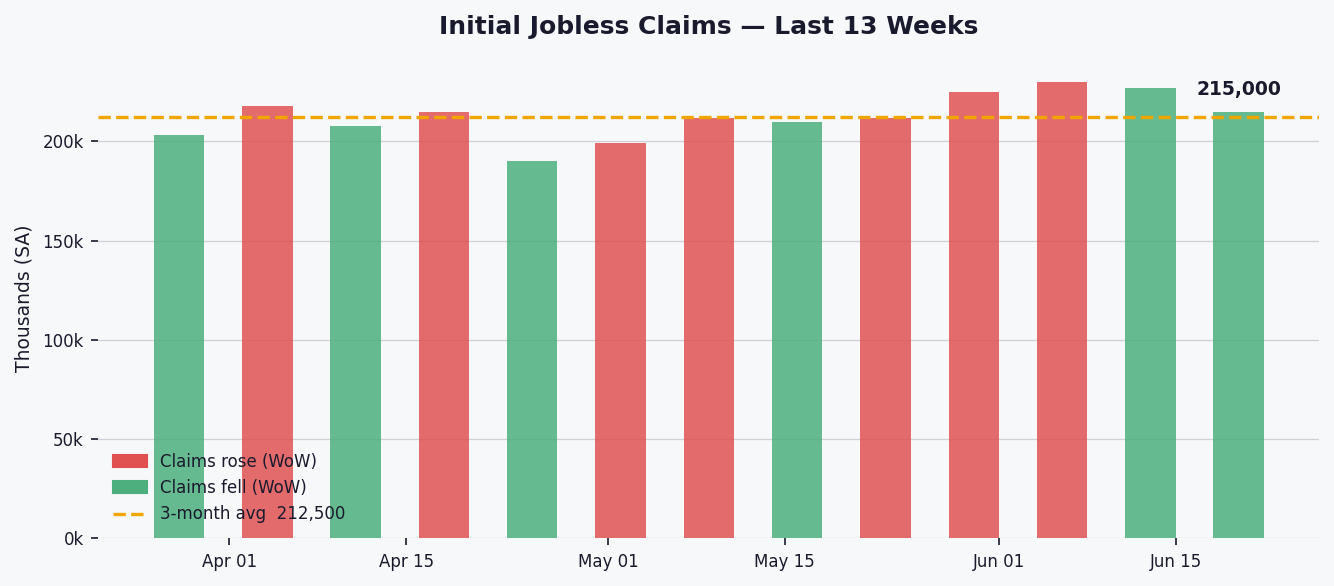
Initial jobless claims fell by 12,000 to 215,000 last week, a 5.3% drop from the previous week, as the labor market showed continued resilience amid steady economic conditions.
The latest figure remains slightly above the 3-month average of 212,500 but is broadly in line with the 1-year (219,774) and 5-year (220,663) averages. Claims are well below the 52-week high of 259,000 and modestly above the yearly low of 190,000, reflecting a stable labor market.
The 4-week moving average of 224,250, down from recent peaks, suggests a gradual easing in volatility, though it remains slightly elevated compared to the 3-month trend. This smoothing indicates a labor market that is holding steady without significant deterioration or overheating.

Continued claims rose by 21,000 to 1,821,000, a 1.2% increase, hinting at a modest uptick in the duration of unemployment spells. The slight rise may reflect seasonal adjustments or a marginal slowdown in rehiring momentum.
Key Statistics at a Glance
| Latest (week ending) | June 20, 2026 |
| Initial claims | 215,000 |
| WoW change | ▼ 12,000 (-5.3%) |
| 4-week moving avg | 224,250 |
| 3-month avg | 212,500 (+1.2% vs current) |
| 1-year avg | 219,774 (-2.2% vs current) |
| 5-year avg | 220,663 (-2.6% vs current) |
| 52-week high | 259,000 |
| 52-week low | 190,000 |
| Continued claims | 1,821,000 |
| Continued claims WoW | +21,000 (+1.2%) |
| Signal | Stable |