S&P 5005,963+0.54%
NASDAQ21,443+0.87%
DOW43,892+0.31%
DAX23,888+0.44%
FTSE 1008,721-0.12%
EUR/USD1.1465+0.07%
GBP/USD1.3220+0.14%
USD/JPY161.31-0.03%
Gold3,241+0.22%
WTI Oil76.40+0.81%
Bitcoin103,241+1.43%
10Y UST4.47%-9bp
S&P 5005,963+0.54%
NASDAQ21,443+0.87%
DOW43,892+0.31%
DAX23,888+0.44%
FTSE 1008,721-0.12%
EUR/USD1.1465+0.07%
GBP/USD1.3220+0.14%
USD/JPY161.31-0.03%
Gold3,241+0.22%
WTI Oil76.40+0.81%
Bitcoin103,241+1.43%
10Y UST4.47%-9bp
MarketsFN
Economics

Jobless Claims Dip to 226,000, Indicating Labour Market Cooling

MarketsFN Data Team
4 min read
Jobless Claims Dip to 226,000, Indicating Labour Market Cooling
Labour Market · Weekly Tracker

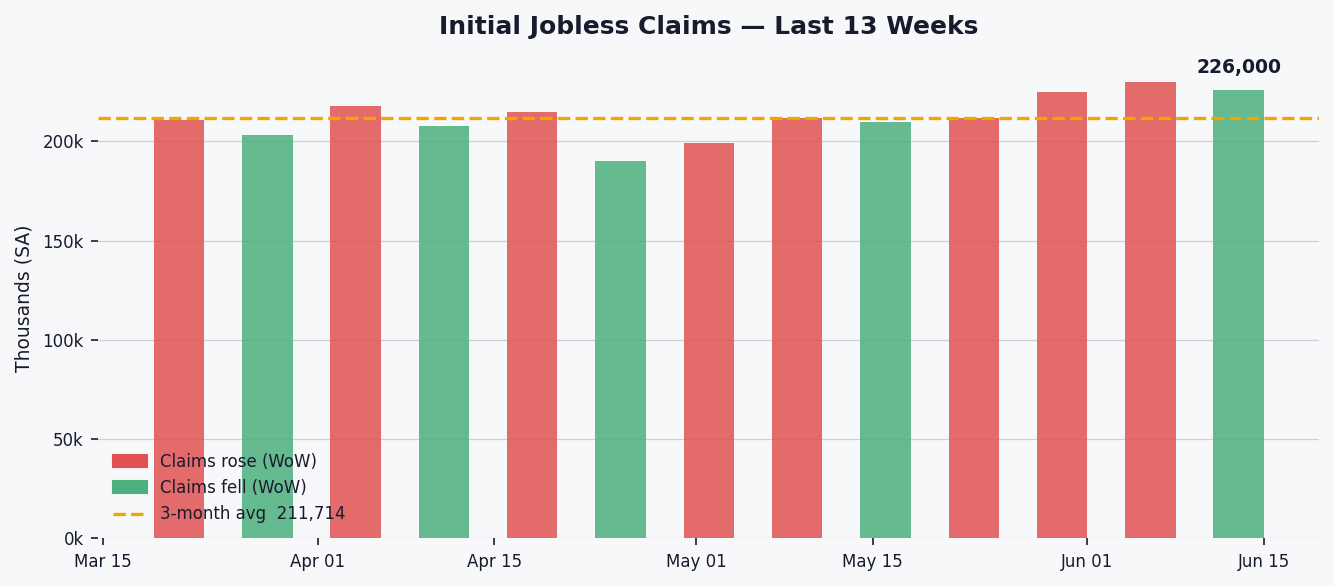
In the week ending June 13, 2026, initial jobless claims fell by 4,000 to 226,000, reflecting a 1.7% decrease from the previous week.

This week's claims are above the 3-month average of 211,714 but below the 1-year average of 220,283 and the 5-year average of 220,644. The 52-week range shows claims peaked at 259,000 and dipped to a low of 190,000, indicating some volatility in the labour market.

The 4-week moving average stands at 223,250, suggesting a slight upward trend in initial claims over the past month. This smoothed figure points to potential cooling in the labour market as employers may be reducing hiring amid economic uncertainties.

36-month trend chart
Fig. 2 — Initial claims (light blue) and 4-week moving average (red) over 36 months. Dashed lines mark 1-year and 3-year averages.

Continued claims rose by 24,000 to 1,810,000, a 1.3% increase week-on-week. This uptick suggests that more workers are remaining on unemployment benefits for longer periods, which could indicate challenges in finding new employment opportunities.

Key Statistics at a Glance

Latest (week ending)June 13, 2026
Initial claims226,000
WoW change▼ 4,000 (-1.7%)
4-week moving avg223,250
3-month avg211,714 (+6.7% vs current)
1-year avg220,283 (+2.6% vs current)
5-year avg220,644 (+2.4% vs current)
52-week high259,000
52-week low190,000
Continued claims1,810,000
Continued claims WoW+24,000 (+1.3%)
SignalCooling
Data: Federal Reserve Bank of St. Louis (FRED) · Series: ICSA, IC4WSA, CCSA · Seasonally adjusted · Released every Thursday by the Bureau of Labor Statistics.
#US Economy#Jobless Claims#Labor Market#Unemployment#BLS#FRED#Federal Reserve#Initial Claims#Weekly Economic Data

Related Articles

Mortgage Rates Edge Up to 6.58%, Pushing Monthly Payments $65 Higher Than Last Year
Economics

Mortgage Rates Edge Up to 6.58%, Pushing Monthly Payments $65 Higher Than Last Year

MarketsFN Data Team
4 minJul 30, 2026
US jobless claims rise to 197,000 but remain near historic lows
Economics

US jobless claims rise to 197,000 but remain near historic lows

MarketsFN Data Team
4 minJul 30, 2026
Inflation Expectations Hit 2.26%, Up 6bps—On Target
Economics

Inflation Expectations Hit 2.26%, Up 6bps—On Target

MarketsFN Data Team
4 minJul 30, 2026