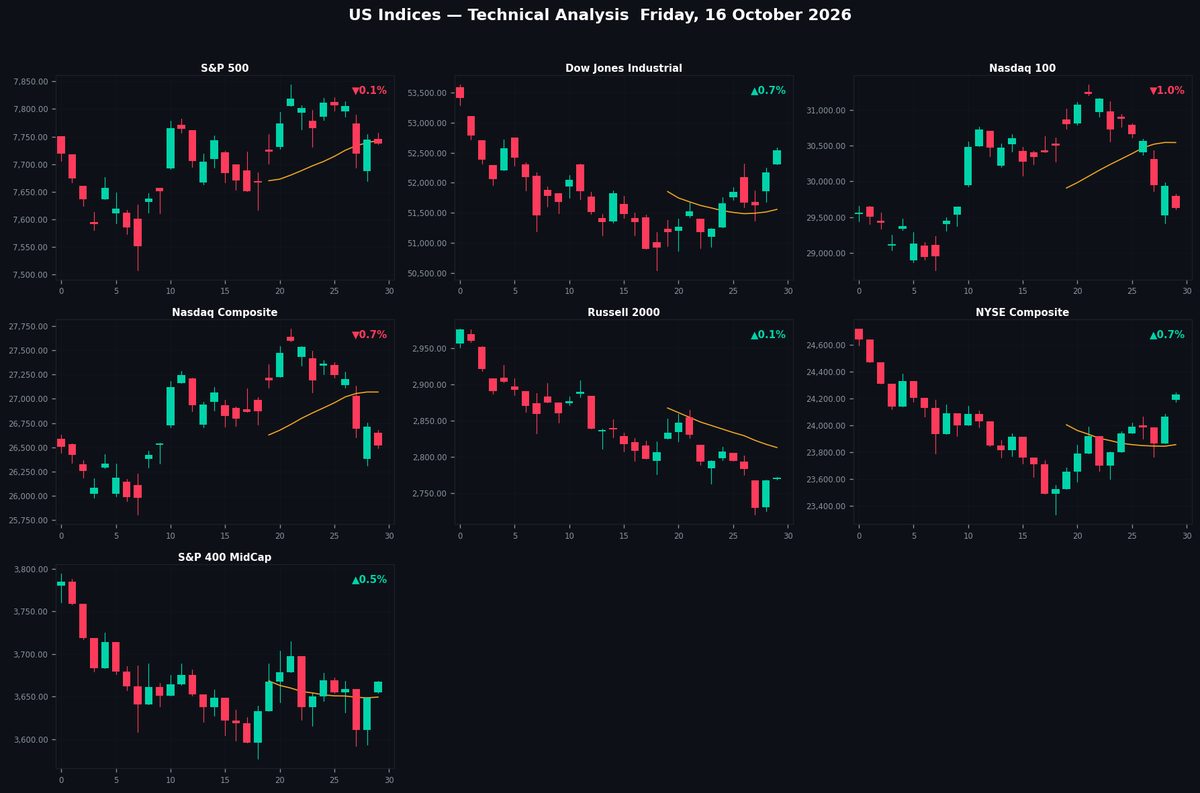
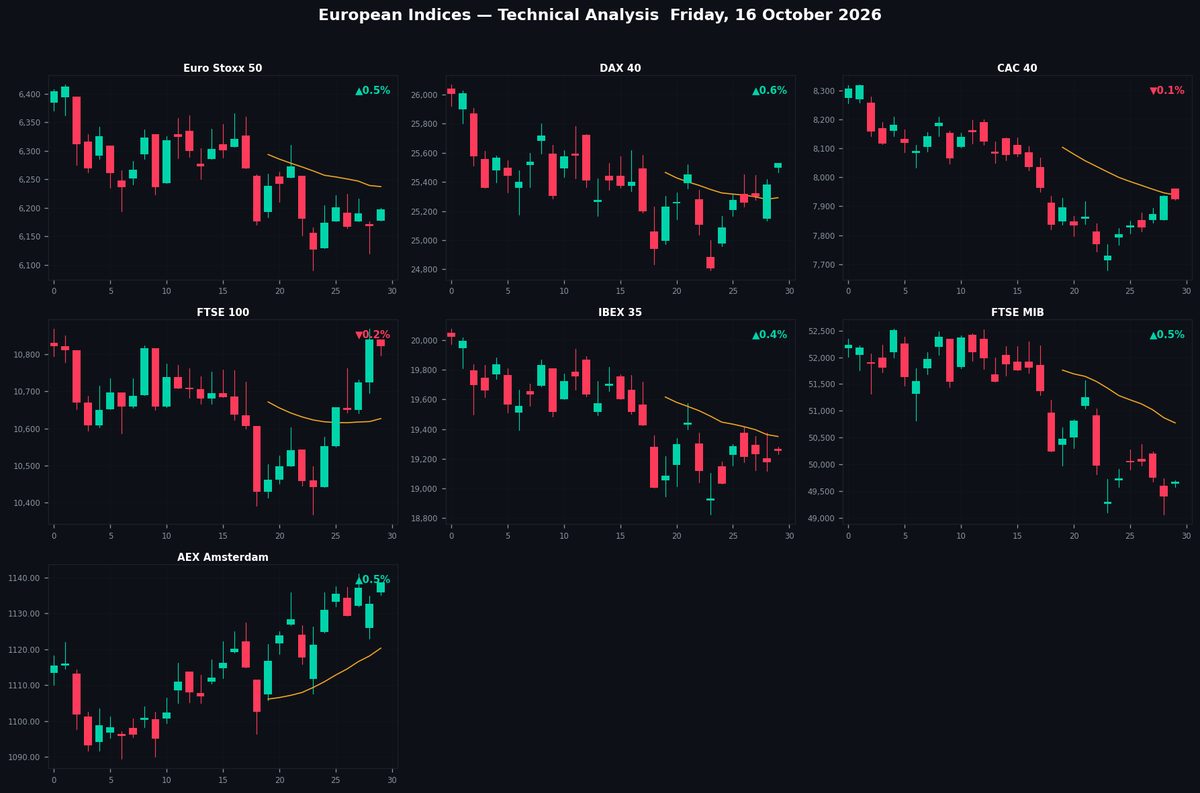
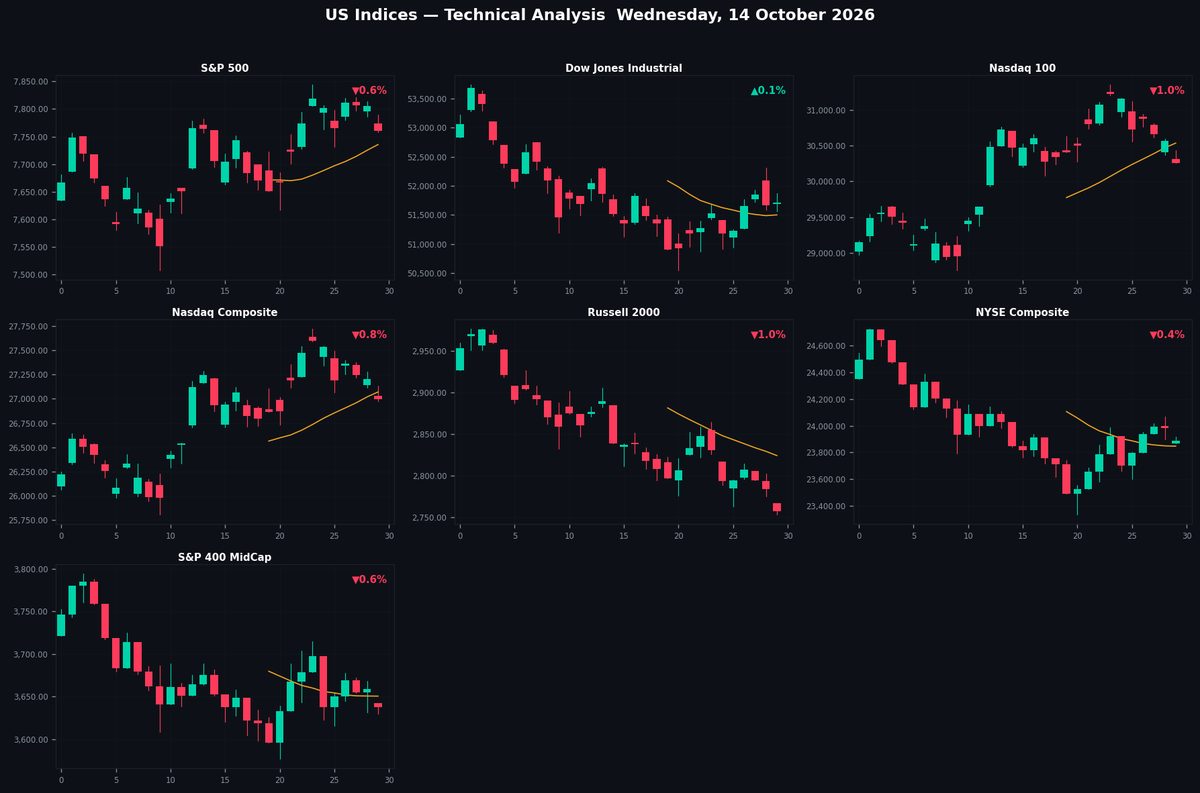
Technical analysis update for 7 major US equity indices on Friday, 16 October 2026.
Charts cover 65 sessions (daily bars) with SMA-20, SMA-50, Bollinger Bands (20,2),
dynamic support/resistance trendlines (20-day and 50-day), and pivot-cluster S/R levels.
Pre-market briefing published ahead of the New York open.
| Code |
Index |
Last |
Chg% |
RSI |
52W H |
52W L |
| SP500 | S&P 500 | 7,737.78 | ▼0.08% | 63.3 | 7,844.52 | 6,316.91 |
| DOW | Dow Jones Industrial | 52,546.06 | ▲0.71% | 51.7 | 54,744.33 | 45,057.28 |
| NDX | Nasdaq 100 | 29,626.81 | ▼1.03% | 38.6 | 31,361.37 | 22,841.42 |
| NASDAQ | Nasdaq Composite | 26,520.49 | ▼0.72% | 43.5 | 27,722.75 | 20,690.25 |
| RUSSELL | Russell 2000 | 2,770.01 | ▲0.10% | 40.7 | 3,069.71 | 2,303.46 |
| NYSE | NYSE Composite | 24,232.29 | ▲0.69% | 49.7 | 24,866.75 | 20,906.44 |
| SP400 | S&P 400 MidCap | 3,667.93 | ▲0.54% | 42.1 | 3,928.98 | 3,107.41 |
SP500
S&P 500
7,737.78
▼0.08%
RSI 63

Double Top — Bearish 50%Double Bottom — Bullish 50%Triangle — Neutral 55%
20d: Sup ascending 7,675.05 (-0.8%) Res ascending 7,892.41 (+2.0%)
50d: Sup descending 7,472.21 (-3.4%) Res flat 7,850.47 (+1.5%)
S/R Levels
| R1 | 7,801.71 | +0.8% | ★★★★★ |
|
7,737.78
52W 6,316.91–7,844.52
|
| S1 | 7,294.91 | -5.7% | ★★★★★ |
| S2 | 6,753.48 | -12.7% | ★★★★☆ |
| S3 | 6,528.86 | -15.6% | ★★★☆☆ |
Moving Averages
| SMA 20 | 7,743.16 | below -0.1% |
| SMA 50 | 7,707.98 | above +0.4% |
| SMA 200 | 7,271.83 | above +6.4% |
Price between SMA20 and SMA50 — mixed signal
Price above SMA200 (+6.4%) — long-term uptrend
Analysis
The S&P 500 trades at 7,737.78, down 0.08%, showing mild bearish pressure near the SMA20 (7,743.16), which now acts as immediate resistance. The RSI-14 at 63 suggests slightly overbought conditions but remains below the 70 threshold. Three unconfirmed double-top patterns (50–59% confidence) hint at potential bearish reversal risks, though price remains above key SMAs (SMA50: 7,707.98; SMA200: 7,271.83), maintaining a broader uptrend. Resistance at R1 (7,801.71) caps upside, while supports at S1 (7,294.91) and S2 (6,753.48) provide downside buffers. Short-term trendlines show ascending support (20d: 7,675.05) and resistance (20d: 7,892.41), suggesting consolidation within this range. A break below SMA20 could signal near-term weakness.
DOW
Dow Jones Industrial
52,546.06
▲0.71%
RSI 52

Double Top — Bearish 95%Double Bottom — Bullish 72%
20d: Sup ascending 51,043.25 (-2.9%) Res ascending 52,581.84 (+0.1%)
50d: Sup descending 49,913.93 (-5.0%) Res descending 52,582.32 (+0.1%)
S/R Levels
| R2 | 54,744.33 | +4.2% | ★★★★☆ |
| R1 | 53,344.60 | +1.5% | ★★★★★ |
|
52,546.06
52W 45,057.28–54,744.33
|
| S1 | 51,144.26 | -2.7% | ★★★★★ |
| S2 | 48,127.01 | -8.4% | ★★★★☆ |
| S3 | 45,274.29 | -13.8% | ★★★☆☆ |
Moving Averages
| SMA 20 | 51,558.26 | above +1.9% |
| SMA 50 | 52,471.18 | above +0.1% |
| SMA 200 | 50,442.43 | above +4.2% |
Price above SMA20 & SMA50 — bullish structure
Price above SMA200 (+4.2%) — long-term uptrend
Analysis
The Dow Jones Industrial Average trades at 52,546.06, up 0.71%, with the RSI-14 at 52 indicating neutral momentum. The price remains above the SMA20 (51,558.26) but below the SMA50 (52,471.18), suggesting near-term consolidation. Multiple bearish Double Top patterns with high confidence levels (50-95%) signal potential downside risk. Immediate resistance lies at R1 (53,344.60), while support is at S1 (51,144.26). Short-term trendlines show ascending support near 51,043.25 and resistance at 52,581.84, reinforcing a tightening range. The convergence of descending 50-day resistance (52,582.32) and current price action highlights a critical juncture. A break below SMA20 could accelerate a test of S1, while surpassing SMA50 may target R1. Caution is warranted given the bearish patterns.
NDX
Nasdaq 100
29,626.81
▼1.03%
RSI 39

Double Top — Bearish 50%Double Bottom — Bullish 58%
20d: Sup descending 29,379.51 (-0.8%) Res ascending 31,504.62 (+6.3%)
50d: Sup ascending 29,044.36 (-2.0%) Res ascending 31,625.58 (+6.7%)
S/R Levels
| R3 | 31,361.37 | +5.9% | ★★★☆☆ |
| R2 | 30,626.05 | +3.4% | ★★★★☆ |
| R1 | 29,847.83 | +0.7% | ★★★★★ |
|
29,626.81
52W 22,841.42–31,361.37
|
| S1 | 28,660.40 | -3.3% | ★★★★★ |
| S2 | 24,234.50 | -18.2% | ★★★★☆ |
| S3 | 22,863.22 | -22.8% | ★★★☆☆ |
Moving Averages
| SMA 20 | 30,546.18 | below -3.0% |
| SMA 50 | 29,876.78 | below -0.8% |
| SMA 200 | 27,740.18 | above +6.8% |
Price below SMA20 & SMA50 — bearish structure
Price above SMA200 (+6.8%) — long-term uptrend
Analysis
The Nasdaq 100 trades at 29,626.81, down 1.03%, with the RSI-14 at 39 indicating nearing oversold conditions. Price remains below key SMAs (20d: 30,546.18; 50d: 29,876.78), reinforcing bearish near-term momentum, though the 200d SMA at 27,740.18 provides longer-term support. Immediate resistance lies at R1 (29,847.83), with stronger barriers at R2 (30,626.05) and R3 (31,361.37). Support levels are noted at S1 (28,660.40), S2 (24,234.50), and S3 (22,863.22). Three double top patterns (50-84% confidence) suggest potential downside continuation. Trendlines show descending 20-day support at 29,379.51 and ascending 50-day support at 29,044.36, while resistance converges near 31,500-31,625. The index remains in a corrective
NASDAQ
Nasdaq Composite
26,520.49
▼0.72%
RSI 43

Double Top — Bearish 72%Double Bottom — Bullish 50%
20d: Sup descending 26,286.87 (-0.9%) Res ascending 27,893.43 (+5.2%)
50d: Sup ascending 25,975.77 (-2.1%) Res ascending 27,909.46 (+5.2%)
S/R Levels
| R3 | 27,722.75 | +4.5% | ★★★☆☆ |
| R2 | 27,239.50 | +2.7% | ★★★★☆ |
| R1 | 26,762.19 | +0.9% | ★★★★★ |
|
26,520.49
52W 20,690.25–27,722.75
|
| S1 | 25,787.44 | -2.8% | ★★★★★ |
| S2 | 22,100.72 | -16.7% | ★★★★☆ |
| S3 | 20,718.80 | -21.9% | ★★★☆☆ |
Moving Averages
| SMA 20 | 27,070.20 | below -2.0% |
| SMA 50 | 26,638.82 | below -0.4% |
| SMA 200 | 24,921.30 | above +6.4% |
Price below SMA20 & SMA50 — bearish structure
Price above SMA200 (+6.4%) — long-term uptrend
Analysis
The Nasdaq Composite declines 0.72% to 26,520.49, remaining below key moving averages (SMA20 at 27,070.20, SMA50 at 26,638.82) but holding above the rising SMA200 (24,921.30). The RSI-14 at 43 suggests neutral momentum with slight bearish bias. Multiple confirmed Double Top patterns (50-84% confidence) indicate potential downside risk, though immediate support rests at 25,787.44 (S1). Resistance levels cluster between 26,762.19 (R1) and 27,722.75 (R3), with descending 20-day trendline resistance at 27,893.43 reinforcing overhead pressure. The index remains in a short-term downtrend while maintaining a broader uptrend above the ascending 50-day support at 25,975.77. Price action suggests consolidation near current levels pending clearer directional conviction.
RUSSELL
Russell 2000
2,770.01
▲0.10%
RSI 41

Double Top — Bearish 50%Double Bottom — Bullish 58%
20d: Sup descending 2,707.89 (-2.2%) Res descending 2,832.43 (+2.3%)
50d: Sup descending 2,695.74 (-2.7%) Res descending 2,819.56 (+1.8%)
S/R Levels
| R3 | 3,055.05 | +10.3% | ★★★☆☆ |
| R2 | 2,954.41 | +6.7% | ★★★★☆ |
| R1 | 2,886.44 | +4.2% | ★★★★★ |
|
2,770.01
52W 2,303.46–3,069.71
|
| S1 | 2,591.57 | -6.4% | ★★★★★ |
| S2 | 2,477.35 | -10.6% | ★★★★☆ |
| S3 | 2,408.43 | -13.1% | ★★★☆☆ |
Moving Averages
| SMA 20 | 2,812.78 | below -1.5% |
| SMA 50 | 2,908.48 | below -4.8% |
| SMA 200 | 2,794.88 | below -0.9% |
Price below SMA20 & SMA50 — bearish structure
Price below SMA200 (-0.9%) — long-term downtrend
Analysis
The Russell 2000 trades at 2,770.01, up 0.10%, with the RSI-14 at 41 indicating neutral momentum. The index remains below key SMAs (20d: 2,812.78; 50d: 2,908.48; 200d: 2,794.88), signaling bearish pressure. Resistance levels are noted at 2,886.44 (R1), 2,954.41 (R2), and 3,055.05 (R3), while support lies at 2,591.57 (S1), 2,477.35 (S2), and 2,408.43 (S3). Multiple Double Top patterns (50-57% confidence) suggest potential downside. Trendlines show descending support at 2,707.89 (20d) and 2,695.74 (50d), with resistance at 2,832.43 (20d) and 2,819.56 (50d). The technical setup leans bear
NYSE
NYSE Composite
24,232.29
▲0.69%
RSI 50

Double Top — Bearish 59%Double Bottom — Bullish 76%Flag — Bullish 70%
20d: Sup ascending 23,578.98 (-2.7%) Res ascending 24,243.58 (+0.0%)
50d: Sup descending 23,010.41 (-5.0%) Res descending 24,243.76 (+0.0%)
S/R Levels
| R1 | 24,843.02 | +2.5% | ★★★★★ |
|
24,232.29
52W 20,906.44–24,866.75
|
| S1 | 23,206.97 | -4.2% | ★★★★★ |
| S2 | 22,607.23 | -6.7% | ★★★★☆ |
| S3 | 21,023.39 | -13.2% | ★★★☆☆ |
Moving Averages
| SMA 20 | 23,856.05 | above +1.6% |
| SMA 50 | 24,250.82 | below -0.1% |
| SMA 200 | 23,388.64 | above +3.6% |
Price between SMA20 and SMA50 — mixed signal
Price above SMA200 (+3.6%) — long-term uptrend
Analysis
The NYSE Composite trades at 24,232.29, up 0.69%, with the RSI-14 neutral at 50, indicating balanced momentum. Price remains above the rising SMA20 (23,856.05) but below the descending SMA50 (24,250.82), suggesting near-term resilience amid broader consolidation. Immediate resistance is at 24,243.58 (20-day trendline), with R1 at 24,843.02, while support lies at 23,206.97 (S1). Three bearish Double Top patterns (59%, 50%, 50% confidence) hint at potential downside, though the index holds above key moving averages (SMA200 at 23,388.64). A break above 24,243.76 (50-day resistance) could negate bearish signals, while a drop below 23,578.98 (20-day support) may accelerate selling pressure. The trend remains mixed, awaiting decisive price action.
SP400
S&P 400 MidCap
3,667.93
▲0.54%
RSI 42

Double Top — Bearish 76%Double Bottom — Bullish 50%Triangle — Neutral 55%Flag — Bullish 55%
20d: Sup ascending 3,595.27 (-2.0%) Res ascending 3,732.57 (+1.8%)
50d: Sup descending 3,456.68 (-5.8%) Res descending 3,668.44 (+0.0%)
S/R Levels
| R3 | 3,928.98 | +7.1% | ★★★☆☆ |
| R2 | 3,829.75 | +4.4% | ★★★★☆ |
| R1 | 3,736.19 | +1.9% | ★★★★★ |
|
3,667.93
52W 3,107.41–3,928.98
|
| S1 | 3,546.01 | -3.3% | ★★★★★ |
| S2 | 3,288.34 | -10.3% | ★★★★☆ |
| S3 | 3,093.00 | -15.7% | ★★★☆☆ |
Moving Averages
| SMA 20 | 3,649.50 | above +0.5% |
| SMA 50 | 3,732.35 | below -1.7% |
| SMA 200 | 3,637.46 | above +0.8% |
Price between SMA20 and SMA50 — mixed signal
Price above SMA200 (+0.8%) — long-term uptrend
Analysis
The S&P 400 MidCap index trades at 3,667.93 (+0.54%), testing near-term resistance at the 20-day SMA (3,649.50) while remaining below the 50-day SMA (3,732.35). The RSI-14 at 42 suggests mild bearish momentum, though not oversold. Multiple Double Top patterns (65-95% confidence) indicate potential downside pressure, with key resistance levels at 3,736.19 (R1) and 3,829.75 (R2). Support is seen at 3,546.01 (S1), with stronger levels at 3,288.34 (S2). The 20-day trendline support rises to 3,595.27, while the 50-day descending resistance at 3,668.44 aligns with current price action. A break below the 200-day SMA (3,637.46) could signal further weakness. The mixed signals warrant caution amid bearish patterns. (105 words)
Disclaimer
The content on MarketsFN.com is provided for educational and informational purposes only. It does not constitute financial advice or investment recommendations. All investments involve risks and past performance does not guarantee future results. You are solely responsible for your investment decisions.