Tron and Ripple Lead Crypto Rally with Strong Gains Overnight.
QuoteReporter
•5 min read
Crypto Market Report | October 14, 2026
📊 Crypto Market Overview
The cryptocurrency market is currently displaying a cautiously optimistic sentiment, with most major assets trading in positive territory. Bitcoin, the largest cryptocurrency by market capitalization, is trading at $83,748.38, having risen by 0.79% over the past 24 hours. The Relative Strength Index (RSI) for Bitcoin stands at 50.7, indicating a neutral stance, while the Moving Average Convergence Divergence (MACD) is at 615.3, suggesting a bullish trend.
Other key cryptocurrencies are also showing modest gains, with Ethereum, Ripple, Solana, and Tron all posting increases between 0.67% and 1.50%. Notably, Ethereum, Ripple, and Solana are currently in oversold territory, as indicated by their RSI values of 35.7, 33.0, and 30.1, respectively. Their MACD indicators are negative, suggesting a potential for a short-term reversal.
The macroeconomic context remains influential, with recent statements from Federal Reserve officials, such as Fed's Williams, indicating no anticipated rate hikes in 2027. This has contributed to a positive market atmosphere, with Bitcoin climbing toward the $84,000 mark. The integration of Stripe-owned wallets into the XRP Ledger by Ripple and the introduction of a wallet privacy feature for DeFi activity by Starknet are among the notable developments in the crypto space. Standard Chartered has also begun offering direct bitcoin and ether trading to affluent clients in the UAE. Overall, the market is responding positively to these developments, with a mix of technical signals and macroeconomic factors driving the current sentiment.
Other key cryptocurrencies are also showing modest gains, with Ethereum, Ripple, Solana, and Tron all posting increases between 0.67% and 1.50%. Notably, Ethereum, Ripple, and Solana are currently in oversold territory, as indicated by their RSI values of 35.7, 33.0, and 30.1, respectively. Their MACD indicators are negative, suggesting a potential for a short-term reversal.
The macroeconomic context remains influential, with recent statements from Federal Reserve officials, such as Fed's Williams, indicating no anticipated rate hikes in 2027. This has contributed to a positive market atmosphere, with Bitcoin climbing toward the $84,000 mark. The integration of Stripe-owned wallets into the XRP Ledger by Ripple and the introduction of a wallet privacy feature for DeFi activity by Starknet are among the notable developments in the crypto space. Standard Chartered has also begun offering direct bitcoin and ether trading to affluent clients in the UAE. Overall, the market is responding positively to these developments, with a mix of technical signals and macroeconomic factors driving the current sentiment.
📰 Crypto News
- Here’s what happened in crypto today
- Starknet introduces wallet privacy feature for DeFi activity
- Fed’s Williams sees AI supply squeeze lasting beyond 2 years
- Bitwise’s Hougan says Q3 charts point to ‘crypto spring’
- Ledger asks resellers to halt sales in Southeast Asia and Hong Kong
- Standard Chartered unlocks direct bitcoin and ether trading for affluent UAE clients
- Coinbase, which holds 5% of all bitcoin, wants the quantum fix started now
- Ripple adds Stripe-owned wallets to XRP Ledger as AI payments pass 14 million
- Solana sets Oct. 21 for Alpenglow upgrade targeting 150-millisecond finality
- Bitcoin climbs toward $84,000 after Fed’s Williams sees no rate hikes in 2027
- Largest Philippines crypto exchange, Coins.ph, said to face central bank regulatory action
- Strive raising $500 million to buy additional bitcoin with new preferred share class
- BNY, Citadel Securities test tokenized U.S. Treasuries to speed up Wall Street financing
- OpenAI Engineer Arrested for Bugging Office, Company Says AI Caught Him
- Character.AI Files for Bankruptcy as Disney Bids $20 Million—And Users Get Grief Resources
🔍 Technical Analysis
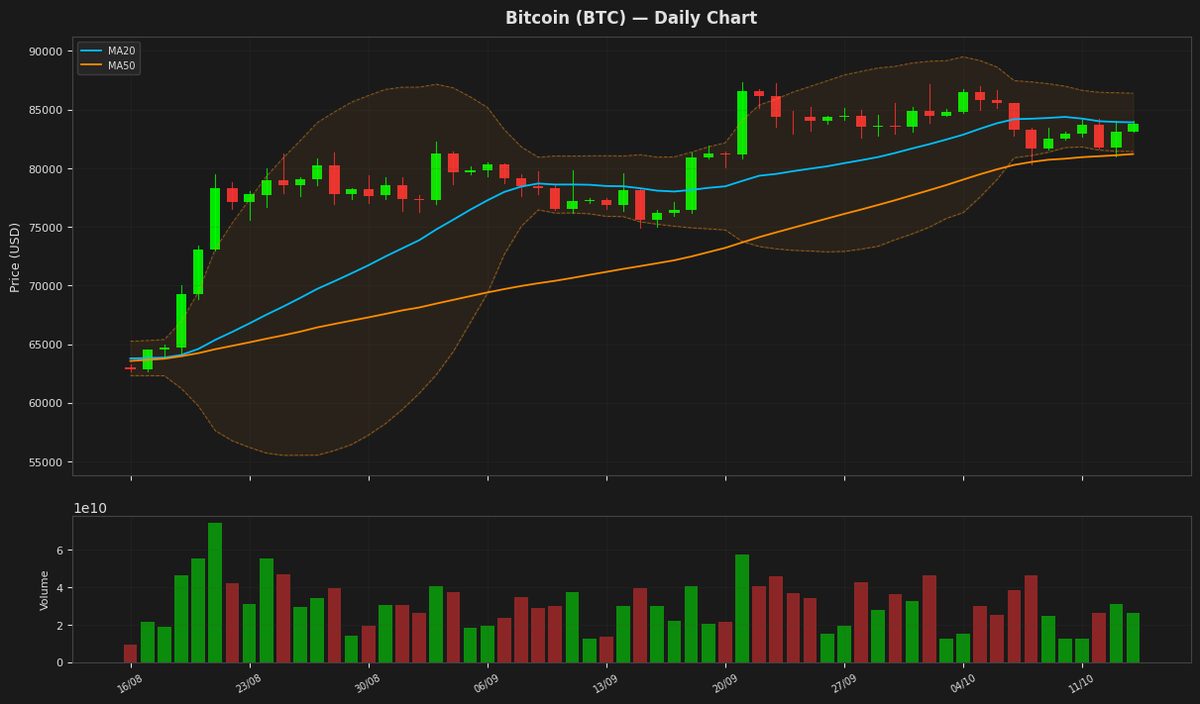
Bitcoin (BTC) — +0.79%
$83,748.38 52W: $57,747.77 — $87,363.76
Bitcoin is currently trading at $83,748, slightly above its 20-day moving average of $83,911, indicating a relatively stable trend. The RSI reading of 50.68 suggests a neutral market sentiment, while the MACD line being below its signal line indicates a potential bearish signal. The price is also within the Bollinger Bands, with the upper and lower bands at $86,396 and $81,425 respectively, suggesting that the current volatility is within normal ranges. The ATR of $1,999 indicates moderate daily price fluctuations.
Ethereum (ETH) — +0.67%
$2,513.47 52W: $1,506.51 — $2,805.50
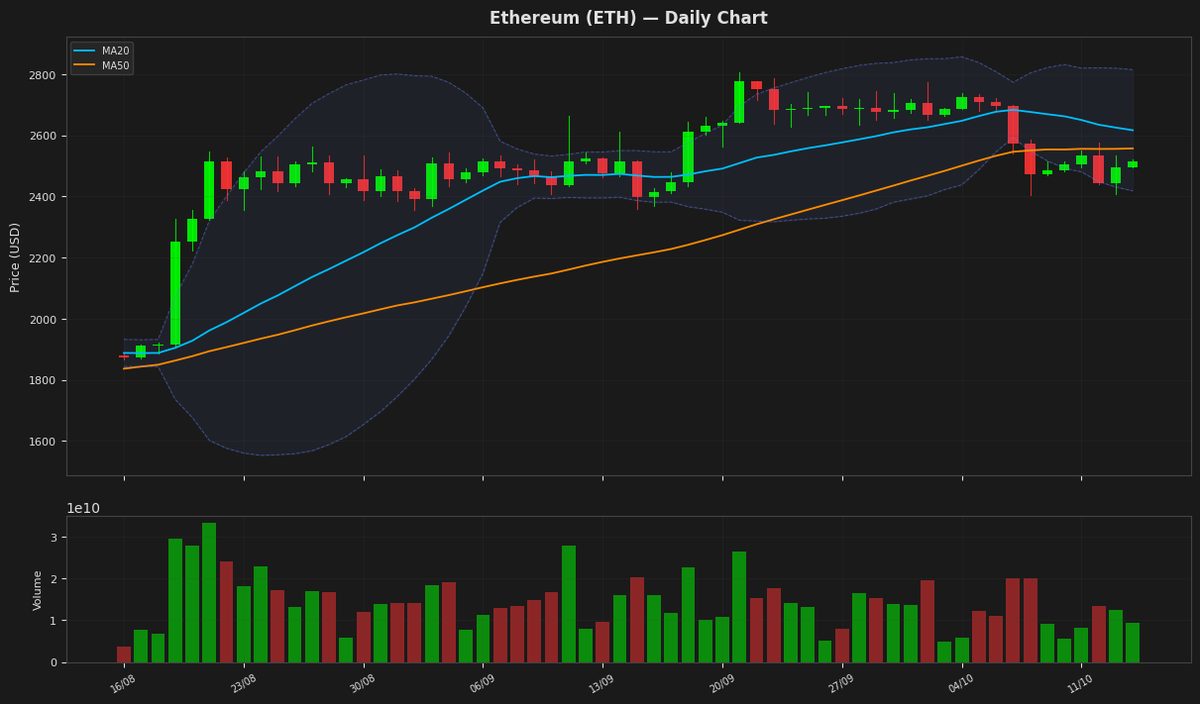
Ethereum's price is currently at $2,513.47, showing a slight increase of 0.67% for the day, and is positioned below both its 20-day and 50-day moving averages, indicating a potential bearish trend. The RSI is at 35.68, suggesting the asset is nearing oversold territory. The MACD is negative and below its signal line, further indicating bearish momentum. The price is also within the lower half of the Bollinger Bands, with the upper band at $2,815.53 and the lower band at $2,418.66.
Ripple (XRP) — +0.91%
$1.3770 52W: $0.988422 — $1.6838
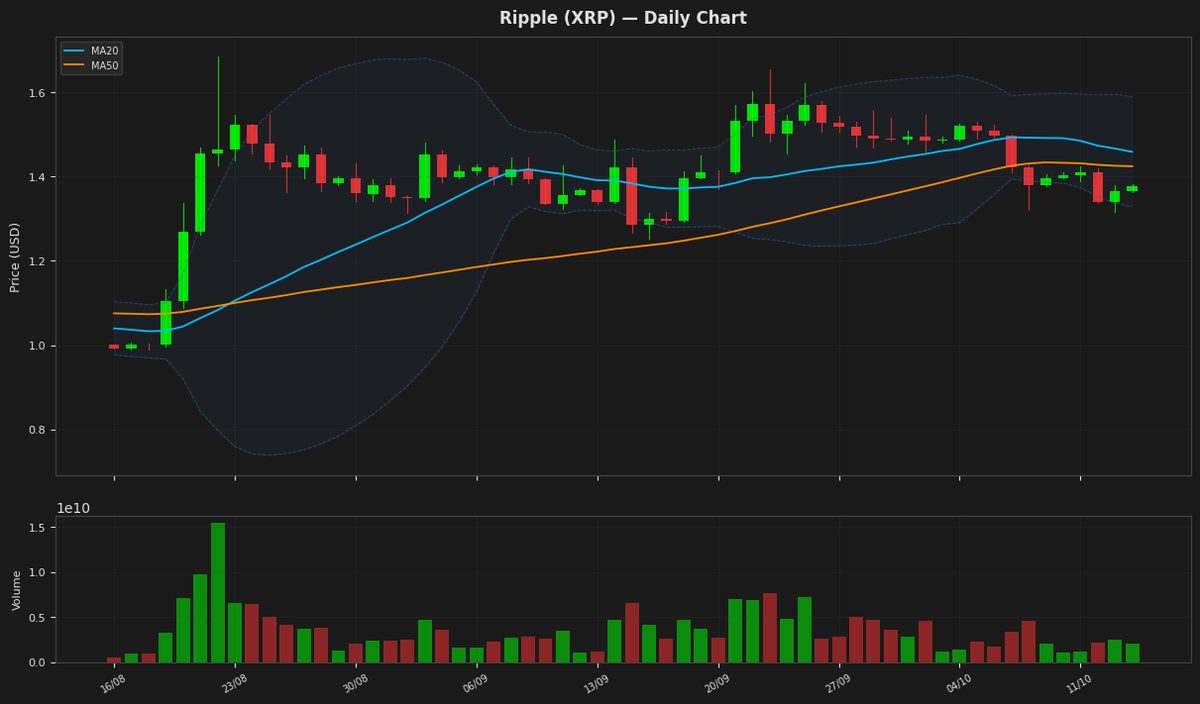
Ripple's price is currently at $1.377, showing a slight recovery as it is trading above the lower Bollinger Band at $1.327605, indicating potential support. The RSI at 33.043392 suggests that the asset is nearing oversold territory, which could lead to a bounce. The MACD is below the signal line, indicating a bearish signal, but the negative divergence is not strong. The price is still below both MA20 and MA50, indicating a downtrend.
Solana (SOL) — +0.91%
$107.7000 52W: $60.4147 — $124.6174
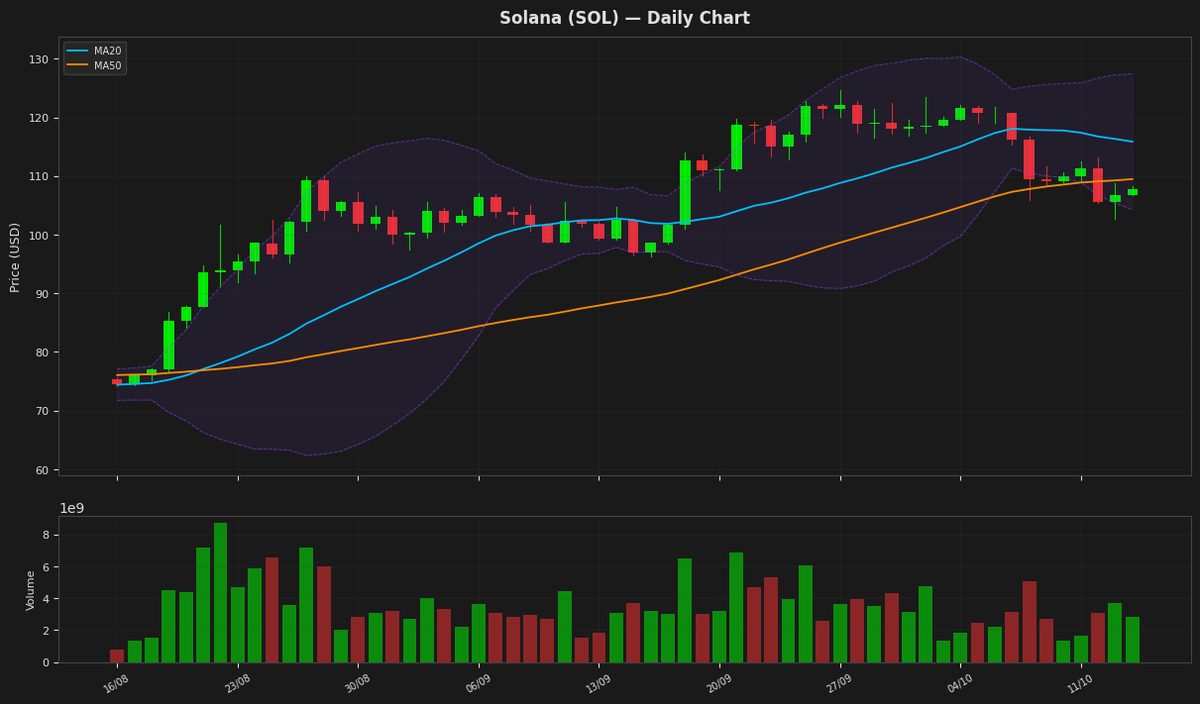
Solana's price is currently at $107.70, showing a minor daily increase of 0.91%. The RSI(14) value of 30.14 indicates that the asset is approaching oversold territory, while the MACD is below its signal line, suggesting a bearish trend. The price is near the lower Bollinger Band at $104.27, indicating potential support.
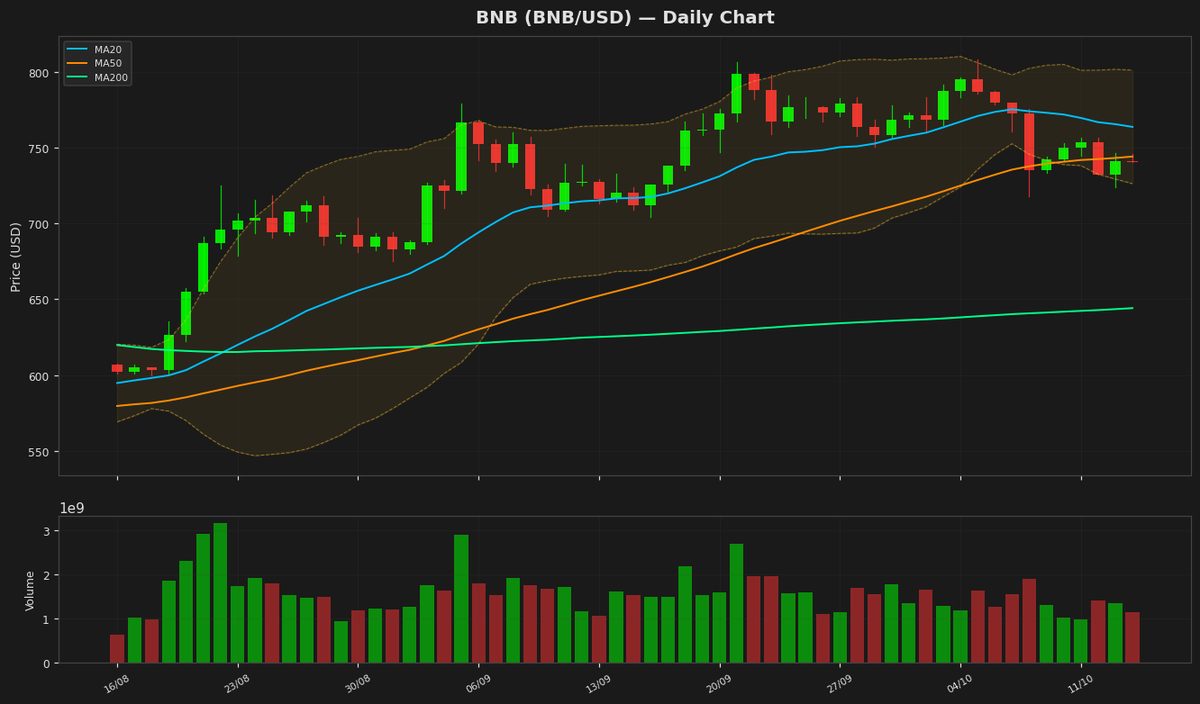
BNB (BNB) — +0.32%
$743.4400 52W: $538.5992 — $808.4329
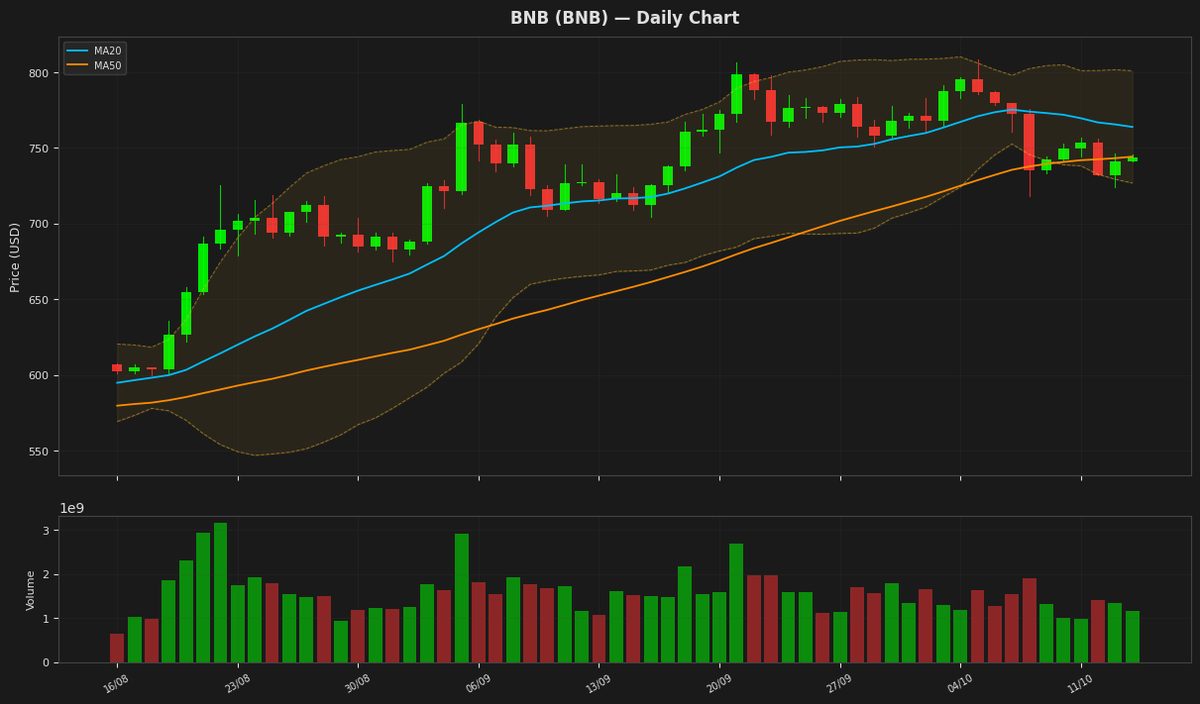
BNB is currently trading at 743.44, showing a slight daily increase of 0.32% while remaining below its MA20 and MA50 levels. The RSI of 41.43 and a negative MACD indicate bearish momentum, though the price remains within the Bollinger Band range of 726.75 to 800.93. With the current price sitting just below the MA50 support, the asset faces immediate resistance near 763.84.
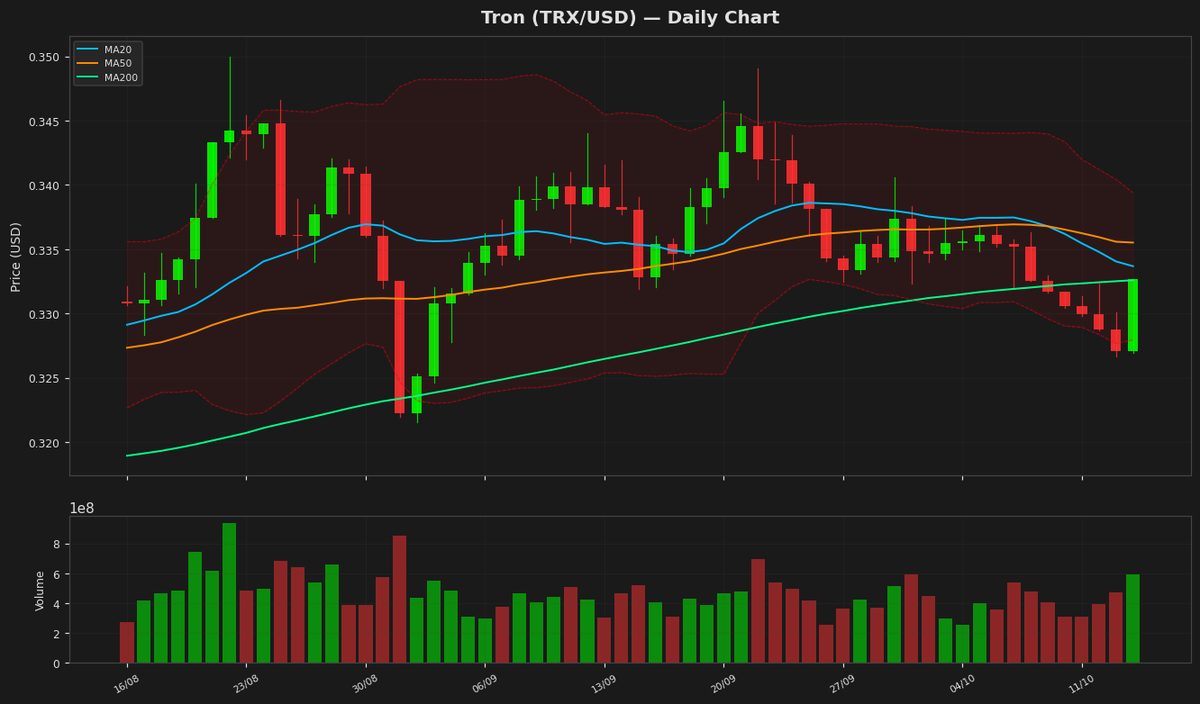
Tron (TRX) — +1.50%
$0.332018 52W: $0.268138 — $0.376332
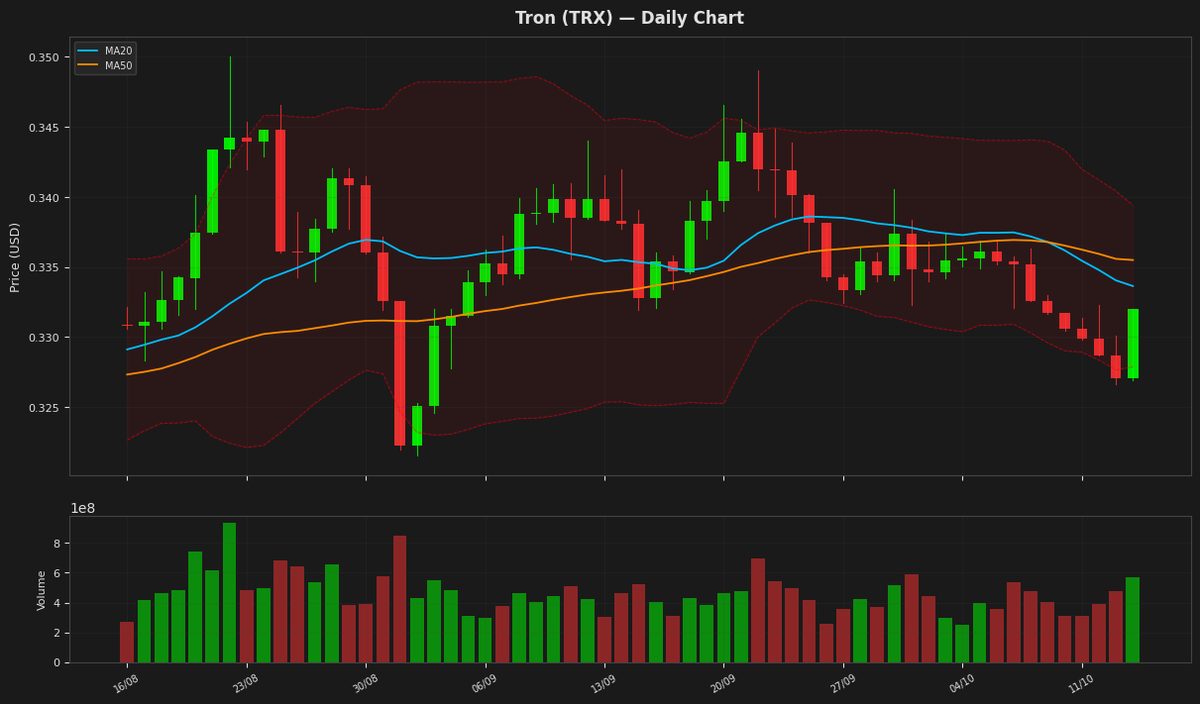
Tron's price is currently at $0.332018, showing a slight increase of 1.50% daily, but remains below both the MA20 and MA50, indicating a bearish trend. The RSI is at 35.17, suggesting the asset is nearing oversold territory. The MACD is below the signal line, reinforcing the bearish sentiment. The price is also near the lower Bollinger Band at $0.327889.
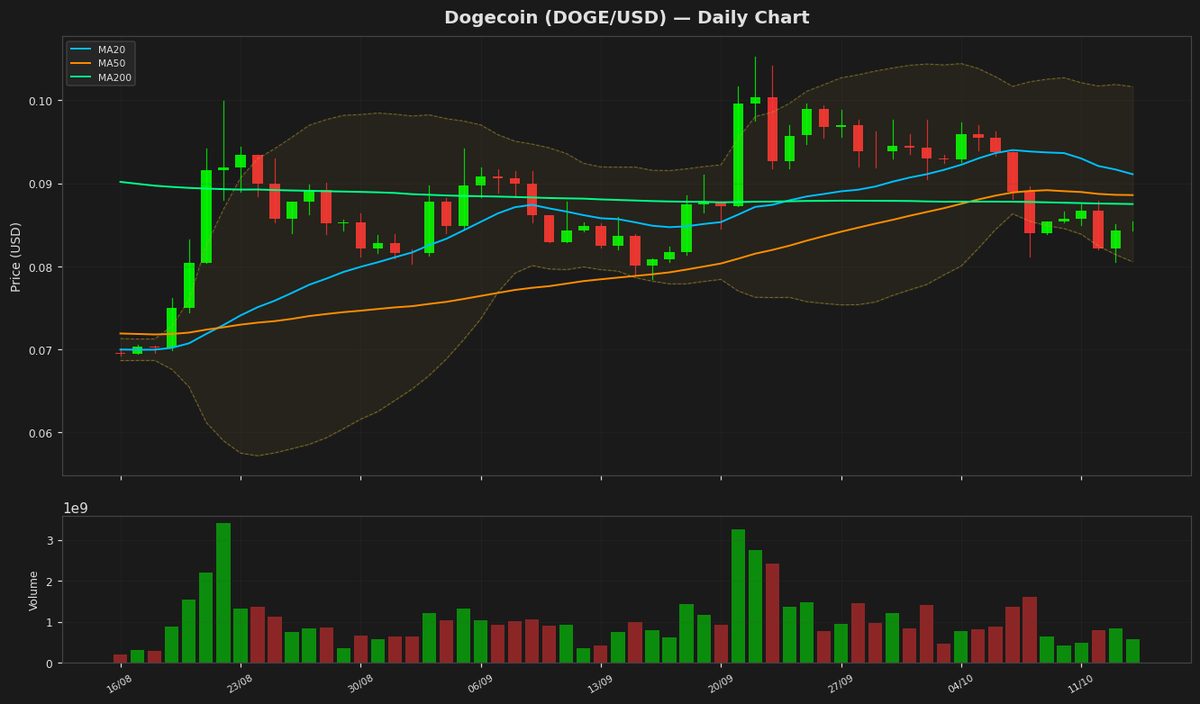
Dogecoin (DOGE) — +0.78%
$0.084930 52W: $0.067973 — $0.118255
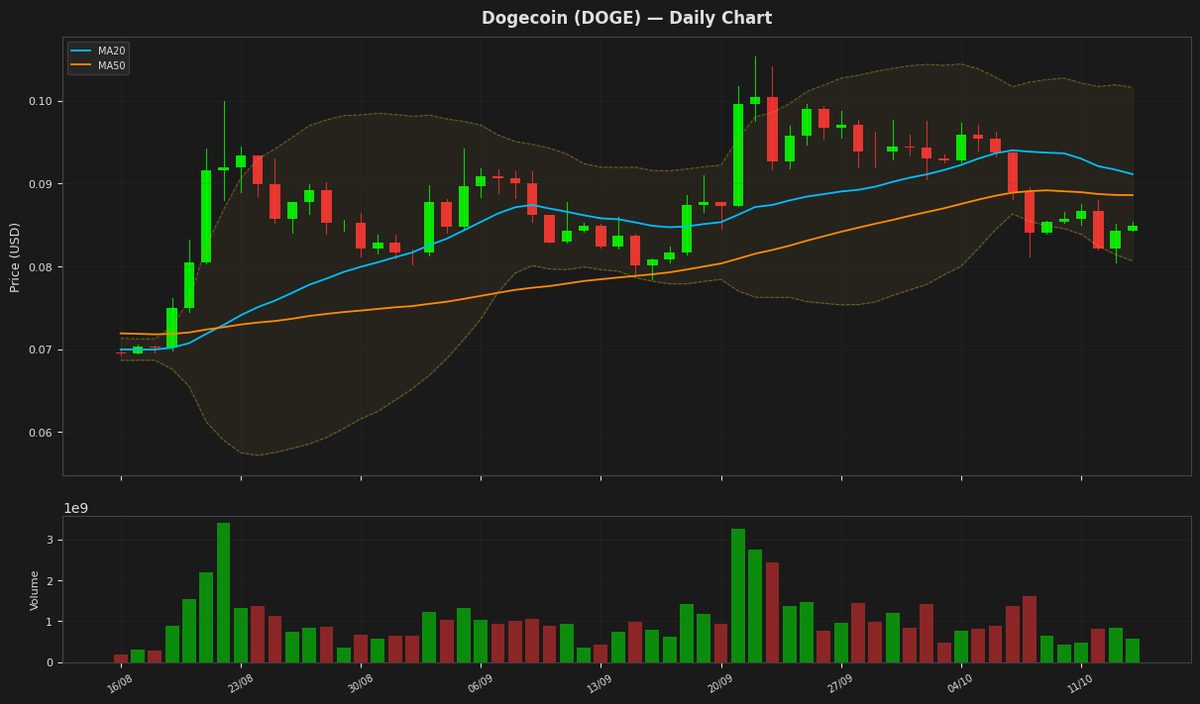
Dogecoin's price is currently at $0.084930, showing a minor daily gain, but still below both its 20-day and 50-day moving averages, indicating a downtrend. The RSI is at 32.019313, suggesting the cryptocurrency is approaching oversold territory. The MACD is negative and below its signal line, reinforcing the bearish sentiment. The price is near the lower Bollinger Band at 0.08064, indicating potential support.
Disclaimer
The content on MarketsFN.com is provided for educational and informational purposes only. It does not constitute financial advice or investment recommendations. All investments involve risk. Past performance does not guarantee future results.