Solana Technical Analysis: $84.86 Price Rises with RSI at 43.6
QuoteReporter
•3 min read
Solana Technical Analysis: $84.86 Price Rises with RSI at 43.6
Solana (SOL/USD) | May 05, 2026 $84.8600 +0.92%
🔍 Technical Analysis
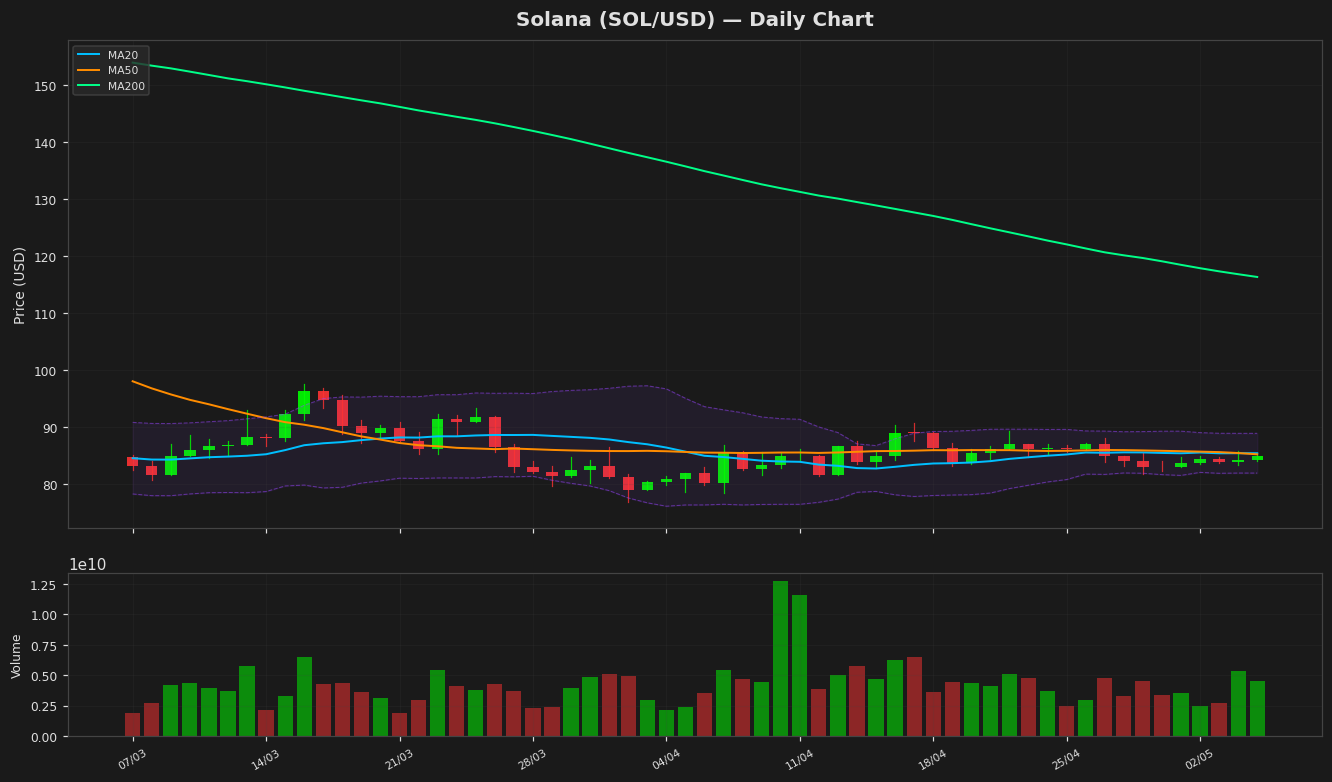
Solana (SOL) is currently trading at $84.86, reflecting a modest daily increase of 0.92%. Analyzing the price action, SOL remains in a consolidation phase near its short-term moving averages, with the 20-day MA at $85.36 and the 50-day MA at $85.16, both acting as immediate resistance and support respectively. However, the price is significantly below the 200-day MA of $116.29, indicating a longer-term bearish trend despite recent stabilization.
Using Bollinger Bands, the upper band sits at $88.84, suggesting potential resistance if bullish momentum builds, while the lower band at $81.87 provides a near-term support level. The RSI(14) at 43.64 reflects a neutral to slightly oversold condition, hinting at room for upward movement without immediate overbought concerns. The MACD, currently at -0.29 with a signal line of -0.19, shows a bearish crossover, though the narrowing histogram suggests weakening downward momentum.
Key support levels to monitor are at $81.87 (BB lower) and the year-to-date low of $68.69, which could act as a critical floor. Resistance is evident at $85.36 (MA20) and $88.84 (BB upper), with a break above potentially targeting $116.29 (MA200). The ATR(14) of 2.07 indicates moderate volatility, supporting a cautious approach. Overall, SOL’s technicals suggest a neutral outlook with a slight bullish bias if support holds.
Using Bollinger Bands, the upper band sits at $88.84, suggesting potential resistance if bullish momentum builds, while the lower band at $81.87 provides a near-term support level. The RSI(14) at 43.64 reflects a neutral to slightly oversold condition, hinting at room for upward movement without immediate overbought concerns. The MACD, currently at -0.29 with a signal line of -0.19, shows a bearish crossover, though the narrowing histogram suggests weakening downward momentum.
Key support levels to monitor are at $81.87 (BB lower) and the year-to-date low of $68.69, which could act as a critical floor. Resistance is evident at $85.36 (MA20) and $88.84 (BB upper), with a break above potentially targeting $116.29 (MA200). The ATR(14) of 2.07 indicates moderate volatility, supporting a cautious approach. Overall, SOL’s technicals suggest a neutral outlook with a slight bullish bias if support holds.
Technical Metrics
| Metric | Value |
|---|---|
| Current Price | $84.8600 |
| Daily Change | +0.92% |
| MA 20 | $85.3591 |
| % from MA20 | -0.58% |
| MA 50 | $85.1649 |
| % from MA50 | -0.36% |
| MA 200 | $116.2857 |
| % from MA200 | -27.02% |
| BB Upper | $88.8438 |
| % from BB Upper | -4.48% |
| BB Lower | $81.8744 |
| % from BB Lower | +3.65% |
| RSI (14) | 43.64 |
| MACD | -0.291921 |
| MACD Signal | -0.192735 |
| ATR (14) | 2.074672 |
| 3-Day High | $85.8026 |
| 3-Day Low | $83.3656 |
| 52-Week High | $253.2099 |
| % from 52W High | -66.49% |
| 52-Week Low | $68.6918 |
| % from 52W Low | +23.54% |
| YTD High | $148.2160 |
| % from YTD High | -42.75% |
| YTD Low | $68.6918 |
| % from YTD Low | +23.54% |
📊 Market Commentary
Solana (SOL) is currently trading at $84.8600, reflecting a modest gain of 0.92% over the past 24 hours. Market sentiment around SOL appears cautiously neutral, as the asset hovers in the middle of its 52-week range of $68.6918 to $253.2099. The Relative Strength Index (RSI) stands at 43.6, indicating that SOL is neither overbought nor oversold, suggesting a balanced market with no immediate signs of strong momentum in either direction. This RSI level may reflect a consolidation phase, as traders assess the next potential move.
Key price levels are drawing attention from market participants. On the downside, the $68.6918 mark represents a critical support zone, aligning with the lower end of the yearly range. A breach below this could shift sentiment toward bearish territory. On the upside, traders are closely monitoring resistance near the psychological $100 level, which has historically acted as a barrier during recovery attempts. Beyond that, the mid-range of $150 remains a significant long-term level to watch for any signs of renewed bullish interest.
Traders are also keeping an eye on broader market dynamics, including Ethereum layer-1 competition and Solana’s ecosystem developments, which could influence sentiment. Network activity, adoption metrics, and overall crypto market trends are additional factors under scrutiny. For now, SOL’s price action remains contained, with market participants awaiting clearer directional cues from both technical indicators and fundamental catalysts.
Key price levels are drawing attention from market participants. On the downside, the $68.6918 mark represents a critical support zone, aligning with the lower end of the yearly range. A breach below this could shift sentiment toward bearish territory. On the upside, traders are closely monitoring resistance near the psychological $100 level, which has historically acted as a barrier during recovery attempts. Beyond that, the mid-range of $150 remains a significant long-term level to watch for any signs of renewed bullish interest.
Traders are also keeping an eye on broader market dynamics, including Ethereum layer-1 competition and Solana’s ecosystem developments, which could influence sentiment. Network activity, adoption metrics, and overall crypto market trends are additional factors under scrutiny. For now, SOL’s price action remains contained, with market participants awaiting clearer directional cues from both technical indicators and fundamental catalysts.
Disclaimer
The content on MarketsFN.com is provided for educational and informational purposes only. It does not constitute financial advice or investment recommendations. All investments involve risk. Cryptocurrency markets are highly volatile. Past performance does not guarantee future results.