Solana Breaks $121.57 as RSI Hits 65.2, Bulls Charge On
QuoteReporter
•3 min read
Solana Breaks $121.57 as RSI Hits 65.2, Bulls Charge On
Solana (SOL/USD) | October 02, 2026 $121.5700 +2.68%
🔍 Technical Analysis
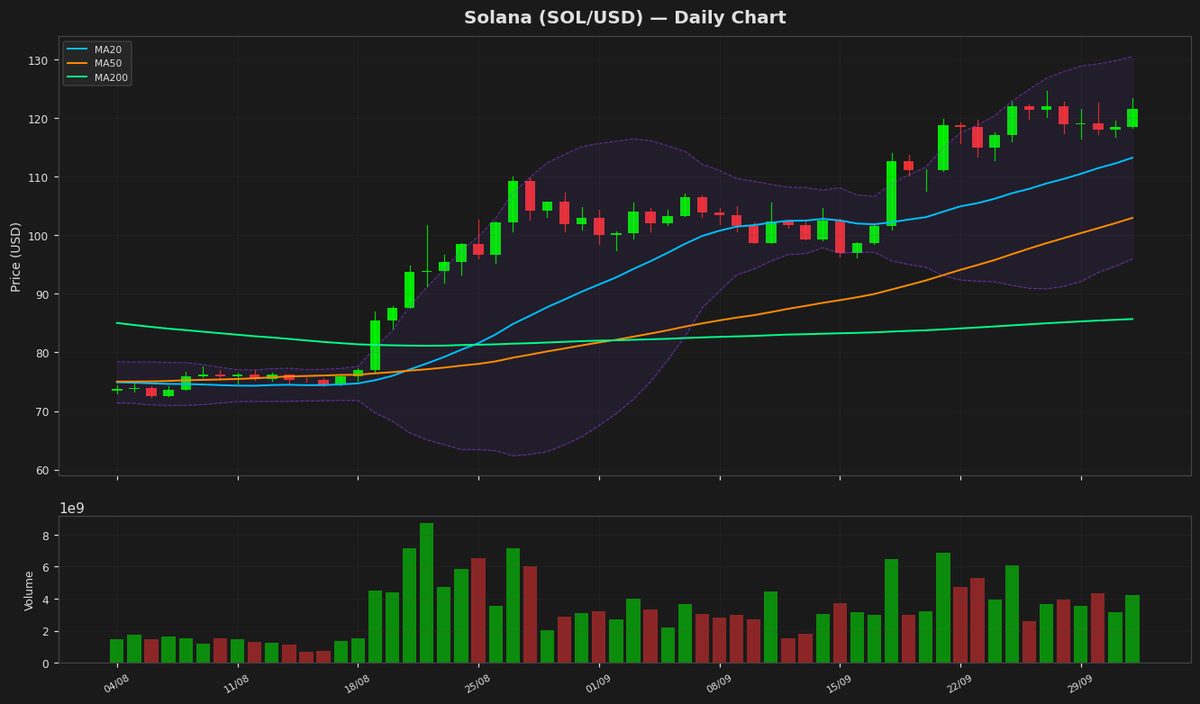
Solana (SOL) is currently trading at $121.57, up 2.68% on the day, showing bullish momentum. The price remains above all key moving averages, with the MA20 at $113.21, MA50 at $102.94, and MA200 at $85.68, indicating a strong uptrend. The Bollinger Bands suggest volatility, with the upper band at $130.49 and the lower band at $95.93, placing the price near the mid-range. A breakout above the upper band could signal further upside, while a drop below the mid-band may indicate a pullback. The RSI at 65.24 is approaching overbought territory but still has room before hitting the 70 threshold, suggesting potential for continued upward movement. The MACD at 5.43 is slightly below the signal line at 5.58, indicating a possible short-term bearish crossover, though divergence remains minimal. Key resistance levels to watch are the 52-week high at $127.97 and the YTD high at $148.22, while support lies near the MA20 at $113.21 and the lower Bollinger Band at $95.93. The ATR at 4.85 reflects moderate volatility, typical for SOL’s recent price action. Overall, Solana’s trend remains bullish, but traders should monitor the MACD crossover and RSI for signs of overextension.
Technical Metrics
| Metric | Value |
|---|---|
| Current Price | $121.5700 |
| Daily Change | +2.68% |
| MA 20 | $113.2106 |
| % from MA20 | +7.38% |
| MA 50 | $102.9429 |
| % from MA50 | +18.09% |
| MA 200 | $85.6817 |
| % from MA200 | +41.89% |
| BB Upper | $130.4868 |
| % from BB Upper | -6.83% |
| BB Lower | $95.9344 |
| % from BB Lower | +26.72% |
| RSI (14) | 65.24 |
| MACD | 5.435243 |
| MACD Signal | 5.582327 |
| ATR (14) | 4.849967 |
| 3-Day High | $123.3850 |
| 3-Day Low | $116.8349 |
| 52-Week High | $127.9663 |
| % from 52W High | -5.00% |
| 52-Week Low | $60.4147 |
| % from 52W Low | +101.23% |
| YTD High | $148.2160 |
| % from YTD High | -17.98% |
| YTD Low | $60.4147 |
| % from YTD Low | +101.23% |
📊 Market Commentary
Solana (SOL) is currently trading at $121.57, up 2.68% today, as bullish momentum continues to build. The Relative Strength Index (RSI) at 65.2 suggests SOL is approaching overbought territory but still has room for upward movement before signaling excessive buying pressure. Over the past 52 weeks, SOL has ranged between $60.41 and $127.97, with the current price near the upper end of this band, indicating strong recovery from earlier lows.
Market sentiment appears cautiously optimistic, supported by broader crypto market strength and Solana’s resilient ecosystem activity. Traders are closely watching the $127.97 resistance level, a yearly high that, if breached, could reinforce bullish confidence. On the downside, key support lies near $110, a psychological and technical level that has held during recent pullbacks.
Network upgrades and sustained DeFi and NFT activity on Solana continue to attract attention, though competition from Ethereum and other Layer 1 chains remains a factor. Trading volumes have been steady, suggesting healthy participation without excessive speculation. Given the current RSI, traders may watch for consolidation or a potential pullback before further gains. The market will also monitor macroeconomic factors and Bitcoin’s movements, as SOL often correlates with broader crypto trends. For now, Solana remains in an uptrend, but resistance near all-time highs could test buyer conviction.
Market sentiment appears cautiously optimistic, supported by broader crypto market strength and Solana’s resilient ecosystem activity. Traders are closely watching the $127.97 resistance level, a yearly high that, if breached, could reinforce bullish confidence. On the downside, key support lies near $110, a psychological and technical level that has held during recent pullbacks.
Network upgrades and sustained DeFi and NFT activity on Solana continue to attract attention, though competition from Ethereum and other Layer 1 chains remains a factor. Trading volumes have been steady, suggesting healthy participation without excessive speculation. Given the current RSI, traders may watch for consolidation or a potential pullback before further gains. The market will also monitor macroeconomic factors and Bitcoin’s movements, as SOL often correlates with broader crypto trends. For now, Solana remains in an uptrend, but resistance near all-time highs could test buyer conviction.
Disclaimer
The content on MarketsFN.com is provided for educational and informational purposes only. It does not constitute financial advice or investment recommendations. All investments involve risk. Cryptocurrency markets are highly volatile. Past performance does not guarantee future results.