Silver: Up 0.4% to $68.69 — Testing 61.8% Fibonacci Support
QuoteReporter
•2 min read
Silver: Up 0.4% to $68.69 — Testing 61.8% Fibonacci Support
Analysis Date: June 09, 2026
📊 Current Market Data
CURRENT PRICE
$68.69
DAILY CHANGE
+0.39%
WEEKLY CHANGE
-8.78%
52W HIGH
$121.30
52W LOW
$35.27
💡 Key Market Factors
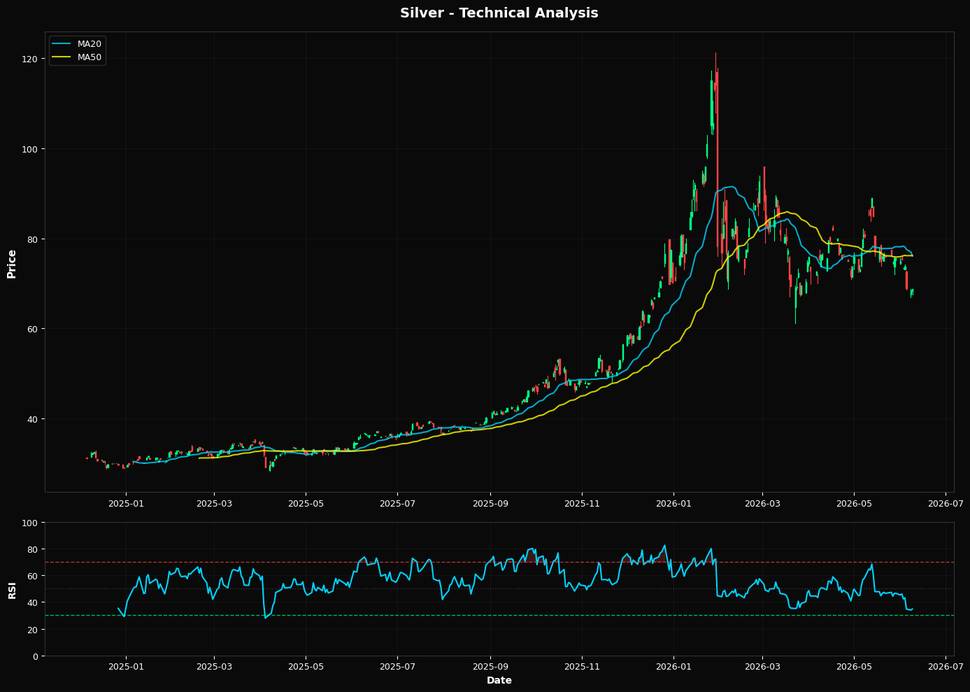
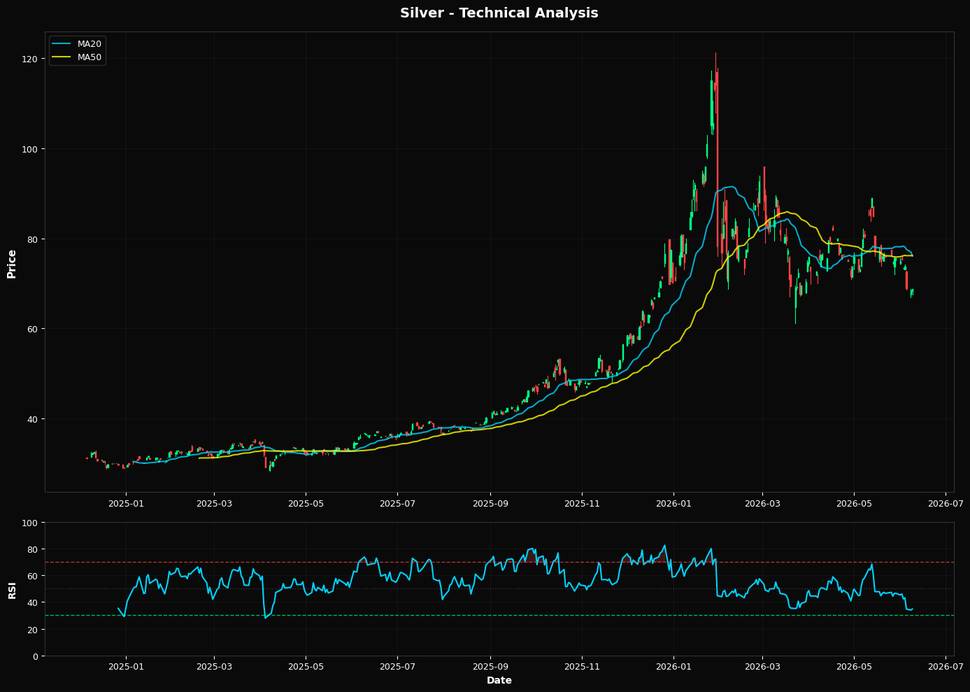
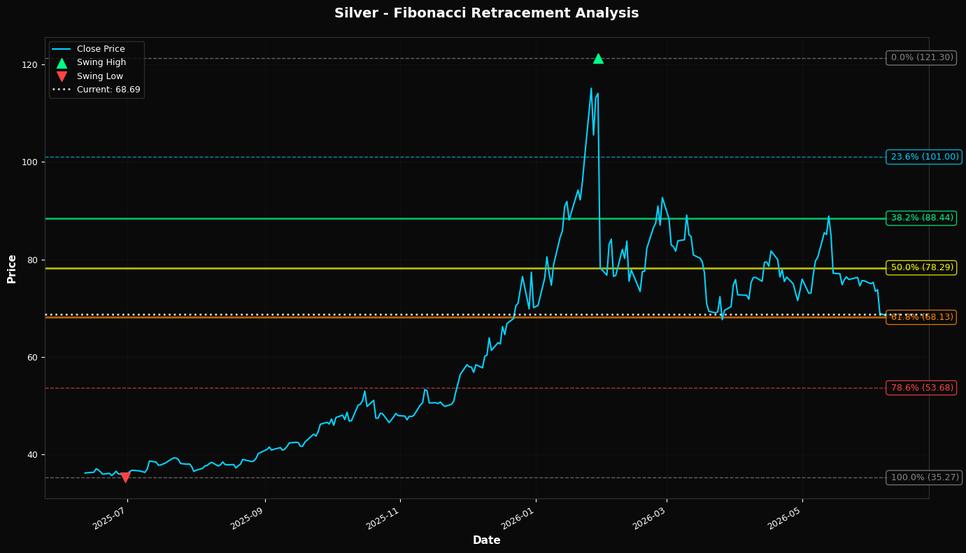
Silver's current price action suggests a potential rebound, with the $68.13 Fibonacci support level playing a crucial role. Despite a recent weekly decline of 8.78%, silver's proximity to this key Fibonacci level, coupled with an RSI of 34.7, indicates that it may be oversold and poised for a bounce. The RSI suggests that selling pressure could be waning, making this an attractive entry point for contrarian investors looking to capitalize on a potential reversal. The most significant macro driver for silver right now is the Federal Reserve's interest rate policy. With silver priced at $68.69, just above its 200-day moving average of $66.81, the market is closely watching for any shifts in Fed policy that could impact the U.S. dollar. A dovish turn by the Fed could weaken the dollar, making silver more attractive as an alternative store of value. Conversely, continued rate hikes could strengthen the dollar, putting further pressure on silver prices. Given the current macroeconomic environment, the Fed's policy decisions are likely to have a more immediate impact on silver than inflation or other factors. Technically, silver's position below both its 20-day and 50-day moving averages ($76.10 and $76.13, respectively) suggests a bearish trend in the short to medium term. However, the fact that it remains above the 200-day moving average provides a glimmer of hope for bulls. The market may be underpricing the potential for a technical rebound, especially if the price holds above the $68.13 Fibonacci support. This level could act as a springboard for a recovery, particularly if macro conditions become more favorable. A key catalyst that could alter the current outlook for silver is the upcoming U.S. employment report. A weaker-than-expected jobs number could prompt the Fed to reconsider its rate hike trajectory, potentially weakening the dollar and boosting silver prices. Conversely, a strong employment report could reinforce the Fed's hawkish stance, applying further downward pressure on silver. Investors should closely monitor this data release, as it could confirm or invalidate the current technical setup and macro narrative.📈 Technical Indicators Summary
RSI (14)
34.7
50-Day MA
$76.13
200-Day MA
$66.81
Fib Level
61.8%
📊 Technical Analysis Chart (18-Month View)
📐 Fibonacci Retracement Analysis
🎯 Key Trading Levels
Key Fibonacci Levels:
- 38.2%: $88.44
- 50.0%: $78.29
- 61.8%: $68.13
Support: $35.27 (Swing Low), $76.13 (50-Day MA)
Resistance: $121.30 (Swing High)
Disclaimer
The content on MarketsFN.com is provided for educational and informational purposes only. It does not constitute financial advice, investment recommendations, or trading guidance. All investments involve risks, and past performance does not guarantee future results. You are solely responsible for your investment decisions and should conduct independent research and consult a qualified financial advisor before acting. MarketsFN.com and its authors are not liable for any losses or damages arising from your use of this information.