Silver Advances 0.9% near 50.0% Fibonacci resistance
QuoteReporter
•2 min read
Silver Advances 0.9% near 50.0% Fibonacci resistance
Analysis Date: May 18, 2026
📊 Current Market Data
CURRENT PRICE
$77.82
DAILY CHANGE
+0.85%
WEEKLY CHANGE
-8.97%
52W HIGH
$121.30
52W LOW
$32.07
💡 Key Market Factors
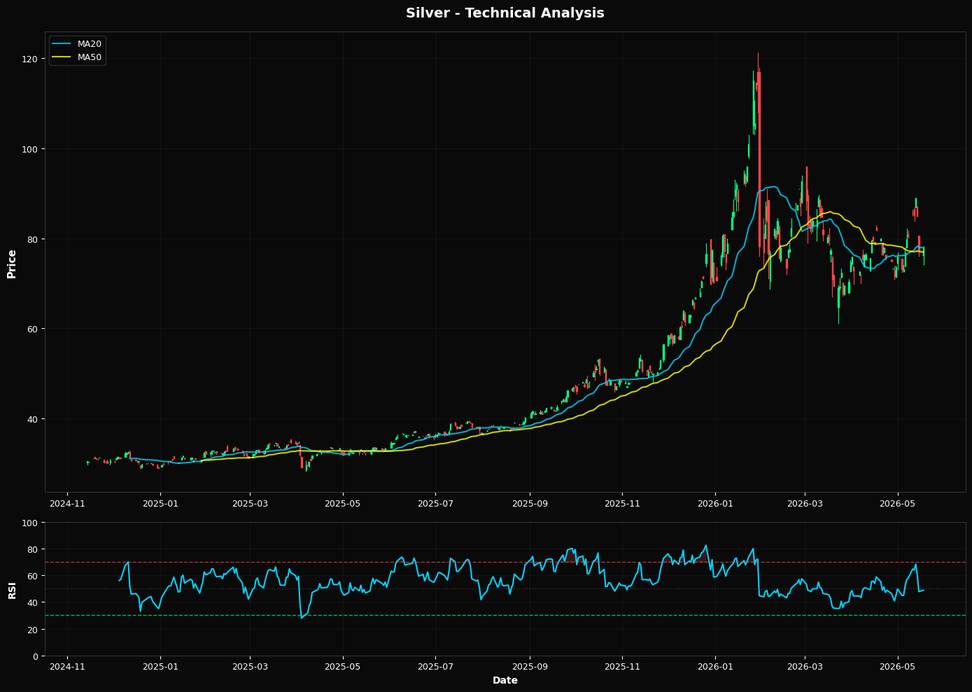
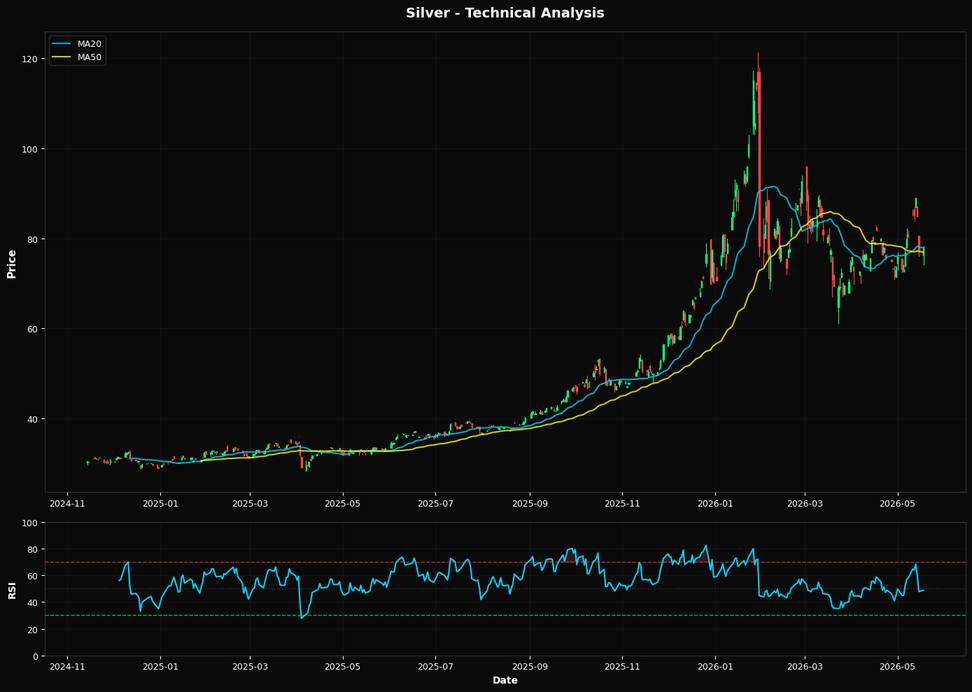
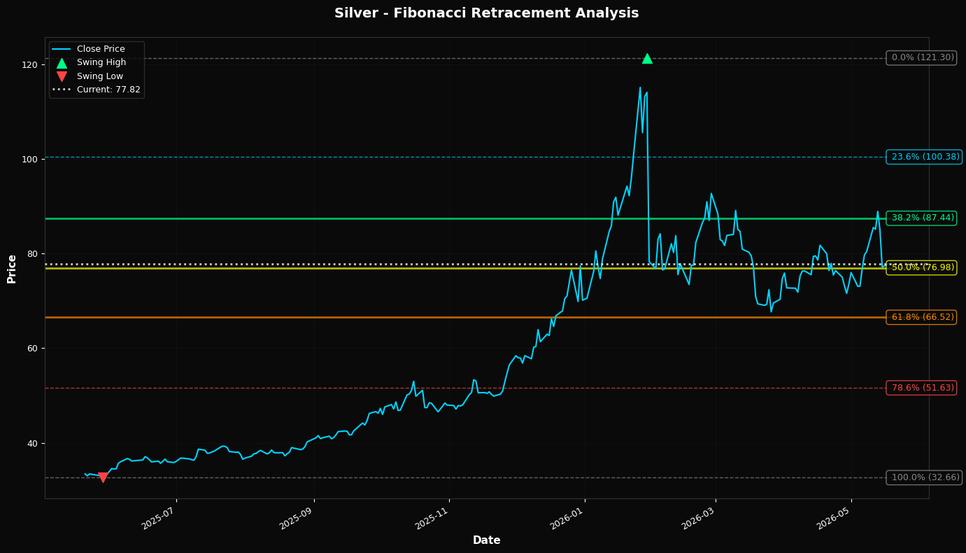
Silver's recent price movement reflects a complex interplay of macroeconomic factors, notably the Federal Reserve's monetary policy stance. With inflation showing signs of moderation yet remaining above target levels, the Fed's commitment to a higher-for-longer interest rate policy exerts downward pressure on silver. Higher interest rates generally increase the opportunity cost of holding non-yielding assets like silver, contributing to the metal's recent weekly decline of 8.97%. From a technical perspective, silver's current price of $77.82 is slightly below its 20-day moving average of $77.89 but remains above the 50-day moving average of $76.95. This positioning suggests a short-term consolidation phase, with the 50-day MA potentially acting as a support level. The Relative Strength Index (RSI) at 48.8 indicates a neutral momentum, neither overbought nor oversold, which may imply limited immediate directional bias unless influenced by external factors. The nearest Fibonacci retracement level at 50.0% is positioned at $76.98, close to the 50-day moving average, reinforcing this area as a critical support zone. A breach below this level could signal further downside risk, whereas a rebound might indicate a potential recovery phase. Overall, silver's trajectory will likely remain sensitive to shifts in monetary policy expectations and any significant geopolitical developments that could alter market dynamics.📈 Technical Indicators Summary
RSI (14)
48.8
50-Day MA
$76.95
200-Day MA
$64.10
Fib Level
50.0%
📊 Technical Analysis Chart (18-Month View)
📐 Fibonacci Retracement Analysis
🎯 Key Trading Levels
Key Fibonacci Levels:
- 38.2%: $87.44
- 50.0%: $76.98
- 61.8%: $66.52
Support: $32.66 (Swing Low), $76.95 (50-Day MA)
Resistance: $121.30 (Swing High)
Disclaimer
The content on MarketsFN.com is provided for educational and informational purposes only. It does not constitute financial advice, investment recommendations, or trading guidance. All investments involve risks, and past performance does not guarantee future results. You are solely responsible for your investment decisions and should conduct independent research and consult a qualified financial advisor before acting. MarketsFN.com and its authors are not liable for any losses or damages arising from your use of this information.