Shanghai Composite Market Update – April 30, 2026
MarketsFN Team
Shanghai Composite Market Update – April 30, 2026
Published: April 30, 2026 · MarketsFN Team
| Index | Price | Change | RSI(14) | SMA-20 | 52W High | 52W Low |
|---|---|---|---|---|---|---|
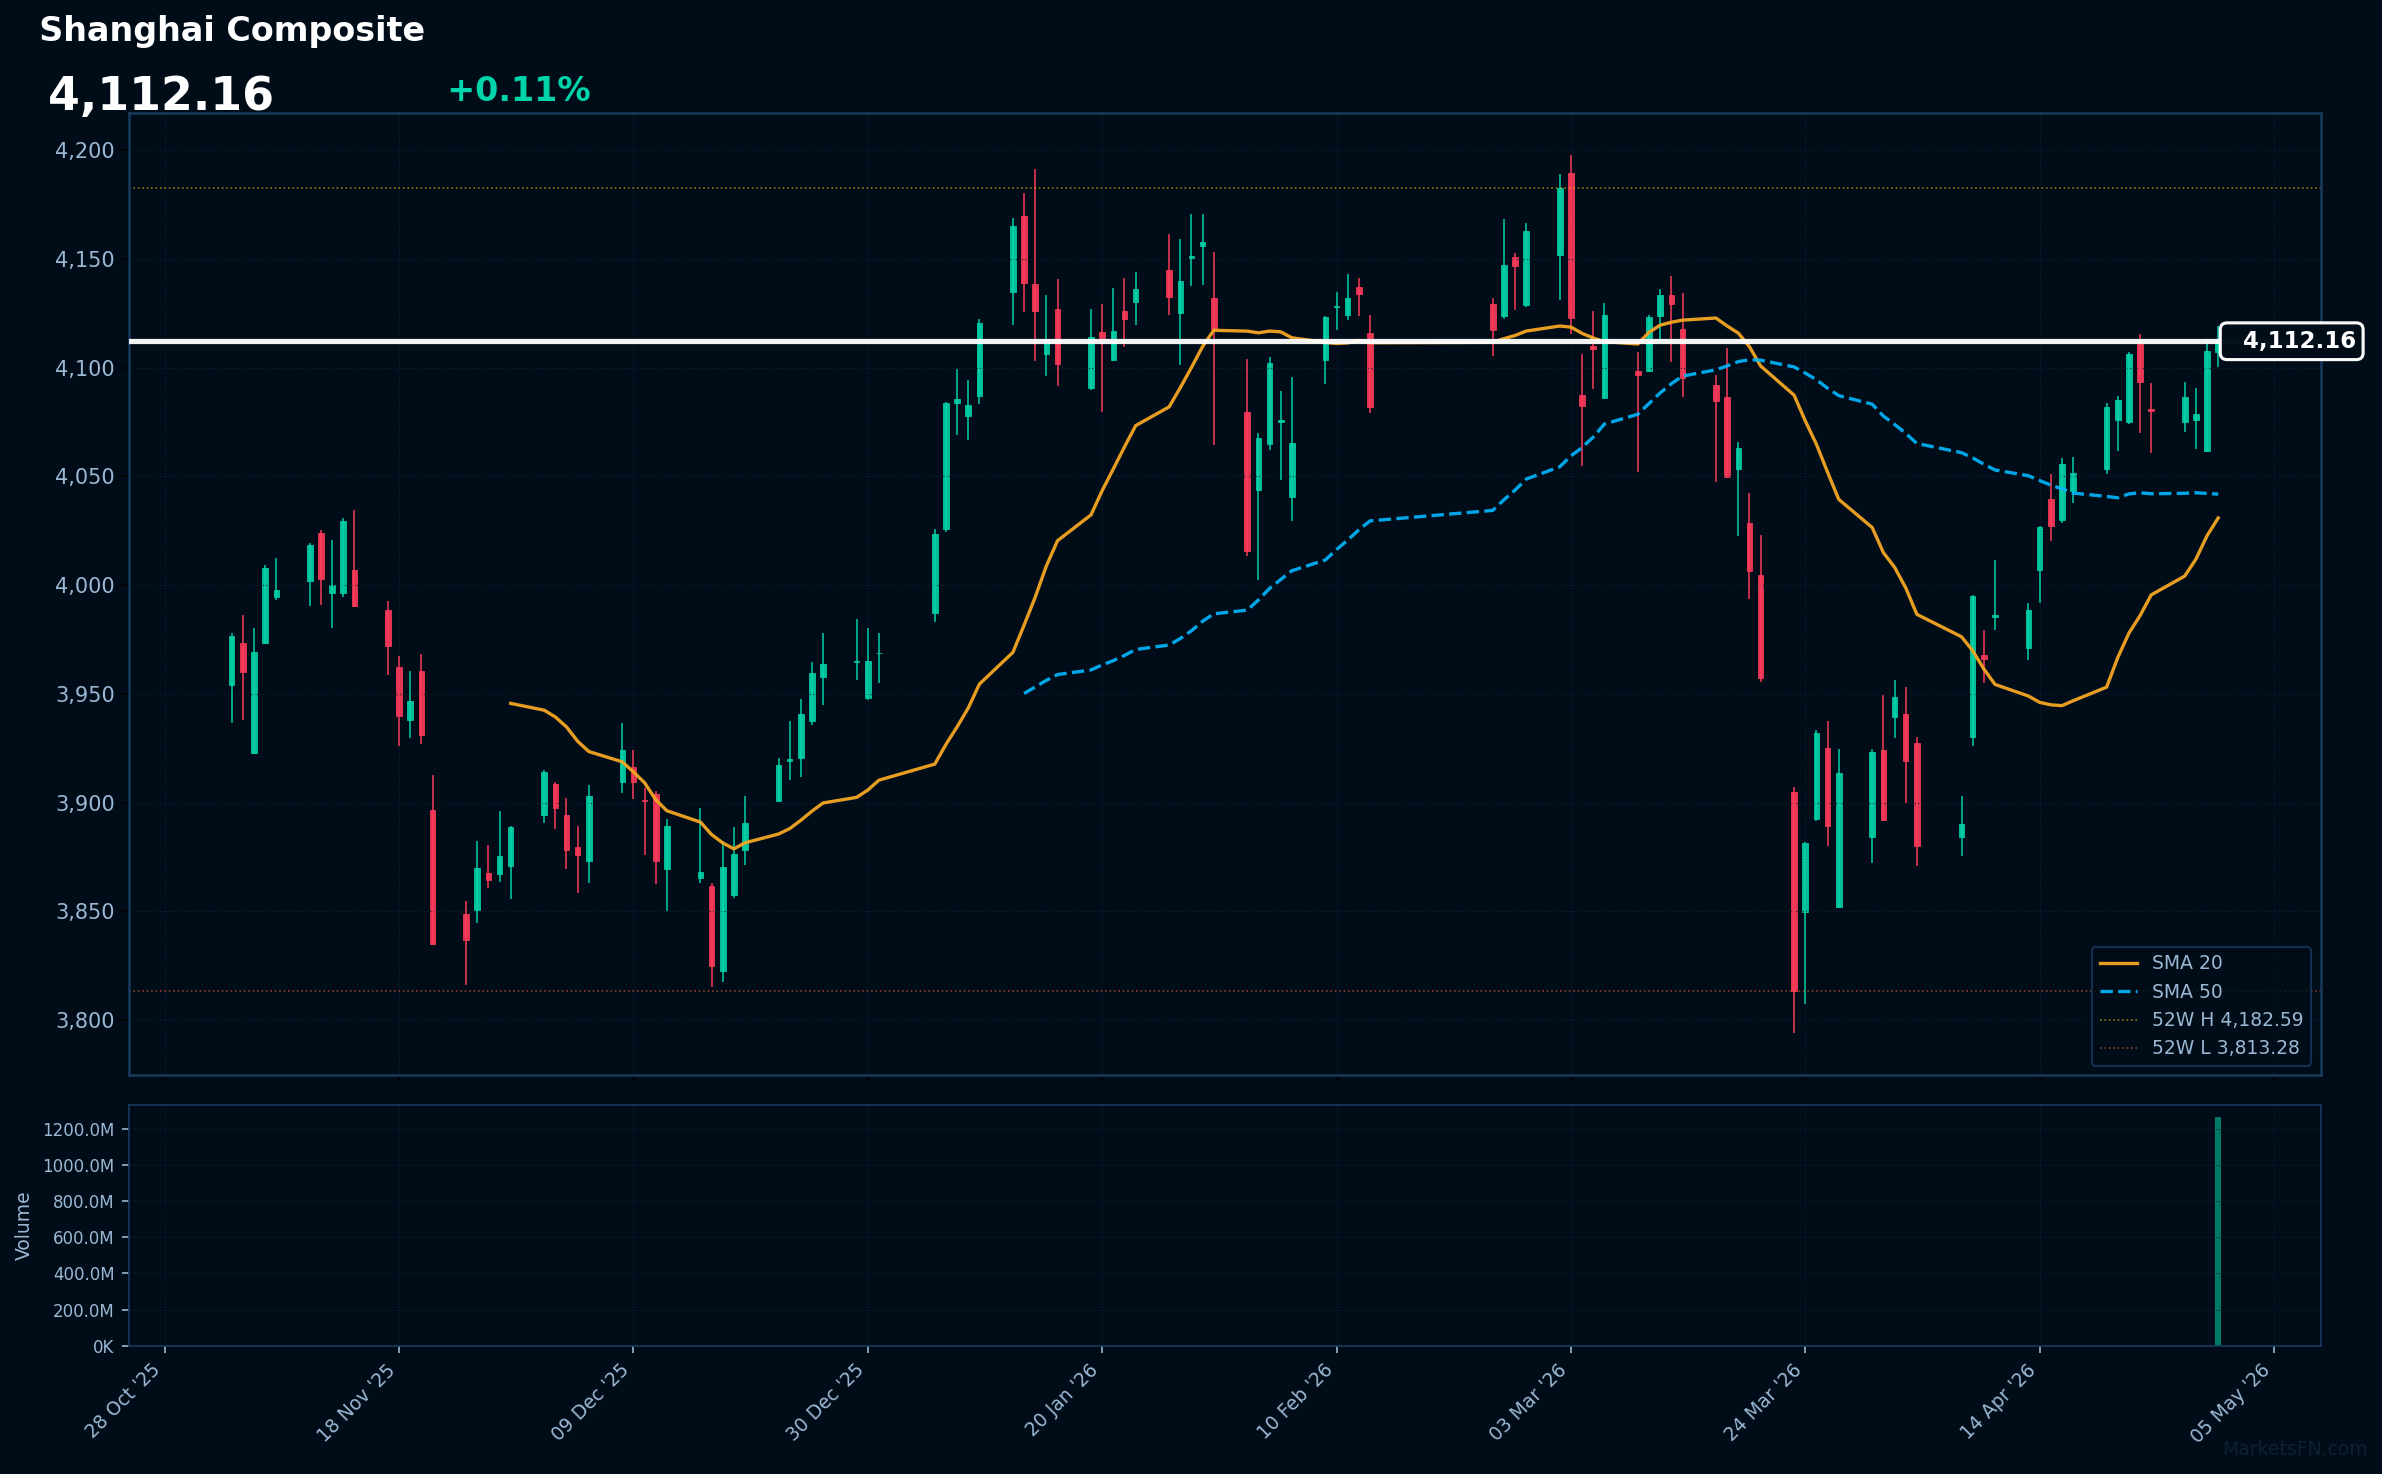
| Shanghai Composite | 4,112.16 | +0.11% | 81.1 | 4,030.88 | 4,182.59 | 3,813.28 |
The Shanghai Composite closed at 4,112.16 (+0.11%) on the day, reflecting a modest gain amid a generally stable trading environment. The index traded in a day range of 4,100.97 to 4,118.76, indicating a contained volatility as investors weigh economic signals against the backdrop of recent policy shifts.
From a technical perspective, the index remains above both the 20-day simple moving average (SMA) at 4,030.88 and the 50-day SMA at 4,041.84, which suggests a bullish trend in the near term. However, the relative strength index (RSI) at 81.1 indicates that the market is entering overbought territory, raising the potential for a price correction. The index's 52-week range of 3,813.28 to 4,182.59 further highlights the current price's proximity to its recent highs.
Looking ahead, key levels to watch include the psychological barrier of 4,100 as support and the 4,182.59 resistance level, which could act as a catalyst for further directional moves. Traders should remain cautious of potential pullbacks given the elevated RSI, while monitoring macroeconomic indicators that could influence market sentiment.
Disclaimer
The content on MarketsFN.com is provided for educational and informational purposes only. It does not constitute financial advice or investment recommendations. All investments involve risks and past performance does not guarantee future results. You are solely responsible for your investment decisions.