Shanghai Composite Leads Asian Markets Amid Mixed Sentiment and Rate Hike Concerns
MarketsFN Team
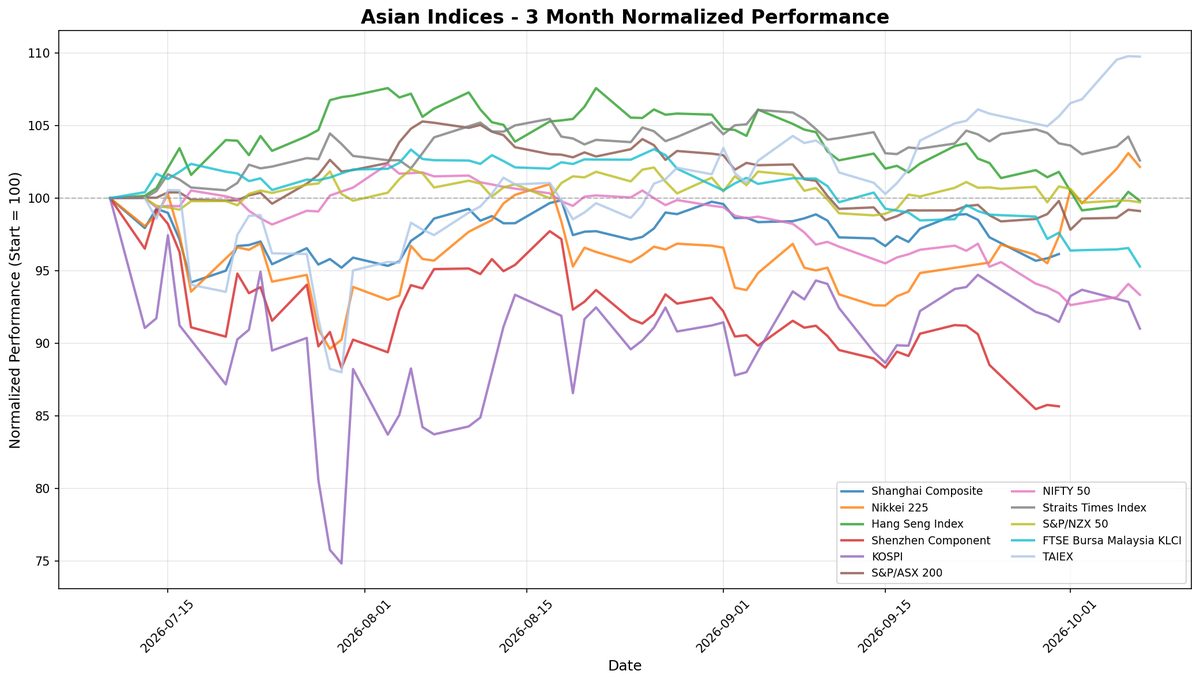
Shanghai Composite Leads Asian Markets Amid Mixed Sentiment and Rate Hike Concerns
Note: This analysis covers the Asian trading session close for October 07, 2026. All times are in US Eastern Time (ET).
📊 Asian Indices Performance
| Index | Price | Daily Change (%) |
|---|---|---|
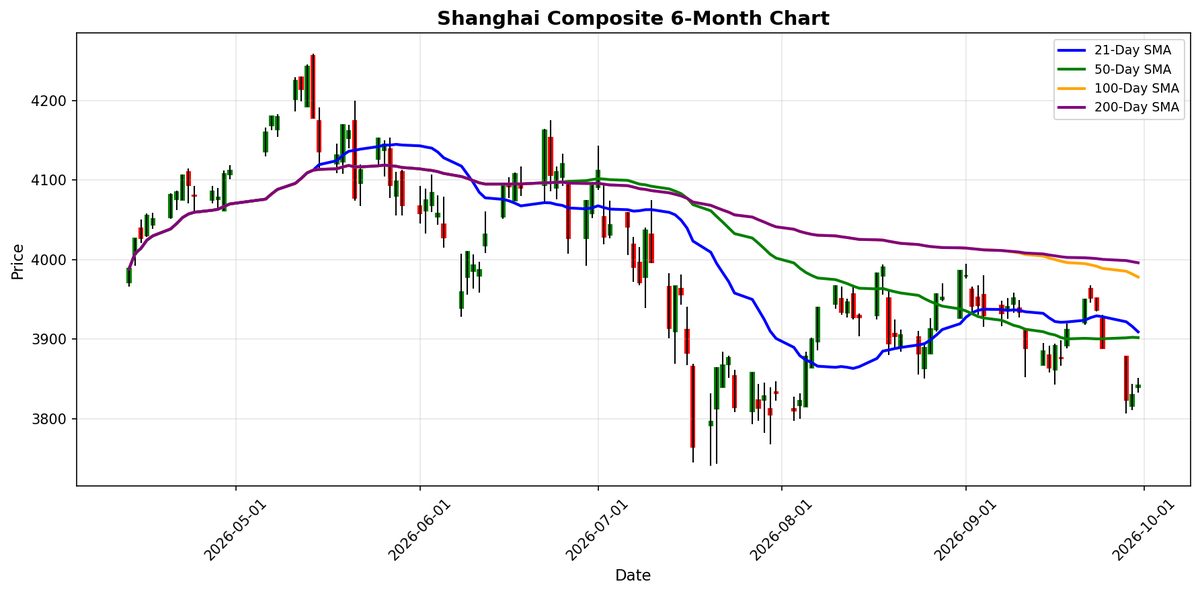
| Shanghai Composite | 3,842.20 | +0.31% |
| Nikkei 225 | 70,035.71 | -0.92% |
| Hang Seng Index | 24,130.50 | -0.62% |
| Shenzhen Component | 12,887.62 | -0.11% |
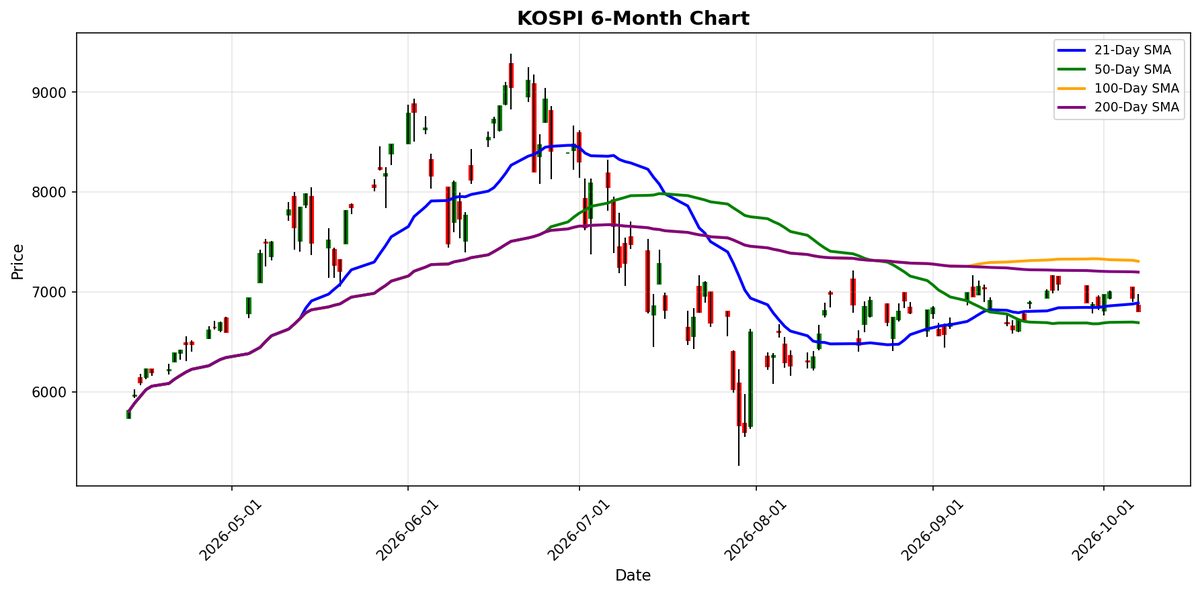
| KOSPI | 6,803.90 | -1.98% |
| S&P/ASX 200 | 8,727.70 | -0.09% |
| NIFTY 50 | 22,592.00 | -0.81% |
| Straits Times Index | 5,611.36 | -1.58% |
| S&P/NZX 50 | 13,684.04 | -0.12% |
| FTSE Bursa Malaysia KLCI | 1,611.78 | -1.32% |
| TAIEX | 49,806.37 | -0.03% |
📰 Market Commentary
On October 07, 2026, Asian markets experienced a mixed trading session, influenced by a combination of economic developments, central bank policies, and sector-specific performance. ### Key Events Impacting Asian Indices 1. **Bank of Japan's Policy Statement**: Ayano Sato, a member of the Bank of Japan's policy board, expressed support for gradual interest rate hikes, despite opposing a rate increase in September. This statement could signal a shift in monetary policy that may affect investor sentiment in Japan and beyond. 2. **European Union-China Trade Talks**: The EU is engaged in intensive negotiations with China, aiming for signs of progress in their trade relationship. While this has implications for trade dynamics in the region, market expectations remain cautious. 3. **Hong Kong's Real Estate Outlook**: Morgan Stanley highlighted a more favorable outlook for Hong Kong's office market compared to New York, suggesting potential resilience in the face of rising interest rates. ### Market Sentiment and Price Movements - **Tokyo Stocks**: The Nikkei 225 fell by 0.92%, primarily due to profit-taking in technology and semiconductor stocks following a recent rally. This reflects a cautious sentiment among investors as they reassess the sustainability of gains in these sectors. - **Hong Kong's Hang Seng Index**: The index declined by 0.62%, driven by broader market concerns and a lack of significant positive catalysts. Investors are wary as the region navigates economic uncertainties. - **India's Nifty 50**: The Nifty 50 dropped by 0.81%, with the Indian rupee nearing a record low. The Reserve Bank of India's recent interest rate hike did not meet market expectations, leading to disappointment among traders. - **KOSPI and Other Indices**: The KOSPI in South Korea fell by 1.98%, reflecting regional pressures, while other indices such as the Straits Times Index and FTSE Bursa Malaysia KLCI also posted declines of 1.58% and 1.32%, respectively. ### Regional Economic Developments 1. **Alternative Investments in Asia**: A survey indicated that financial advisors in Asia are increasingly looking to boost allocations to alternative investments, despite a decline in overall economic confidence. This shift suggests a growing maturity in investment strategies as advisors seek to enhance their portfolios with diversified asset classes. 2. **Tokenized Deposits Initiative**: OCBC Bank in Singapore launched a tokenized deposit solution in collaboration with Ant International, marking a significant step in integrating blockchain technology into traditional banking practices. This innovation aims to enhance liquidity management and treasury operations across borders. 3. **AI and Economic Outlook**: The World Bank has raised its growth outlook for East Asia and the Pacific to 4.5%, although it flagged weak trade growth outside AI-related goods. This highlights the dual nature of AI's impact—offering growth potential while also presenting risks, as noted by various financial leaders. Overall, the Asian markets on October 07, 2026, are navigating a complex landscape marked by cautious investor sentiment, evolving economic policies, and sector-specific challenges, particularly in technology and real estate.
📅 Economic Calendar - Asian Session
All times are in US Eastern Time (ET)
| Date | Time | Cur | Imp | Event | Actual | Forecast |
|---|---|---|---|---|---|---|
| 2026-10-07 | 00:30 | 🇮🇳 | Medium | Interest Rate Decision | 5.50% | 5.50% |
| 2026-10-07 | 19:50 | 🇯🇵 | Medium | Adjusted Current Account (Aug) | 2.14T | |
| 2026-10-07 | 19:50 | 🇯🇵 | Medium | Current Account n.s.a. (Aug) | 3.194T |
On October 07, 2026, several key economic events from Asian countries have implications for traders, particularly in relation to market indices. 1. **India - Interest Rate Decision** - **Actual**: 5.50% - **Forecast**: 5.50% - **Analysis**: The Reserve Bank of India maintained its interest rate at 5.50%, aligning with market expectations. This decision suggests a commitment to a stable monetary policy amid ongoing inflation concerns. Traders may interpret this as a sign of confidence in the Indian economy, potentially supporting the Nifty 50 index and other related equities. 2. **Japan - Adjusted Current Account (August)** - **Actual**: Data not released - **Forecast**: 2.14 trillion JPY - **Analysis**: The lack of actual data for the adjusted current account could lead to uncertainty in the market. Traders may be cautious, awaiting further information that could impact the Japanese yen and influence the Nikkei 225 index. 3. **Japan - Current Account n.s.a. (August)** - **Actual**: Data not released - **Forecast**: 3.194 trillion JPY - **Analysis**: Similar to the adjusted current account, the absence of actual figures for the current account could result in volatility for the yen and Japanese equities. Traders may be on alert for subsequent releases that could clarify Japan’s trade balance and economic health. **Market Implications**: - The steady interest rate in India may bolster investor confidence, positively impacting Indian indices. - The uncertainty surrounding Japan's current account data could lead to cautious trading in Japanese markets, with potential fluctuations in the yen. - Overall, the mixed signals from Japan could create a divergence in market sentiment across Asian indices, with a stronger outlook for India compared to Japan. Traders should remain vigilant for any updates that could influence these economic indicators.
📈 Index Performance Charts
Best Performer: Shanghai Composite
Worst Performer: KOSPI
💱 FX, Commodities & Crypto
### FX Pairs Performance **Key Price Movements:** - **USD/JPY:** The pair is trading at 158.2500, reflecting a slight increase of 0.10%. - **USD/CNY:** This pair shows a marginal rise of 0.02%, currently at 6.6933. - **AUD/USD:** The Australian dollar has depreciated by 0.16%, now at 0.6973. - **NZD/USD:** The New Zealand dollar has seen a decline of 0.27%, priced at 0.5609. **Market Drivers:** The USD remains strong against major currencies, supported by ongoing interest rate expectations from the Federal Reserve. In contrast, the Australian and New Zealand dollars are under pressure due to concerns over commodity demand and economic growth in China, which impacts their export-driven economies. ### Commodities Performance **Key Price Movements:** - **Gold:** Priced at $4,147.60, gold has decreased by 0.94%. - **Silver:** The price of silver is $60.49, down by 1.10%. - **Crude Oil (WTI):** Crude oil has risen to $89.87, marking an increase of 0.48%. **Market Drivers:** Gold and silver prices are pressured by a stronger USD and rising interest rates, which diminish their appeal as safe-haven assets. Conversely, crude oil prices are supported by ongoing geopolitical tensions and supply constraints, which are driving up demand amid recovering global economies. ### Cryptocurrency Performance **Key Price Movements:** - **Bitcoin:** Currently priced at $83,814, Bitcoin has dropped by 2.04%. - **Ethereum
Currency Pairs
| Pair | Price | Daily Change (%) |
|---|---|---|
| USD/JPY | 158.25 | +0.10% |
| USD/CNY | 6.69 | +0.02% |
| AUD/USD | 0.70 | -0.16% |
| NZD/USD | 0.56 | -0.27% |
Commodities
| Commodity | Price | Daily Change (%) |
|---|---|---|
| Gold | $4147.60 | -0.94% |
| Silver | $60.49 | -1.10% |
| Crude Oil (WTI) | $89.87 | +0.48% |
Cryptocurrencies
| Asset | Price | Daily Change (%) |
|---|---|---|
| Bitcoin | $83,814 | -2.04% |
| Ethereum | $2,605 | -3.44% |
Disclaimer
The content on MarketsFN.com is provided for educational and informational purposes only. It does not constitute financial advice, investment recommendations, or trading guidance. All investments involve risks, and past performance does not guarantee future results. You are solely responsible for your investment decisions and should conduct independent research and consult a qualified financial advisor before acting. MarketsFN.com and its authors are not liable for any losses or damages arising from your use of this information.