S&P 500 52-Week Highs & Lows Radar: Visa (V), L3Harris (LHX) and more
MarketsFN Team

S&P 500 52-Week Highs & Lows Radar: Visa (V), L3Harris (LHX) and more
Screening all 503 S&P 500 constituents for stocks nearest to their 52-week high and their 52-week low. Data as of August 24, 2026. % Realized = 52-week total return.
Legend: RSI > 70 = overbought · RSI < 30 = oversold · Green % Realized = positive 52W return · Red = negative.
📈 Nearest to 52-Week High
Sectors represented: Financial (2), Consumer Defensive (1), Industrials (1), Energy (1)
| Ticker | Company | Sector | Price Last | % Realized | 52-Week High Date | RSI | % above MA200 | Trend |
|---|---|---|---|---|---|---|---|---|
| V | Visa Inc | Financial | $380.07 | +8.96% | 2026-08-24 | 67.8 | +14.4% | Above MA20, MA50, MA200 |
| KO | Coca-Cola Co | Consumer Defensive | $92.25 | +33.84% | 2026-08-24 | 73.7 | +18.9% | Above MA20, MA50, MA200 |
| SCHW | Charles Schwab Corp | Financial | $114.28 | +18.81% | 2026-08-24 | 74.3 | +18.1% | Above MA20, MA50, MA200 |
| UNP | Union Pacific Corp | Industrials | $310.50 | +39.04% | 2026-08-24 | 68.8 | +20.9% | Above MA20, MA50, MA200 |
| COP | Conoco Phillips | Energy | $134.99 | +37.50% | 2026-08-24 | 74.2 | +21.9% | Above MA20, MA50, MA200 |
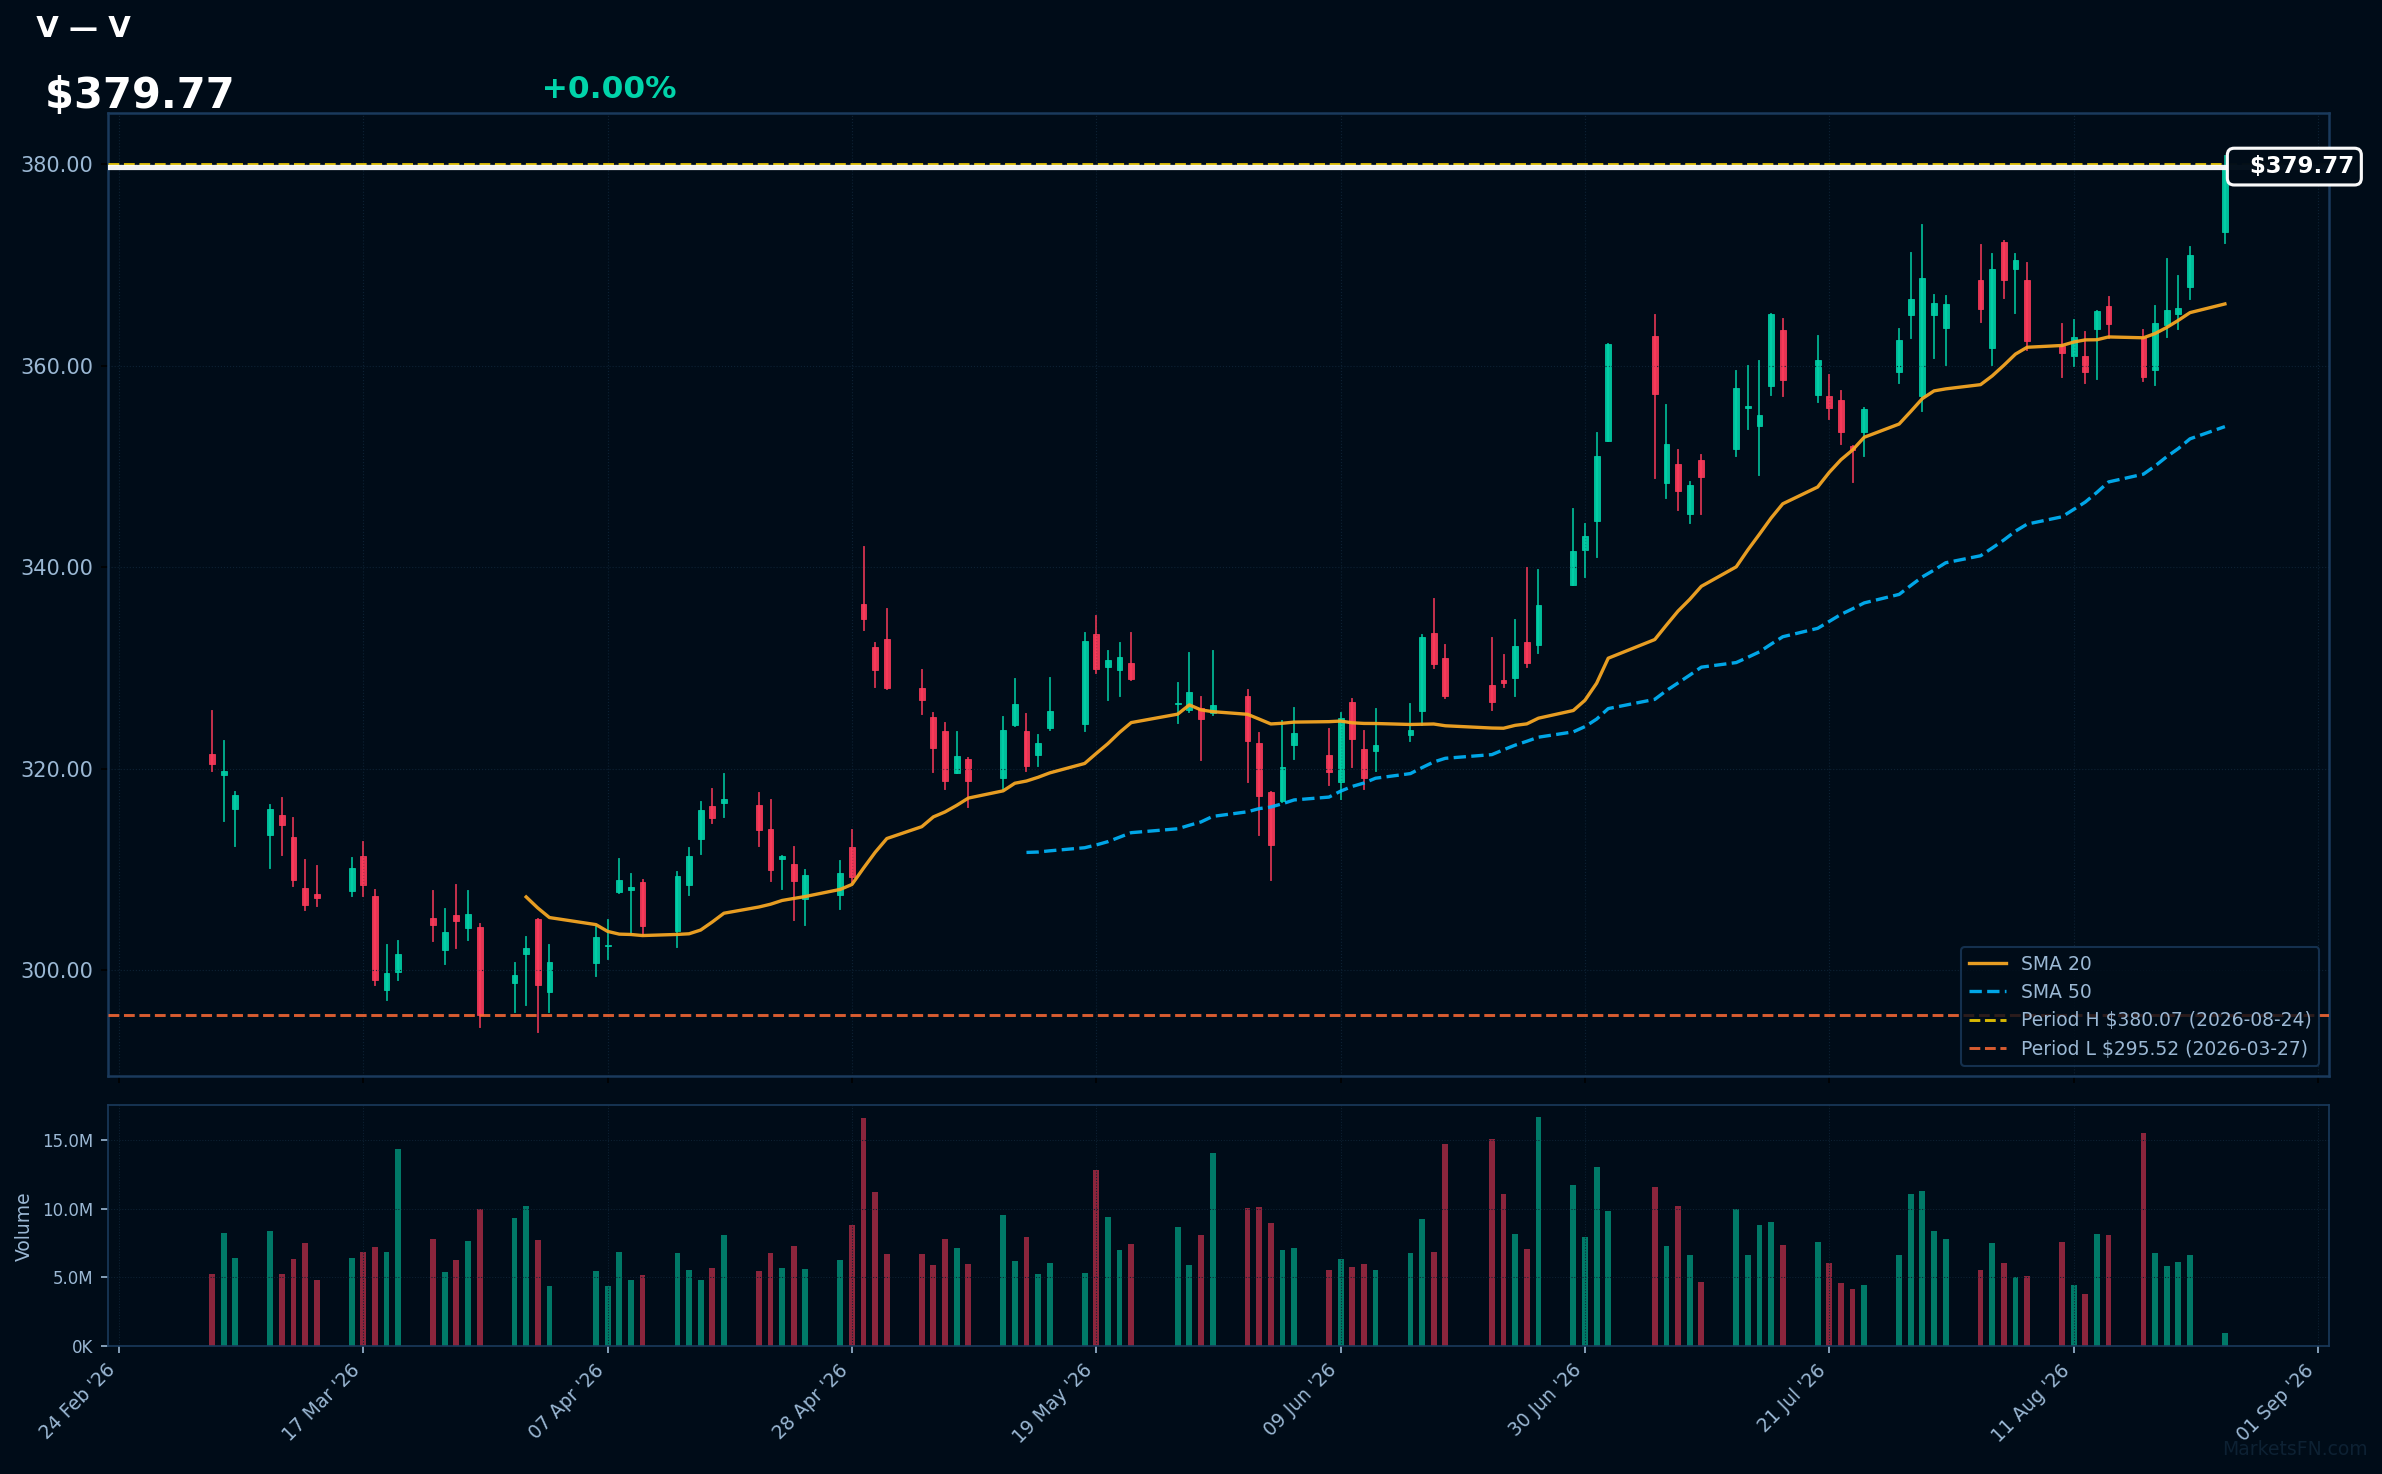
V | Visa Inc | Financial | Price Last: $380.07 | % Realized: +8.96% | RSI: 67.8 | % above MA200: +14.4% | Trend: Above MA20, MA50, MA200
Visa Inc operates a global payments technology network, facilitating digital payments between consumers, merchants, and financial institutions. Investors should care due to its dominant market position and continuous growth in electronic payment transactions, which are increasingly replacing cash.
The current technical situation indicates bullish momentum with an RSI(14) of 67.8 and a strong MA alignment: price > MA20 > MA50 > MA200. The stock is also 0.0% below its 52-Week high, signaling a potential breakout.
Related headlines
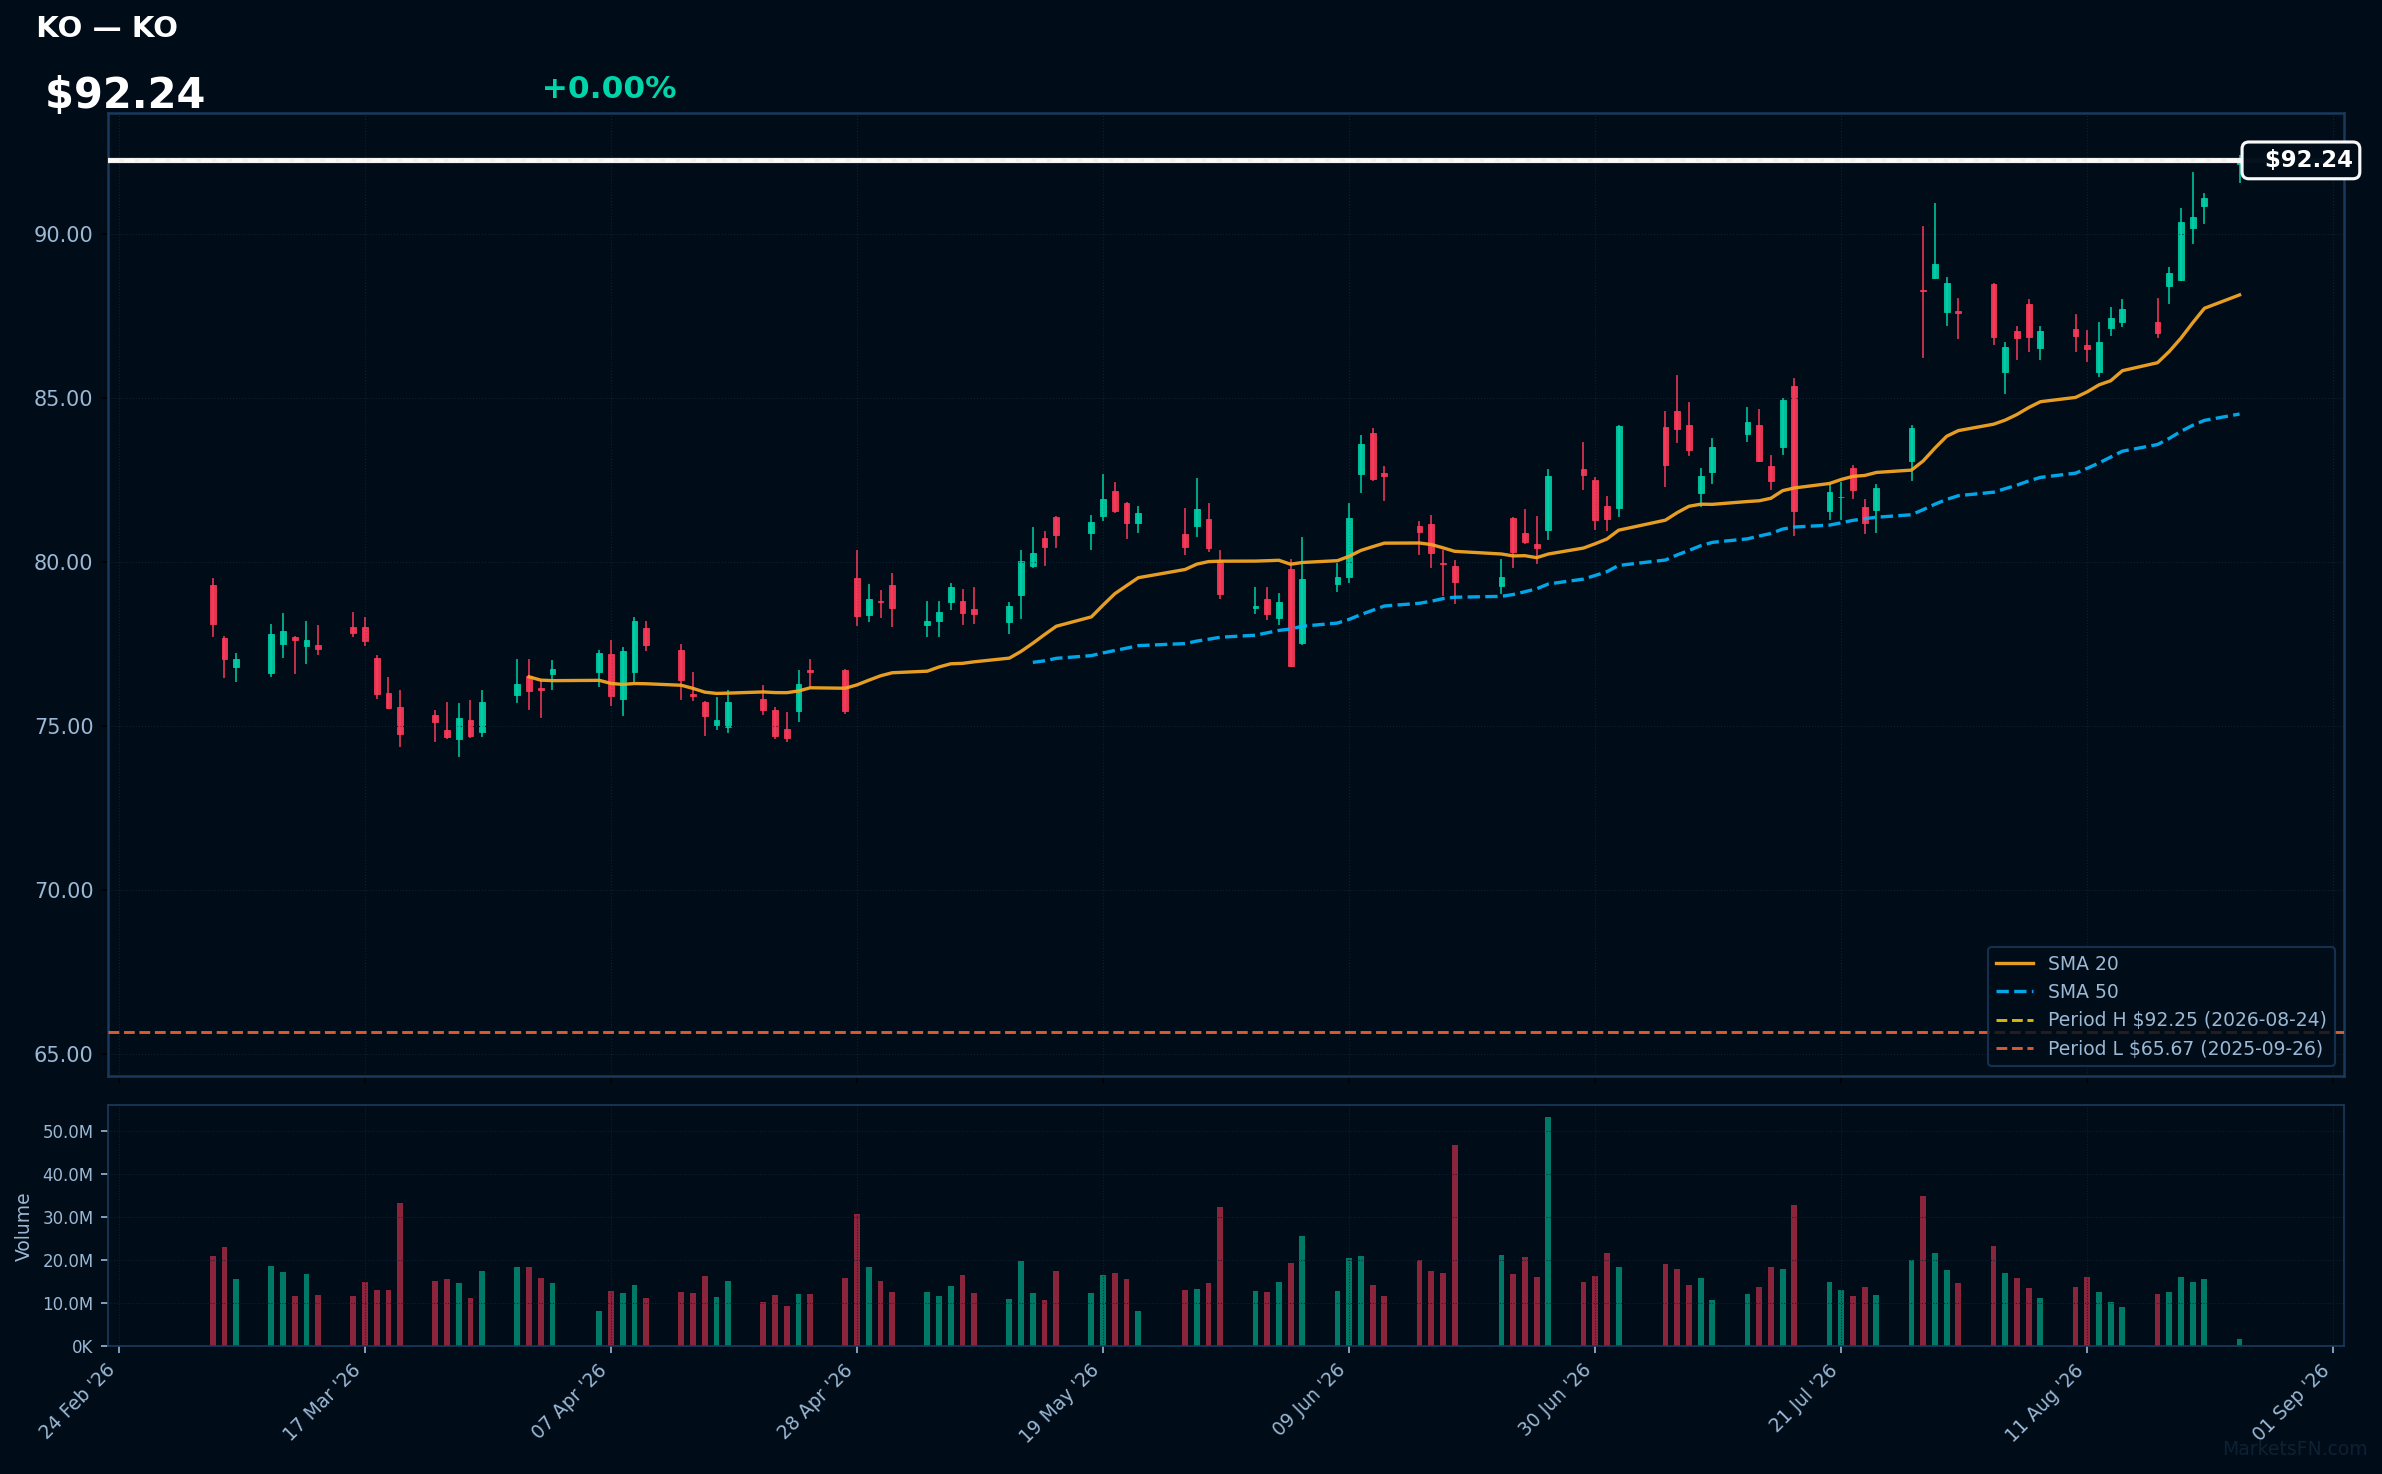
KO | Coca-Cola Co | Consumer Defensive | Price Last: $92.25 | % Realized: +33.84% | RSI: 73.7 | % above MA200: +18.9% | Trend: Above MA20, MA50, MA200
Coca-Cola Co (KO) is a leading beverage company, known for its extensive portfolio of non-alcoholic drinks, including soft drinks, juices, and water. Investors should care due to its strong brand equity and consistent demand, which drive stable revenue and dividend growth.
The current technical situation indicates bullish momentum, with an RSI(14) of 73.7 and a bullish MA alignment: price > MA20 > MA50 > MA200. The stock is also 0.0% below its 52-Week high, signaling a potential breakout.
Related headlines
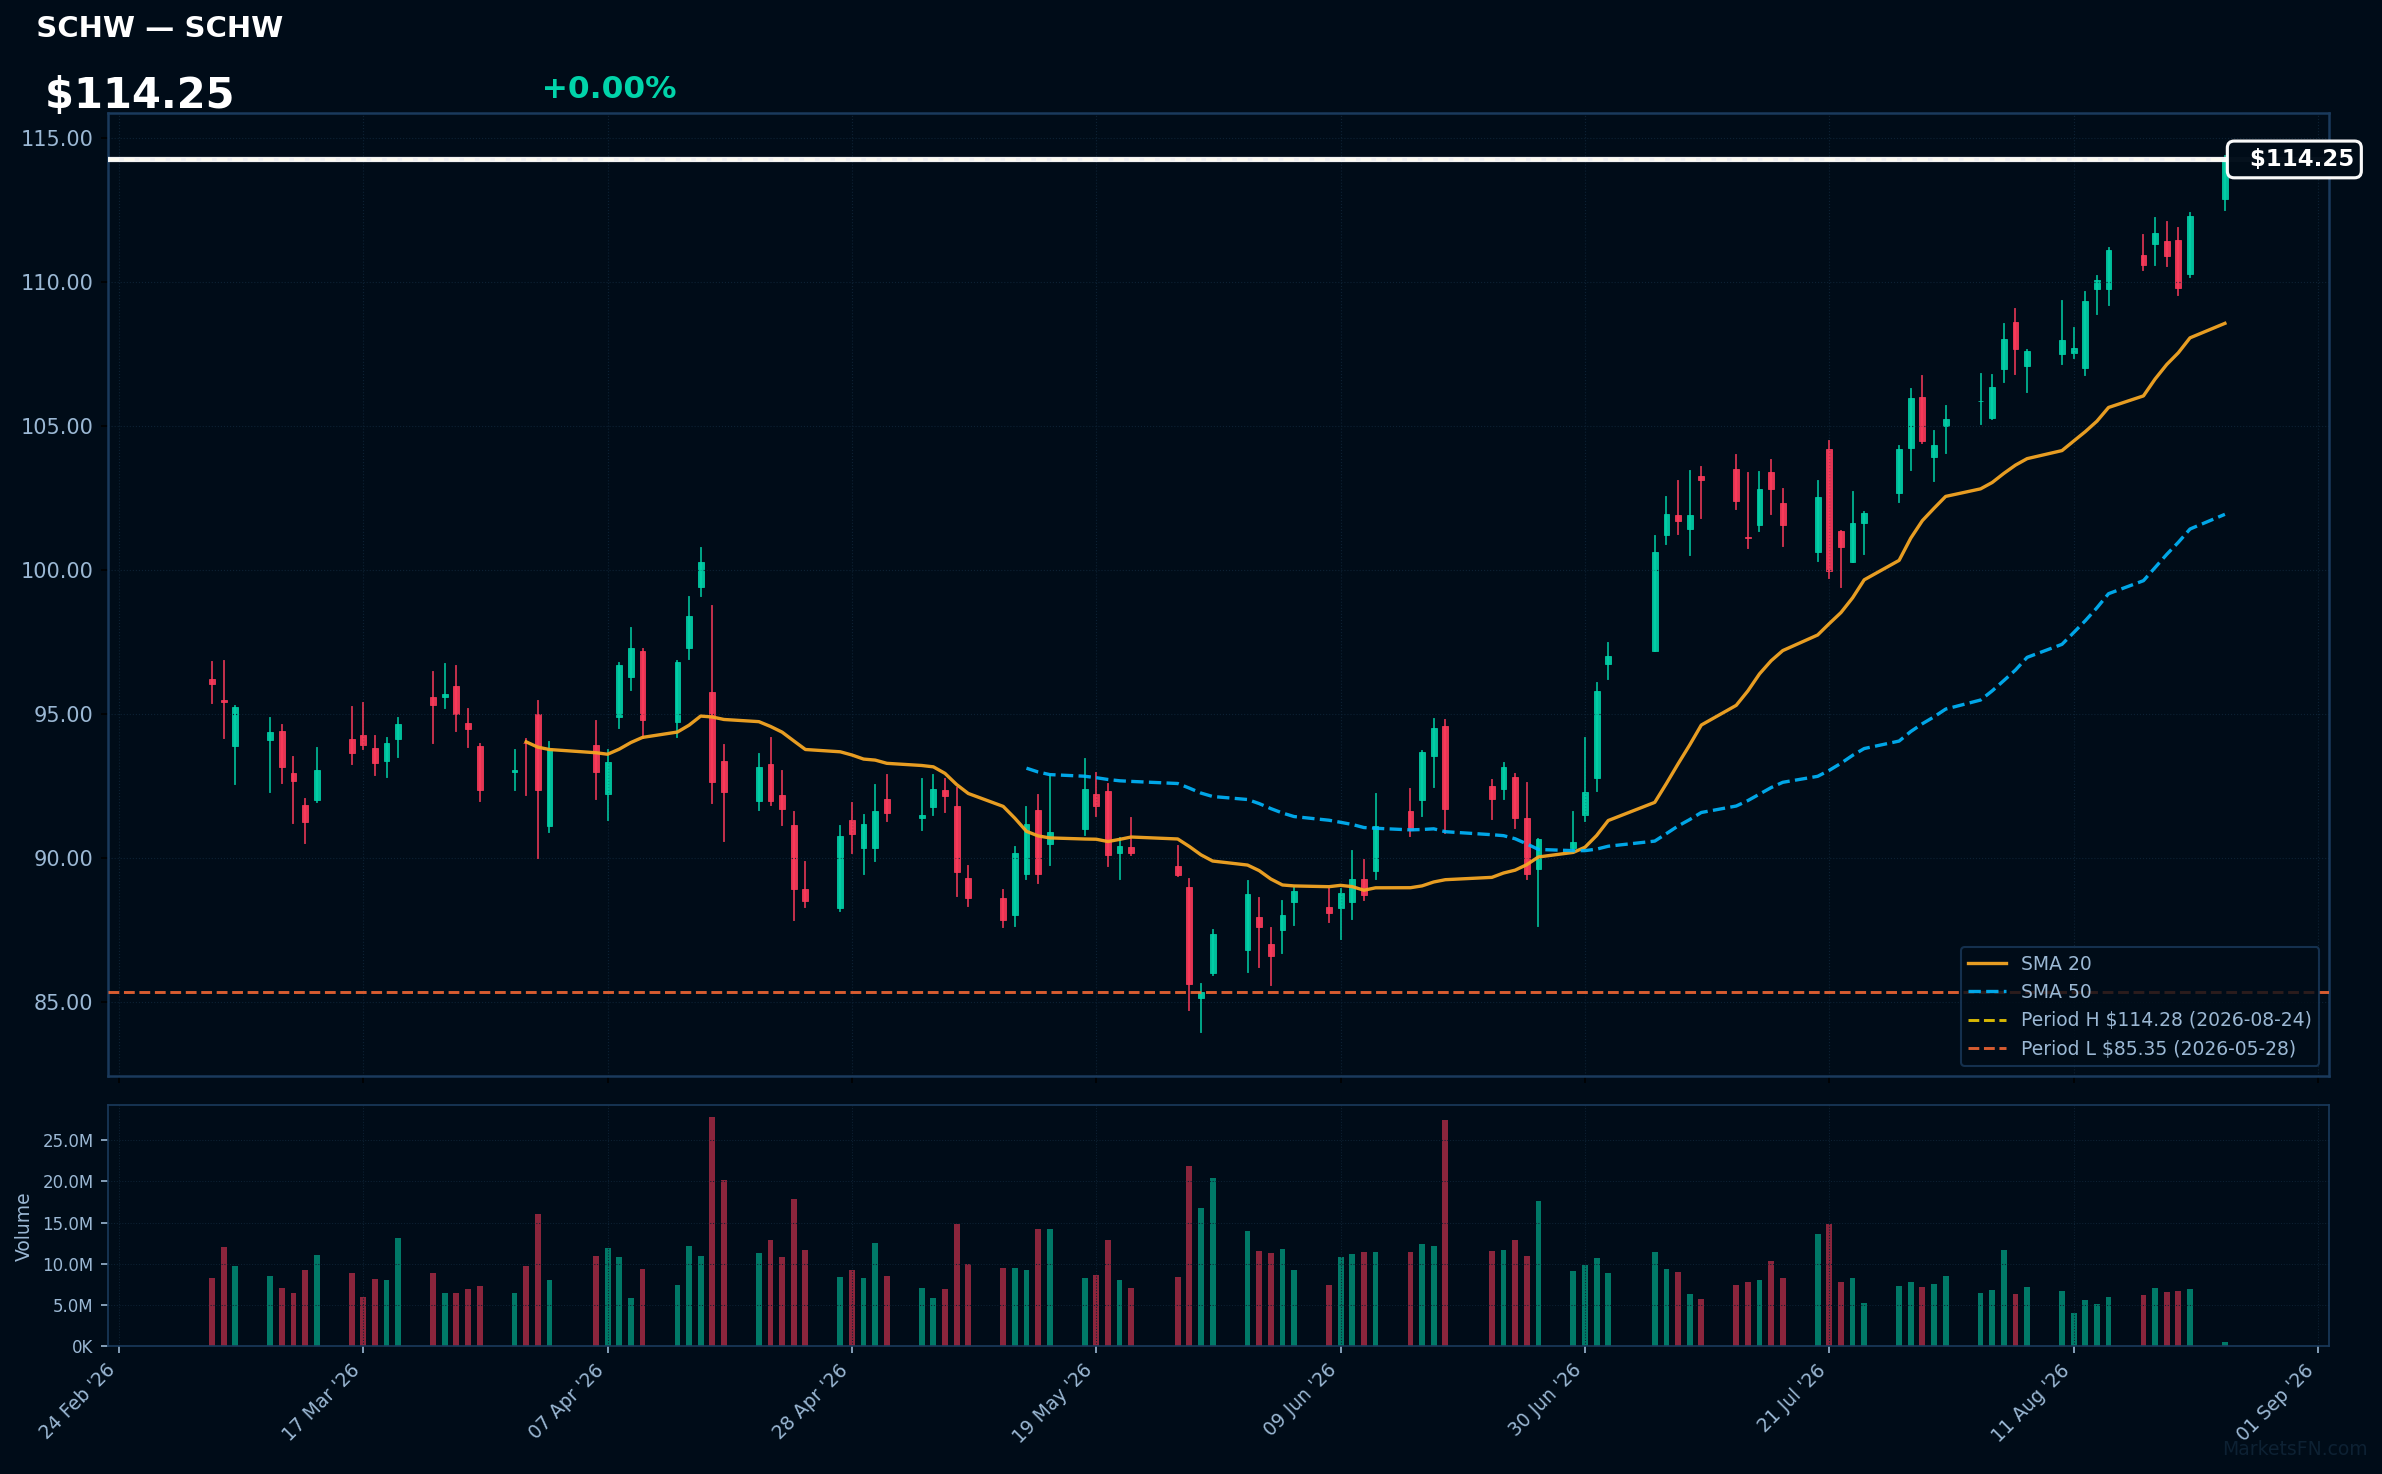
SCHW | Charles Schwab Corp | Financial | Price Last: $114.28 | % Realized: +18.81% | RSI: 74.3 | % above MA200: +18.1% | Trend: Above MA20, MA50, MA200
Charles Schwab Corp provides brokerage and financial services, focusing on investment management and wealth management solutions. Investors should care due to its significant market position and ability to attract retail and institutional clients, driving revenue growth and enhancing shareholder value.
The current technical situation indicates strong momentum, with an RSI(14) of 74.3 and a bullish MA alignment: price > MA20 > MA50 > MA200, suggesting a sustained uptrend and proximity to a potential breakout level.
Related headlines
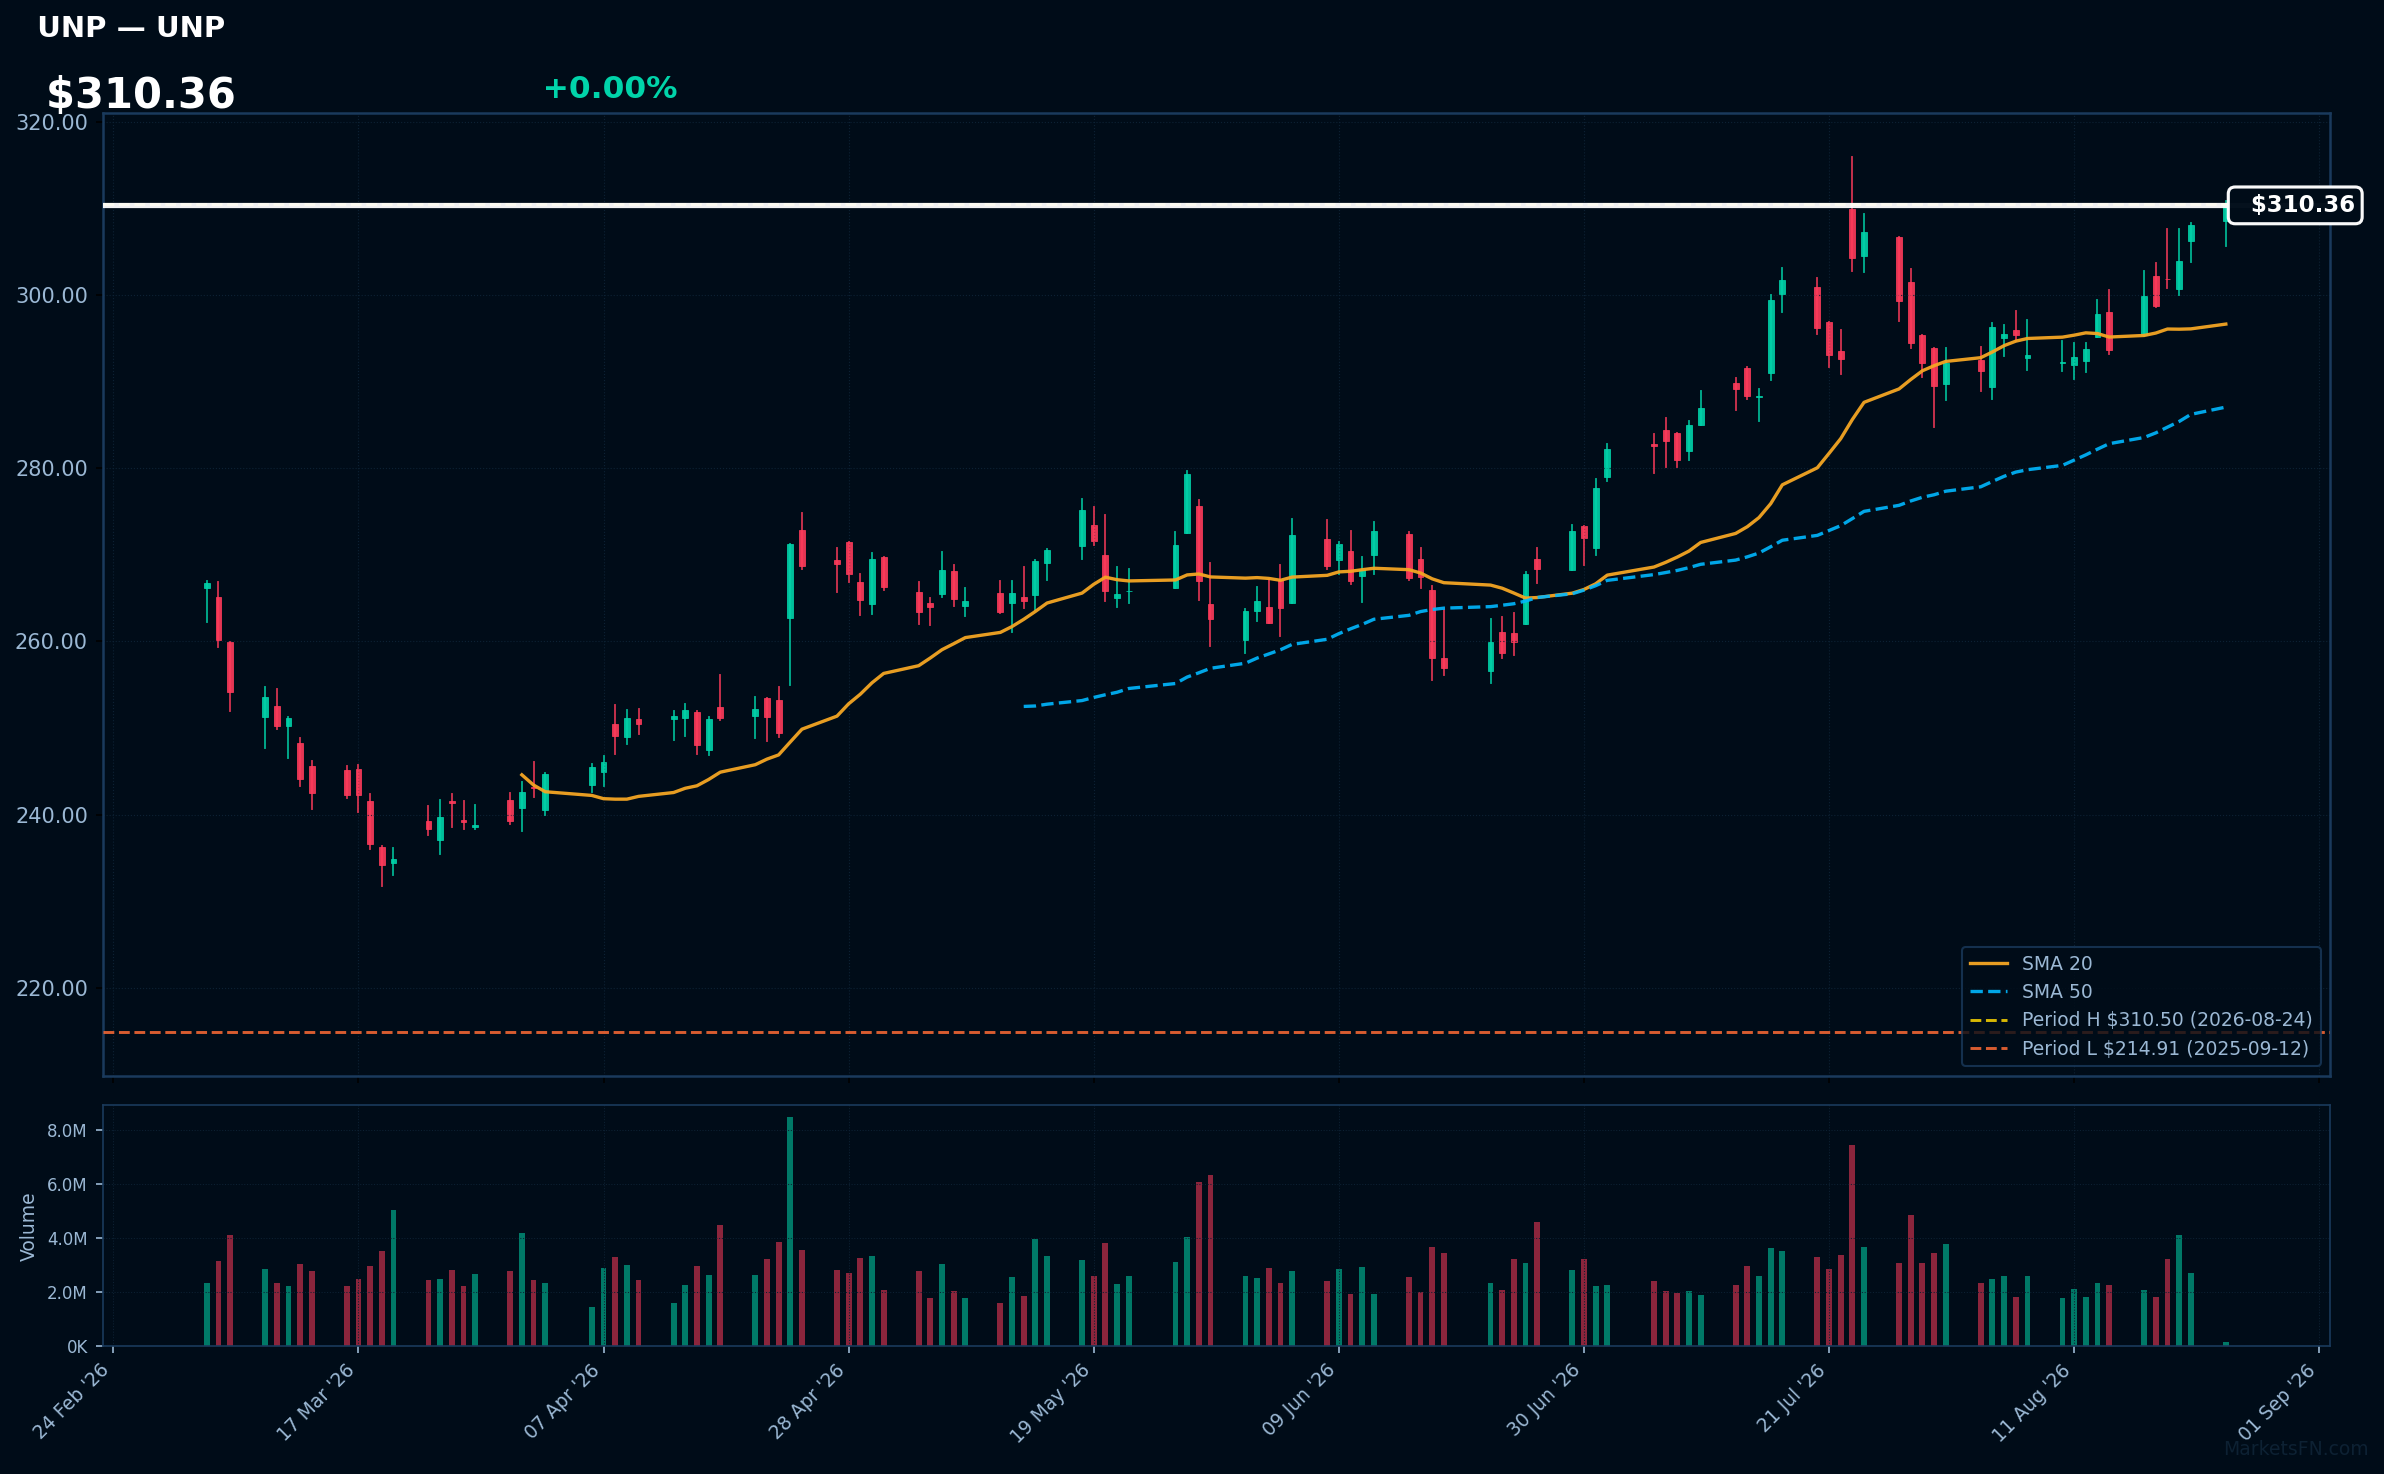
UNP | Union Pacific Corp | Industrials | Price Last: $310.50 | % Realized: +39.04% | RSI: 68.8 | % above MA200: +20.9% | Trend: Above MA20, MA50, MA200
Union Pacific Corp (UNP) operates a major freight railroad network in the western United States, transporting goods such as agricultural products, automotive, and industrial commodities. Investors should care due to its critical role in supply chain logistics and economic growth.
The current technical situation shows bullish momentum with an RSI(14) of 68.8 and a strong MA alignment: price > MA20 > MA50 > MA200. The stock is 0.0% below its 52-Week high, indicating a potential breakout.
Related headlines
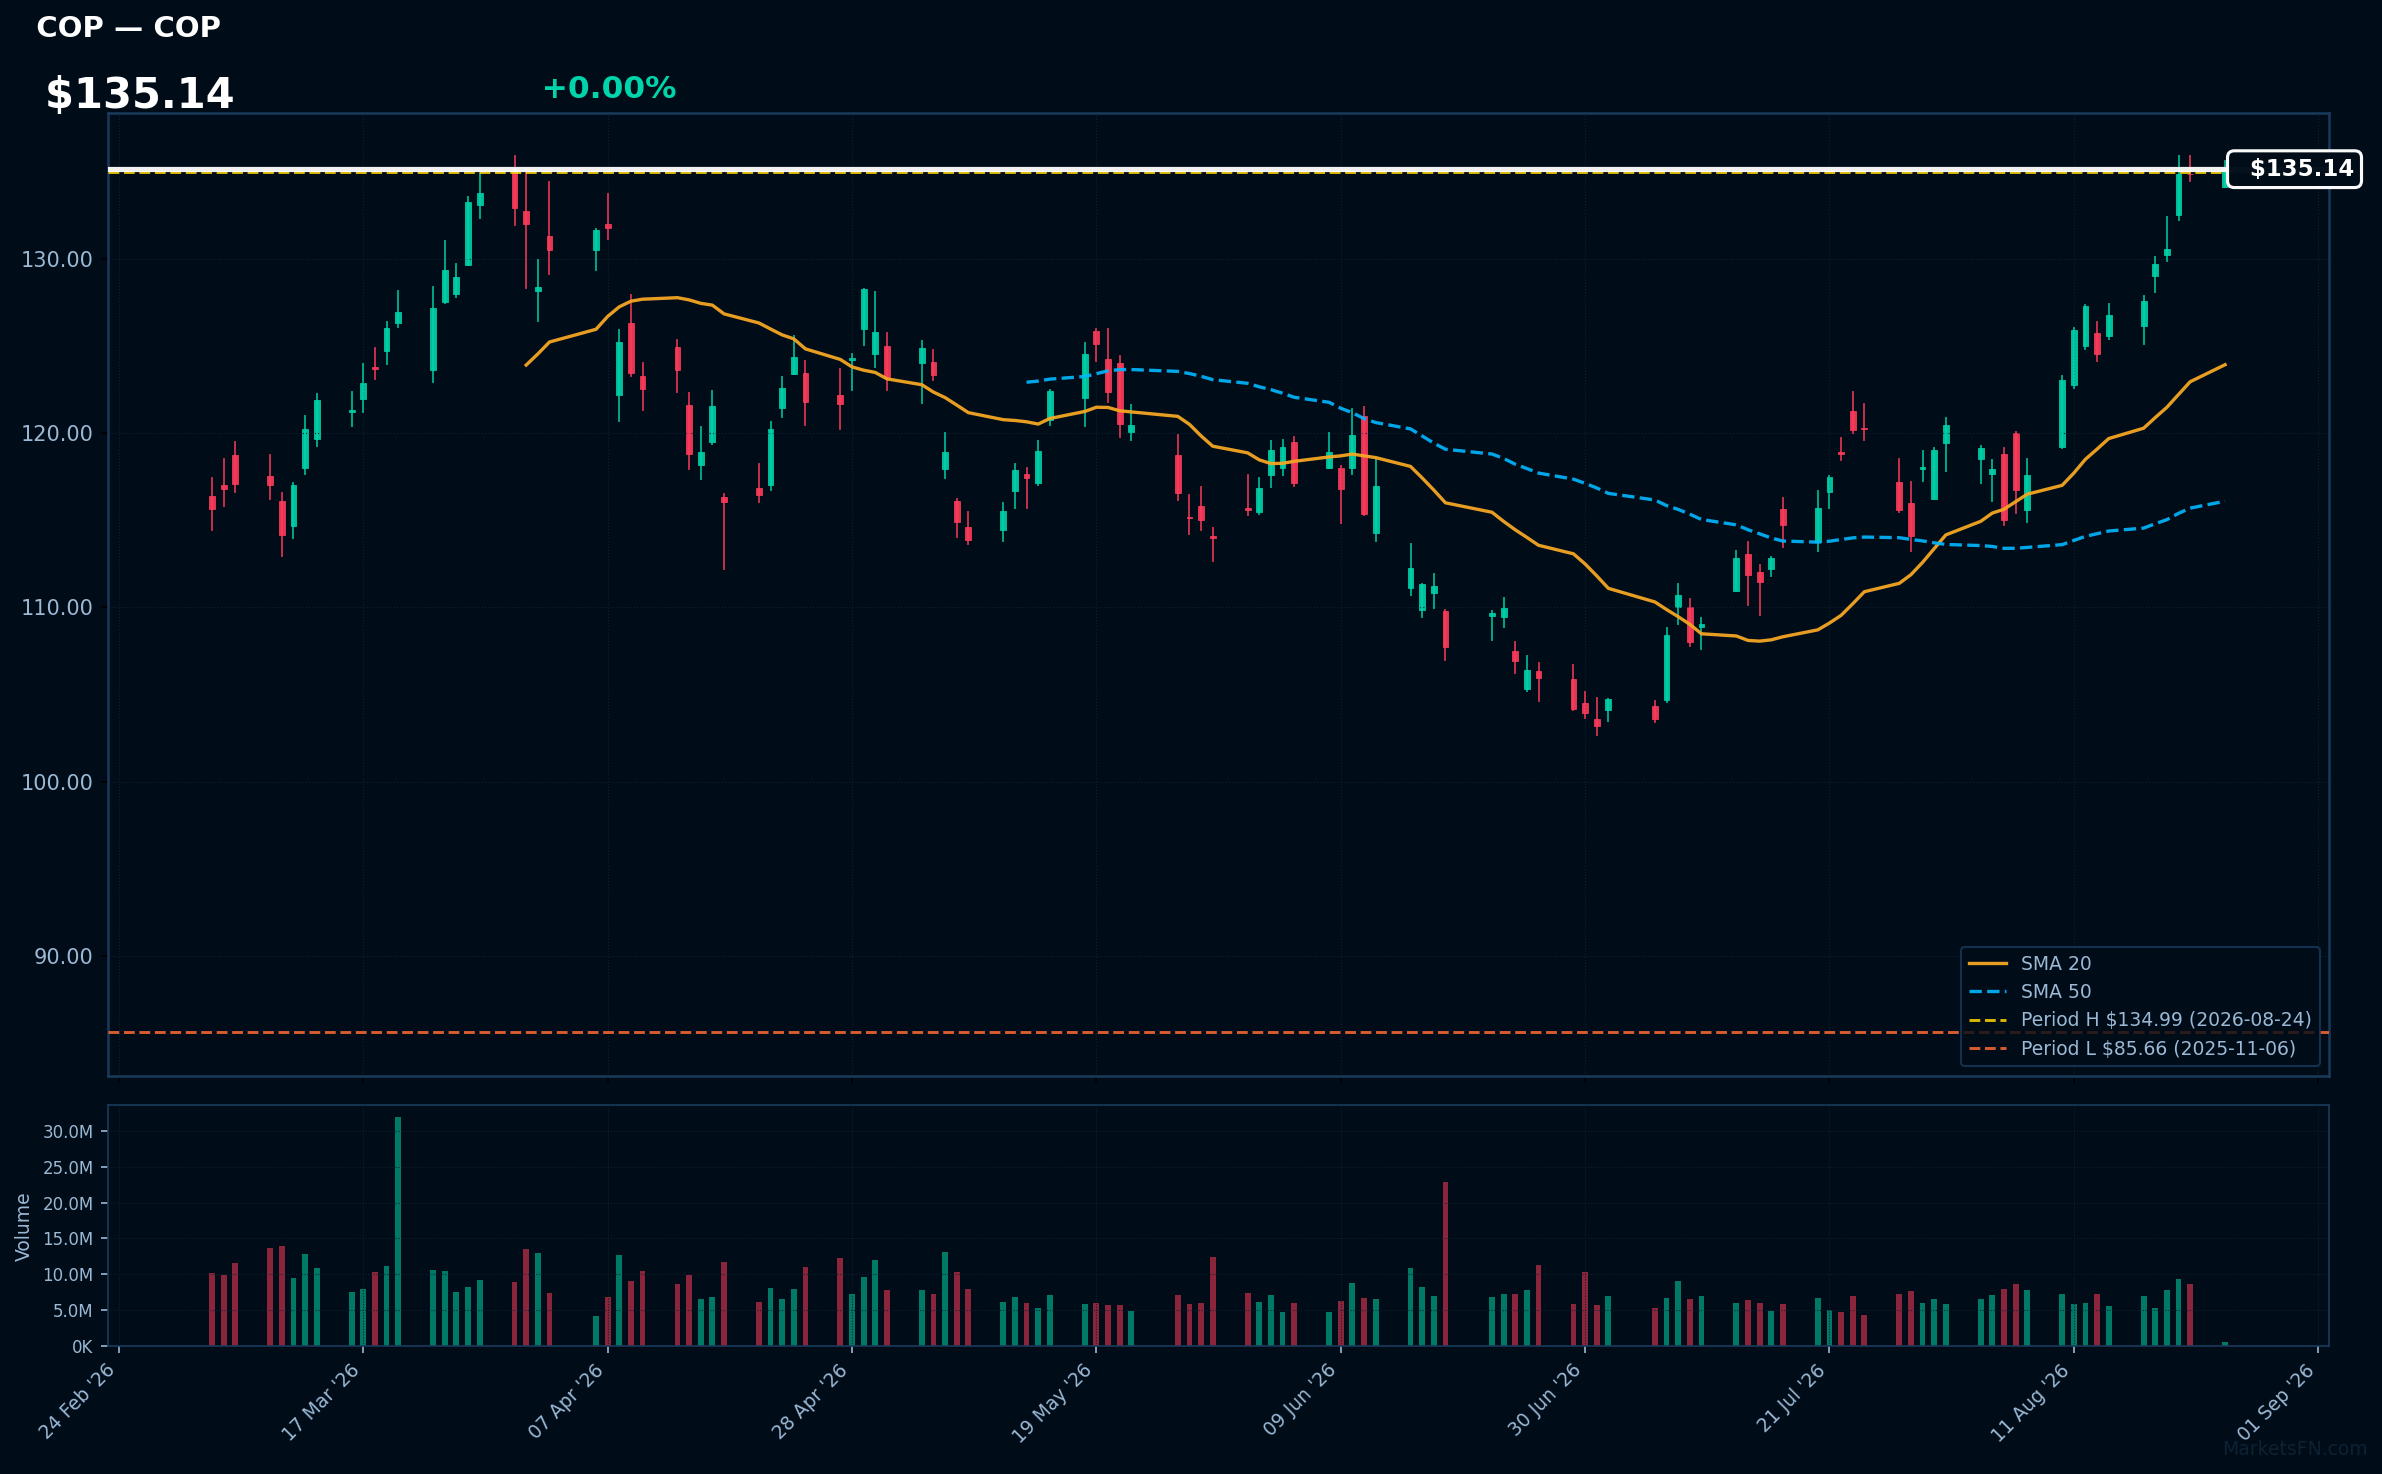
COP | Conoco Phillips | Energy | Price Last: $134.99 | % Realized: +37.50% | RSI: 74.2 | % above MA200: +21.9% | Trend: Above MA20, MA50, MA200
Conoco Phillips (COP) is a leading independent exploration and production company focused on oil and natural gas. Investors should care due to its significant role in energy markets and potential for strong returns amid fluctuating commodity prices.
The current technical situation shows bullish momentum with an RSI(14) of 74.2 and a bullish MA alignment: price > MA20 > MA50 > MA200. The stock is also 0.0% below its 52-Week high, indicating a potential breakout.
Related headlines
📉 Nearest to 52-Week Low
Sectors represented: Utilities (3), Industrials (2)
| Ticker | Company | Sector | Price Last | % Realized | 52-Week Low Date | RSI | % above MA200 | Trend |
|---|---|---|---|---|---|---|---|---|
| LHX | L3Harris Technologies Inc | Industrials | $264.44 | -4.25% | 2026-08-24 | 33.8 | -16.2% | Below MA20, MA50, MA200 |
| NRG | NRG Energy Inc | Utilities | $112.44 | -22.33% | 2026-08-24 | 38.0 | -24.6% | Below MA20, MA50, MA200 |
| LII | Lennox International Inc | Industrials | $402.49 | -29.45% | 2026-08-24 | 30.3 | -19.9% | Below MA20, MA50, MA200 |
| VST | Vistra Corp | Utilities | $135.00 | -28.98% | 2026-05-19 | 36.2 | -15.4% | Below MA20, MA50, MA200 |
| CMS | CMS Energy Corporation | Utilities | $68.53 | -5.11% | 2026-08-21 | 32.2 | -7.1% | Below MA20, MA50, MA200 |
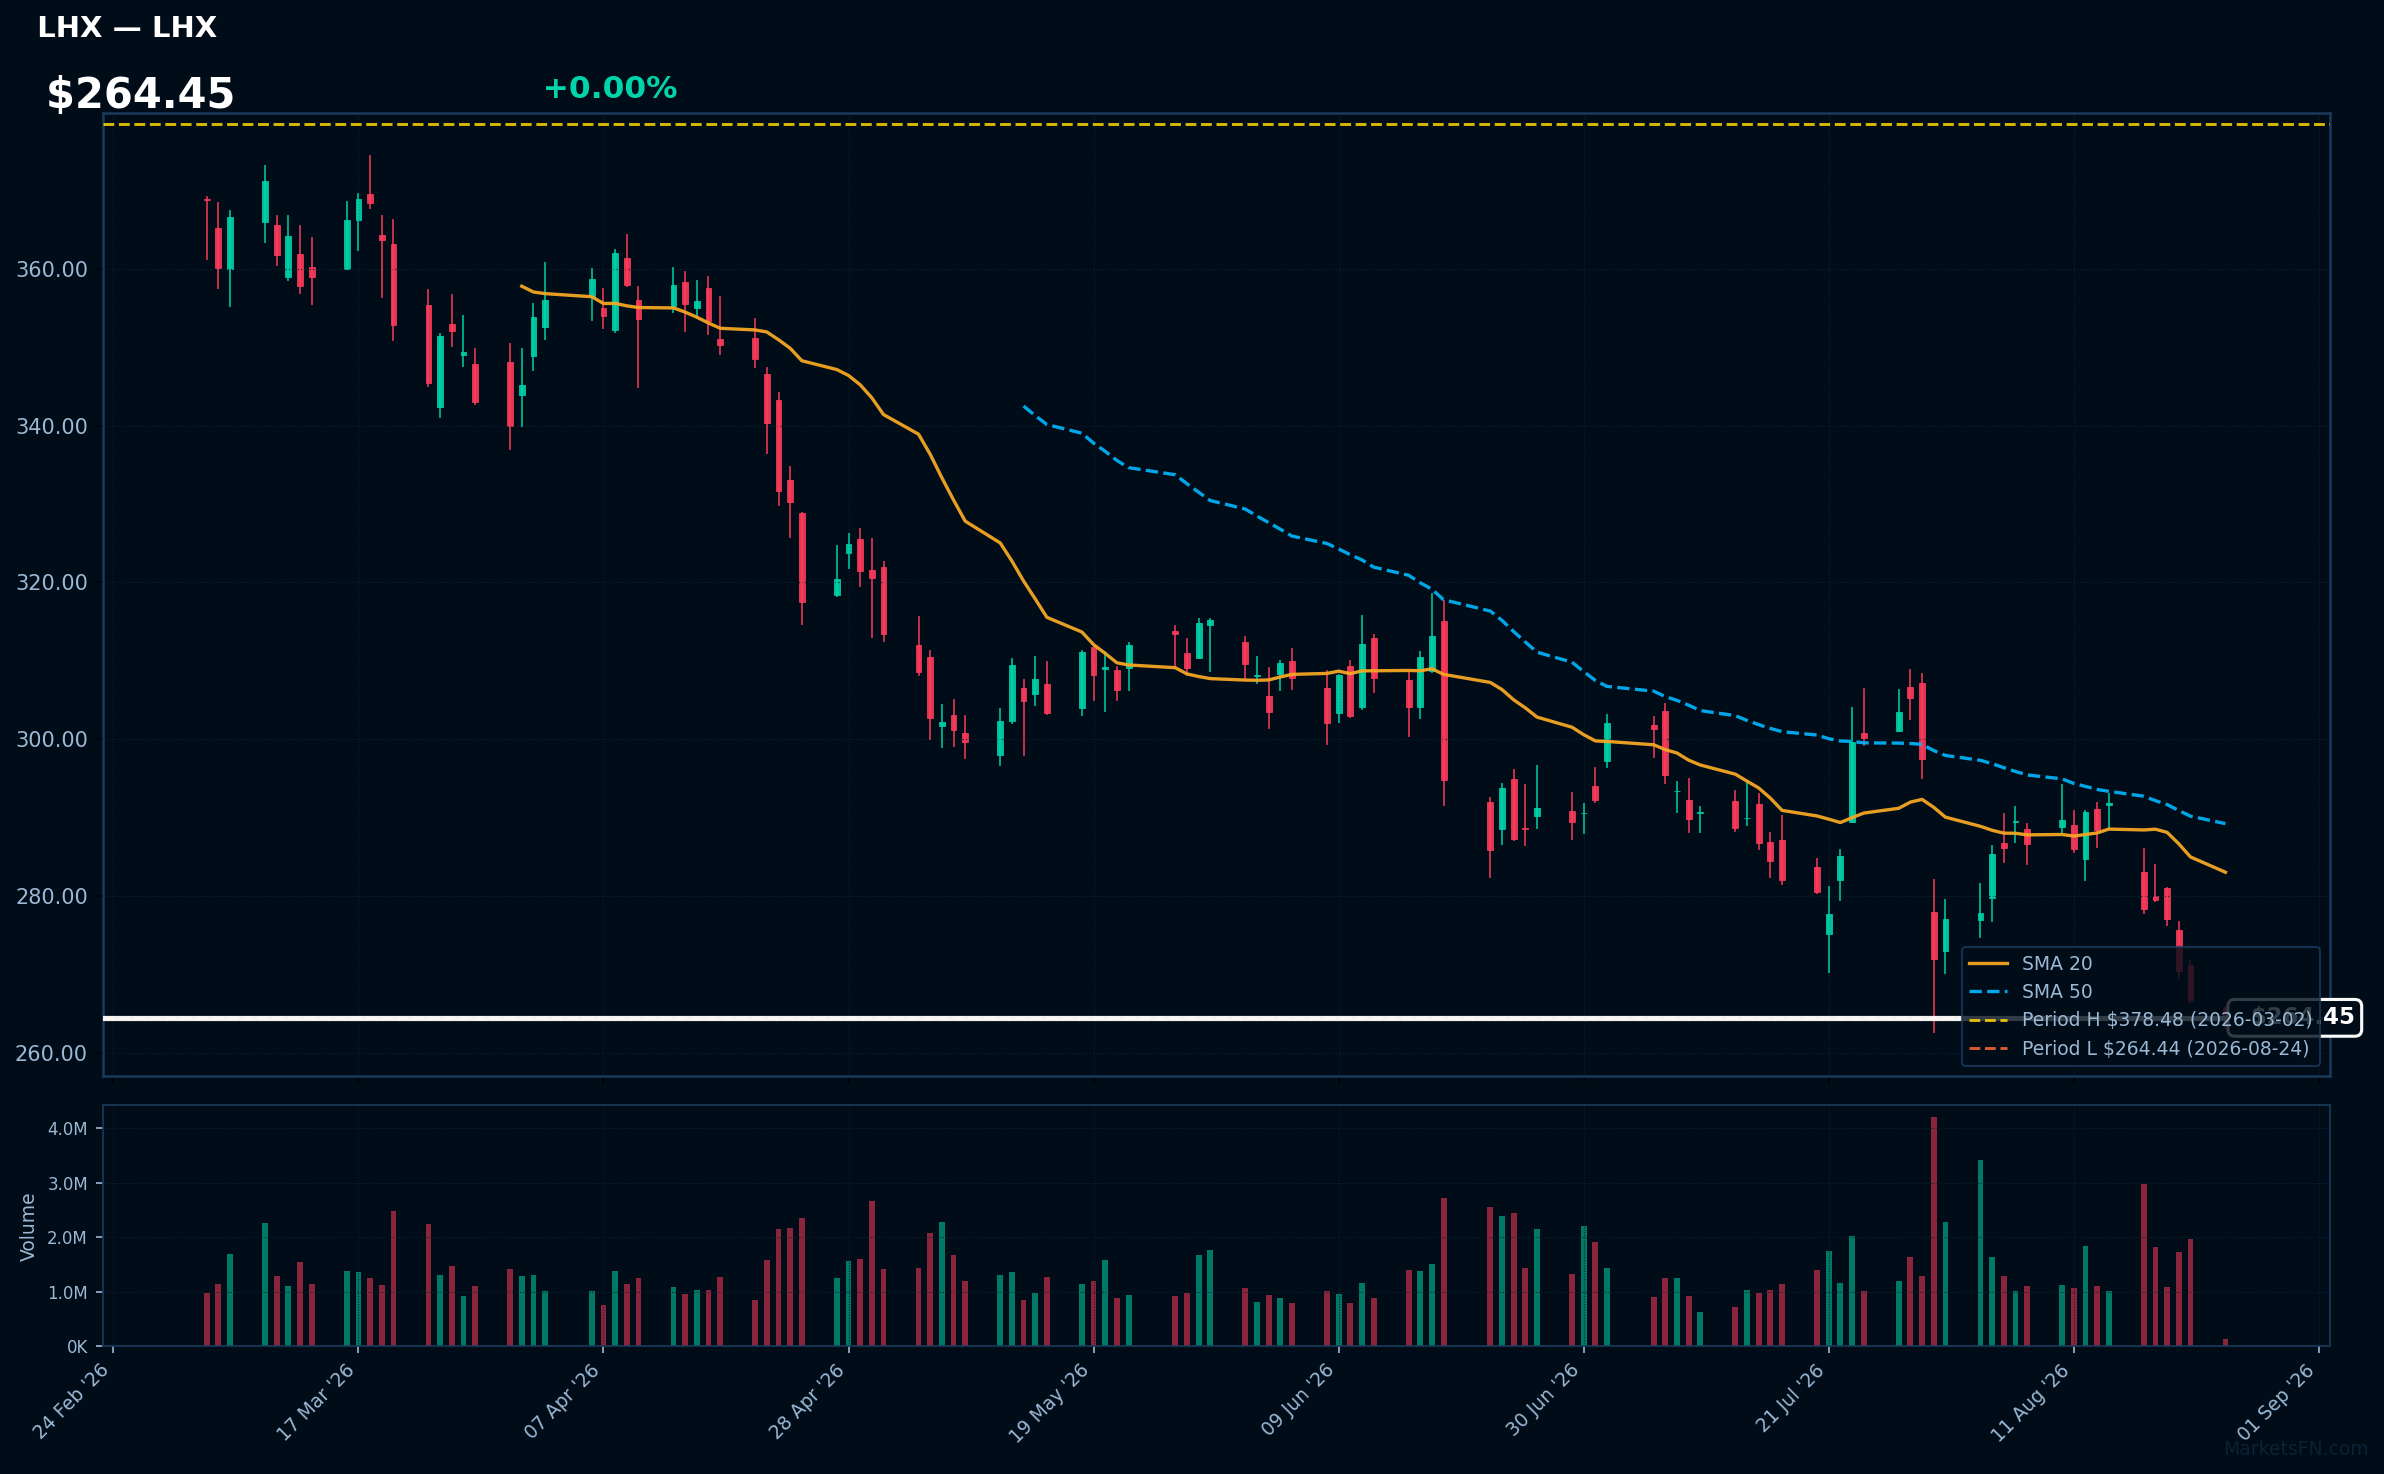
LHX | L3Harris Technologies Inc | Industrials | Price Last: $264.44 | % Realized: -4.25% | RSI: 33.8 | % above MA200: -16.2% | Trend: Below MA20, MA50, MA200
L3Harris Technologies Inc specializes in communication and electronic systems for government and commercial sectors, focusing on defense, aerospace, and public safety. Investors should care due to its critical role in national security and technological advancements, which can drive future growth and stability.
The current technical situation indicates a bearish trend, with an RSI(14) of 33.8 and a MA alignment of price < MA20 < MA50 < MA200, suggesting sustained downtrend and potential warning signs for investors.
Related headlines
- Women at L3Harris Shared Concerns About CEO's Behavior Years Before Ouster
- L3Harris Demonstrates Multi-Domain Supremacy at Annual Project Convergence Exercise
- L3Harris fires CEO Chris Kubasik after conduct investigation
- Ousted L3Harris CEO Chris Kubasik forfeits $45 millionbut hell still walk away with $80 million in stock and options
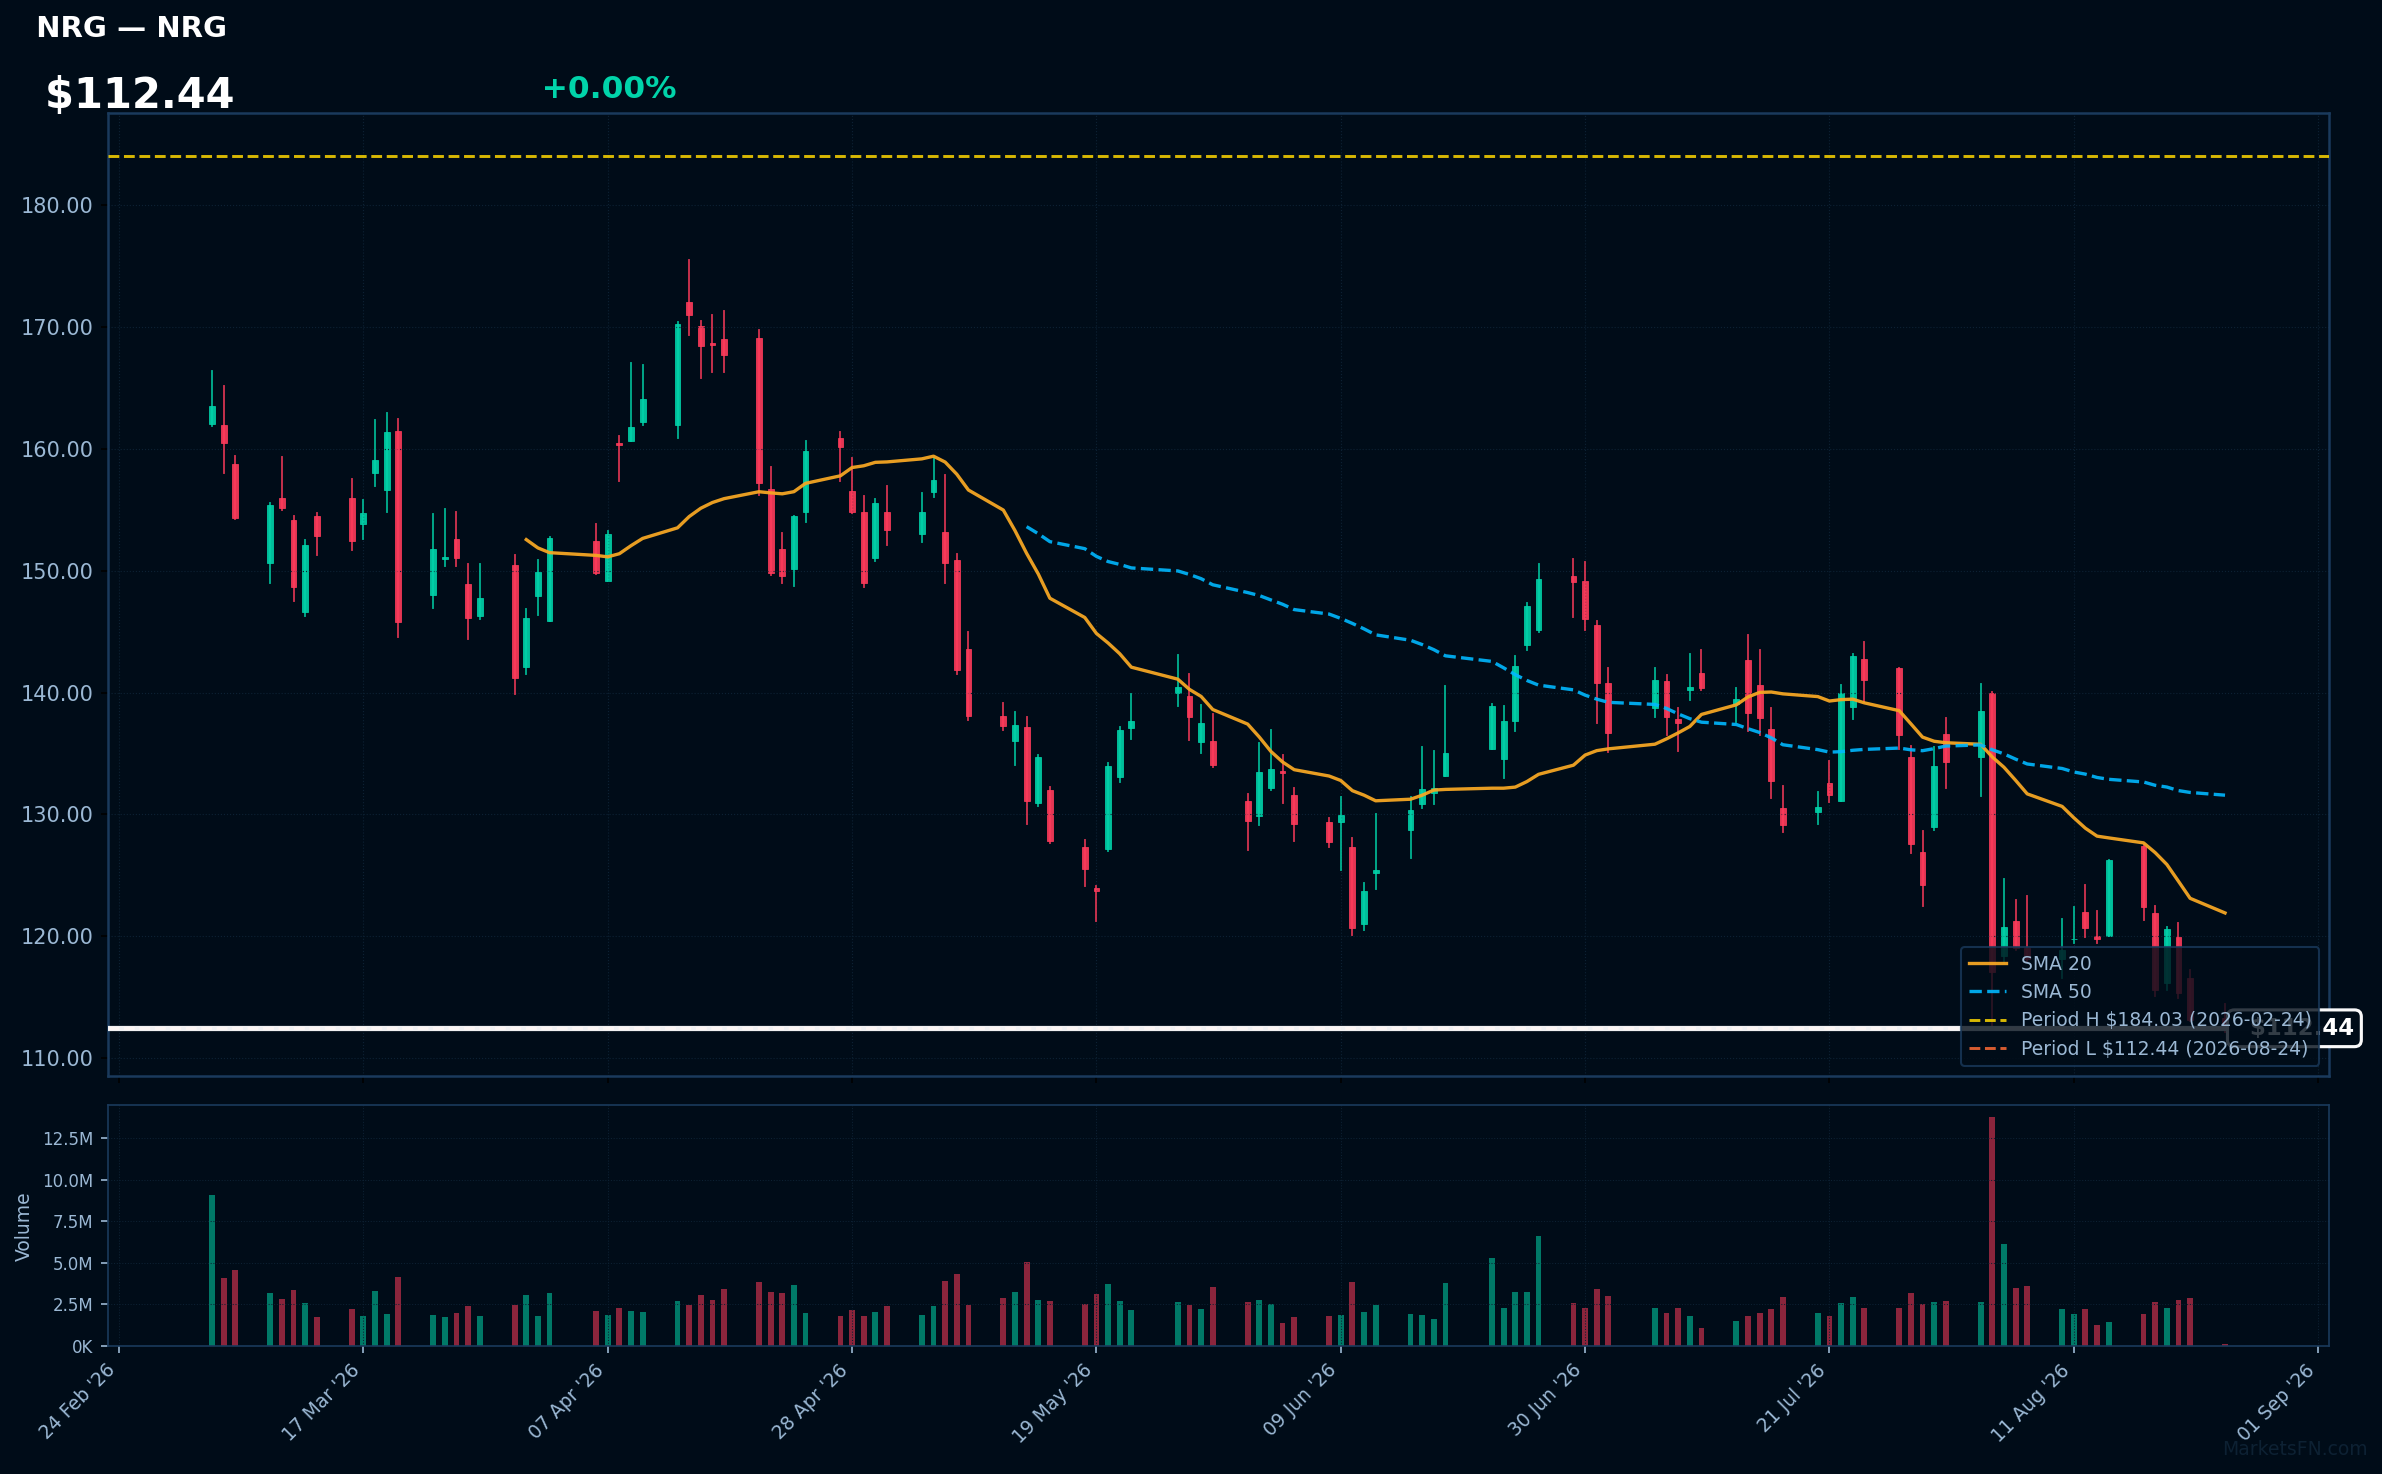
NRG | NRG Energy Inc | Utilities | Price Last: $112.44 | % Realized: -22.33% | RSI: 38.0 | % above MA200: -24.6% | Trend: Below MA20, MA50, MA200
NRG Energy Inc is a leading integrated power company that provides energy and related services to customers across the U.S. Investors should care due to its significant role in the energy market and potential impacts from regulatory changes and shifts in energy demand.
The current technical situation indicates a bearish trend, with an RSI(14) of 38.0 and a bearish MA alignment: price < MA20 < MA50 < MA200. The stock is testing major support, being only 0.0% above its 52-Week low.
Related headlines
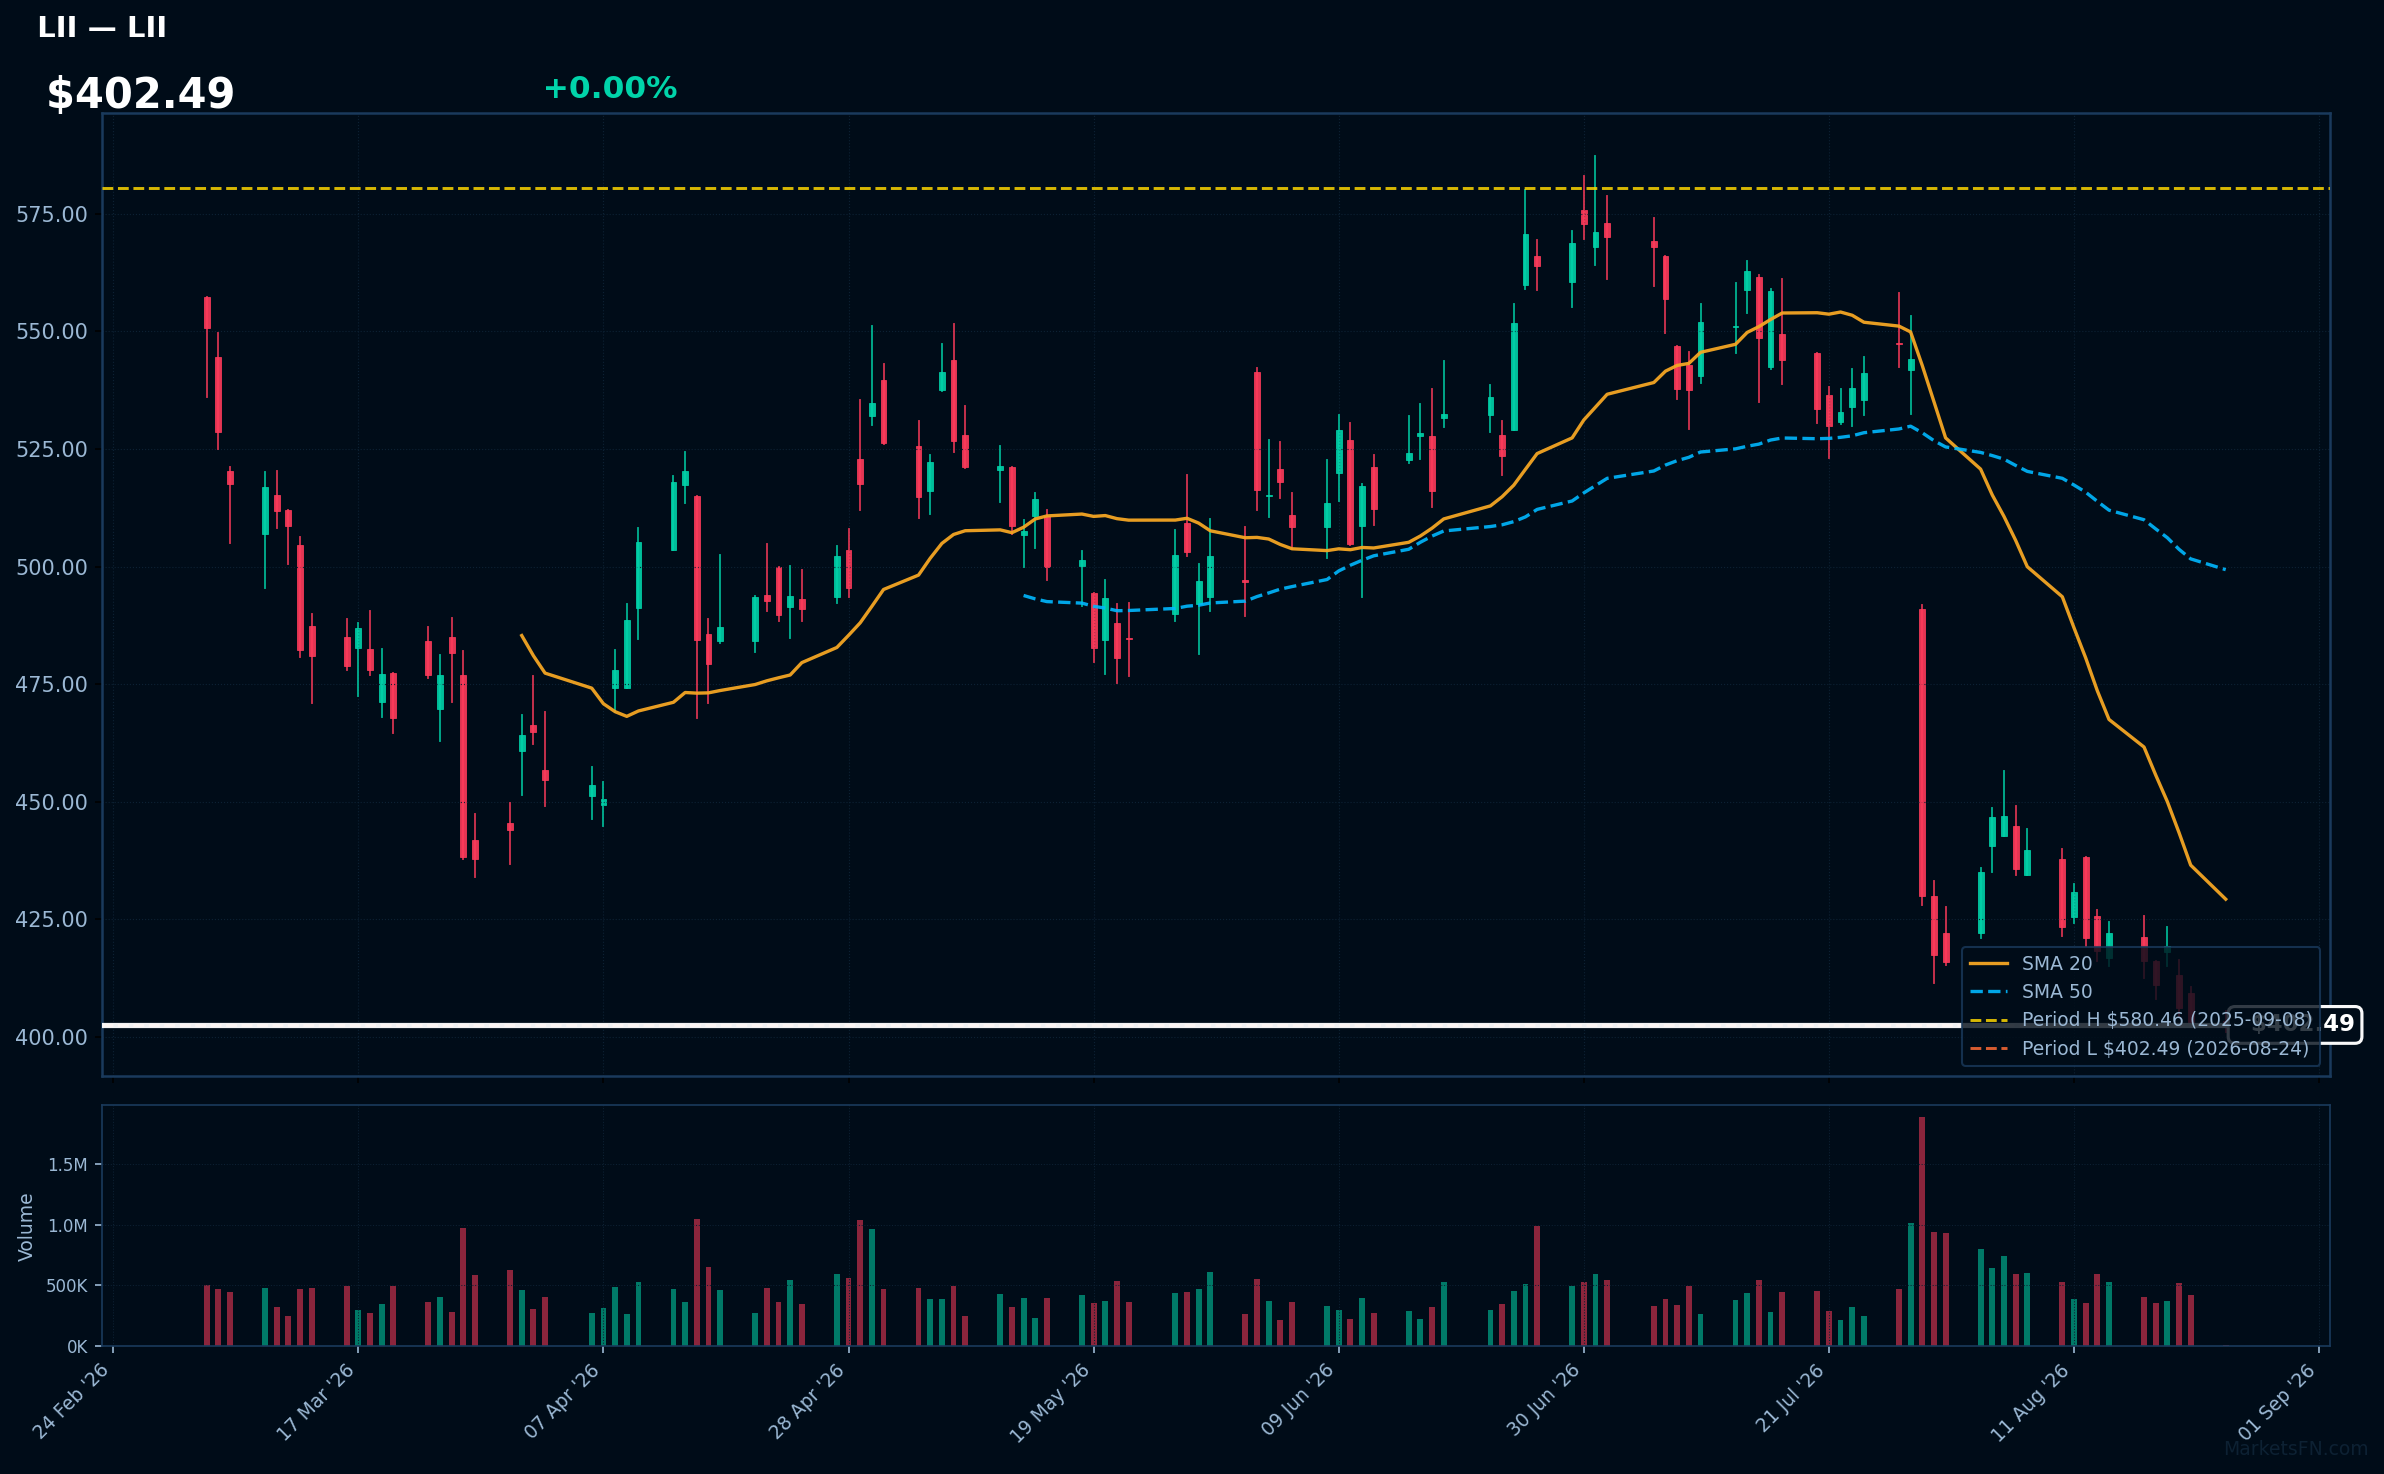
LII | Lennox International Inc | Industrials | Price Last: $402.49 | % Realized: -29.45% | RSI: 30.3 | % above MA200: -19.9% | Trend: Below MA20, MA50, MA200
Lennox International Inc designs and manufactures heating, ventilation, and air conditioning (HVAC) systems. Investors should care due to its significant role in the energy-efficient climate control market, which is increasingly relevant amid rising energy costs and environmental regulations.
The current technical situation indicates a bearish trend, with an RSI(14) of 30.3 and a MA alignment of price < MA20 < MA50 < MA200, suggesting sustained downtrend and potential warning signs for investors.
Related headlines
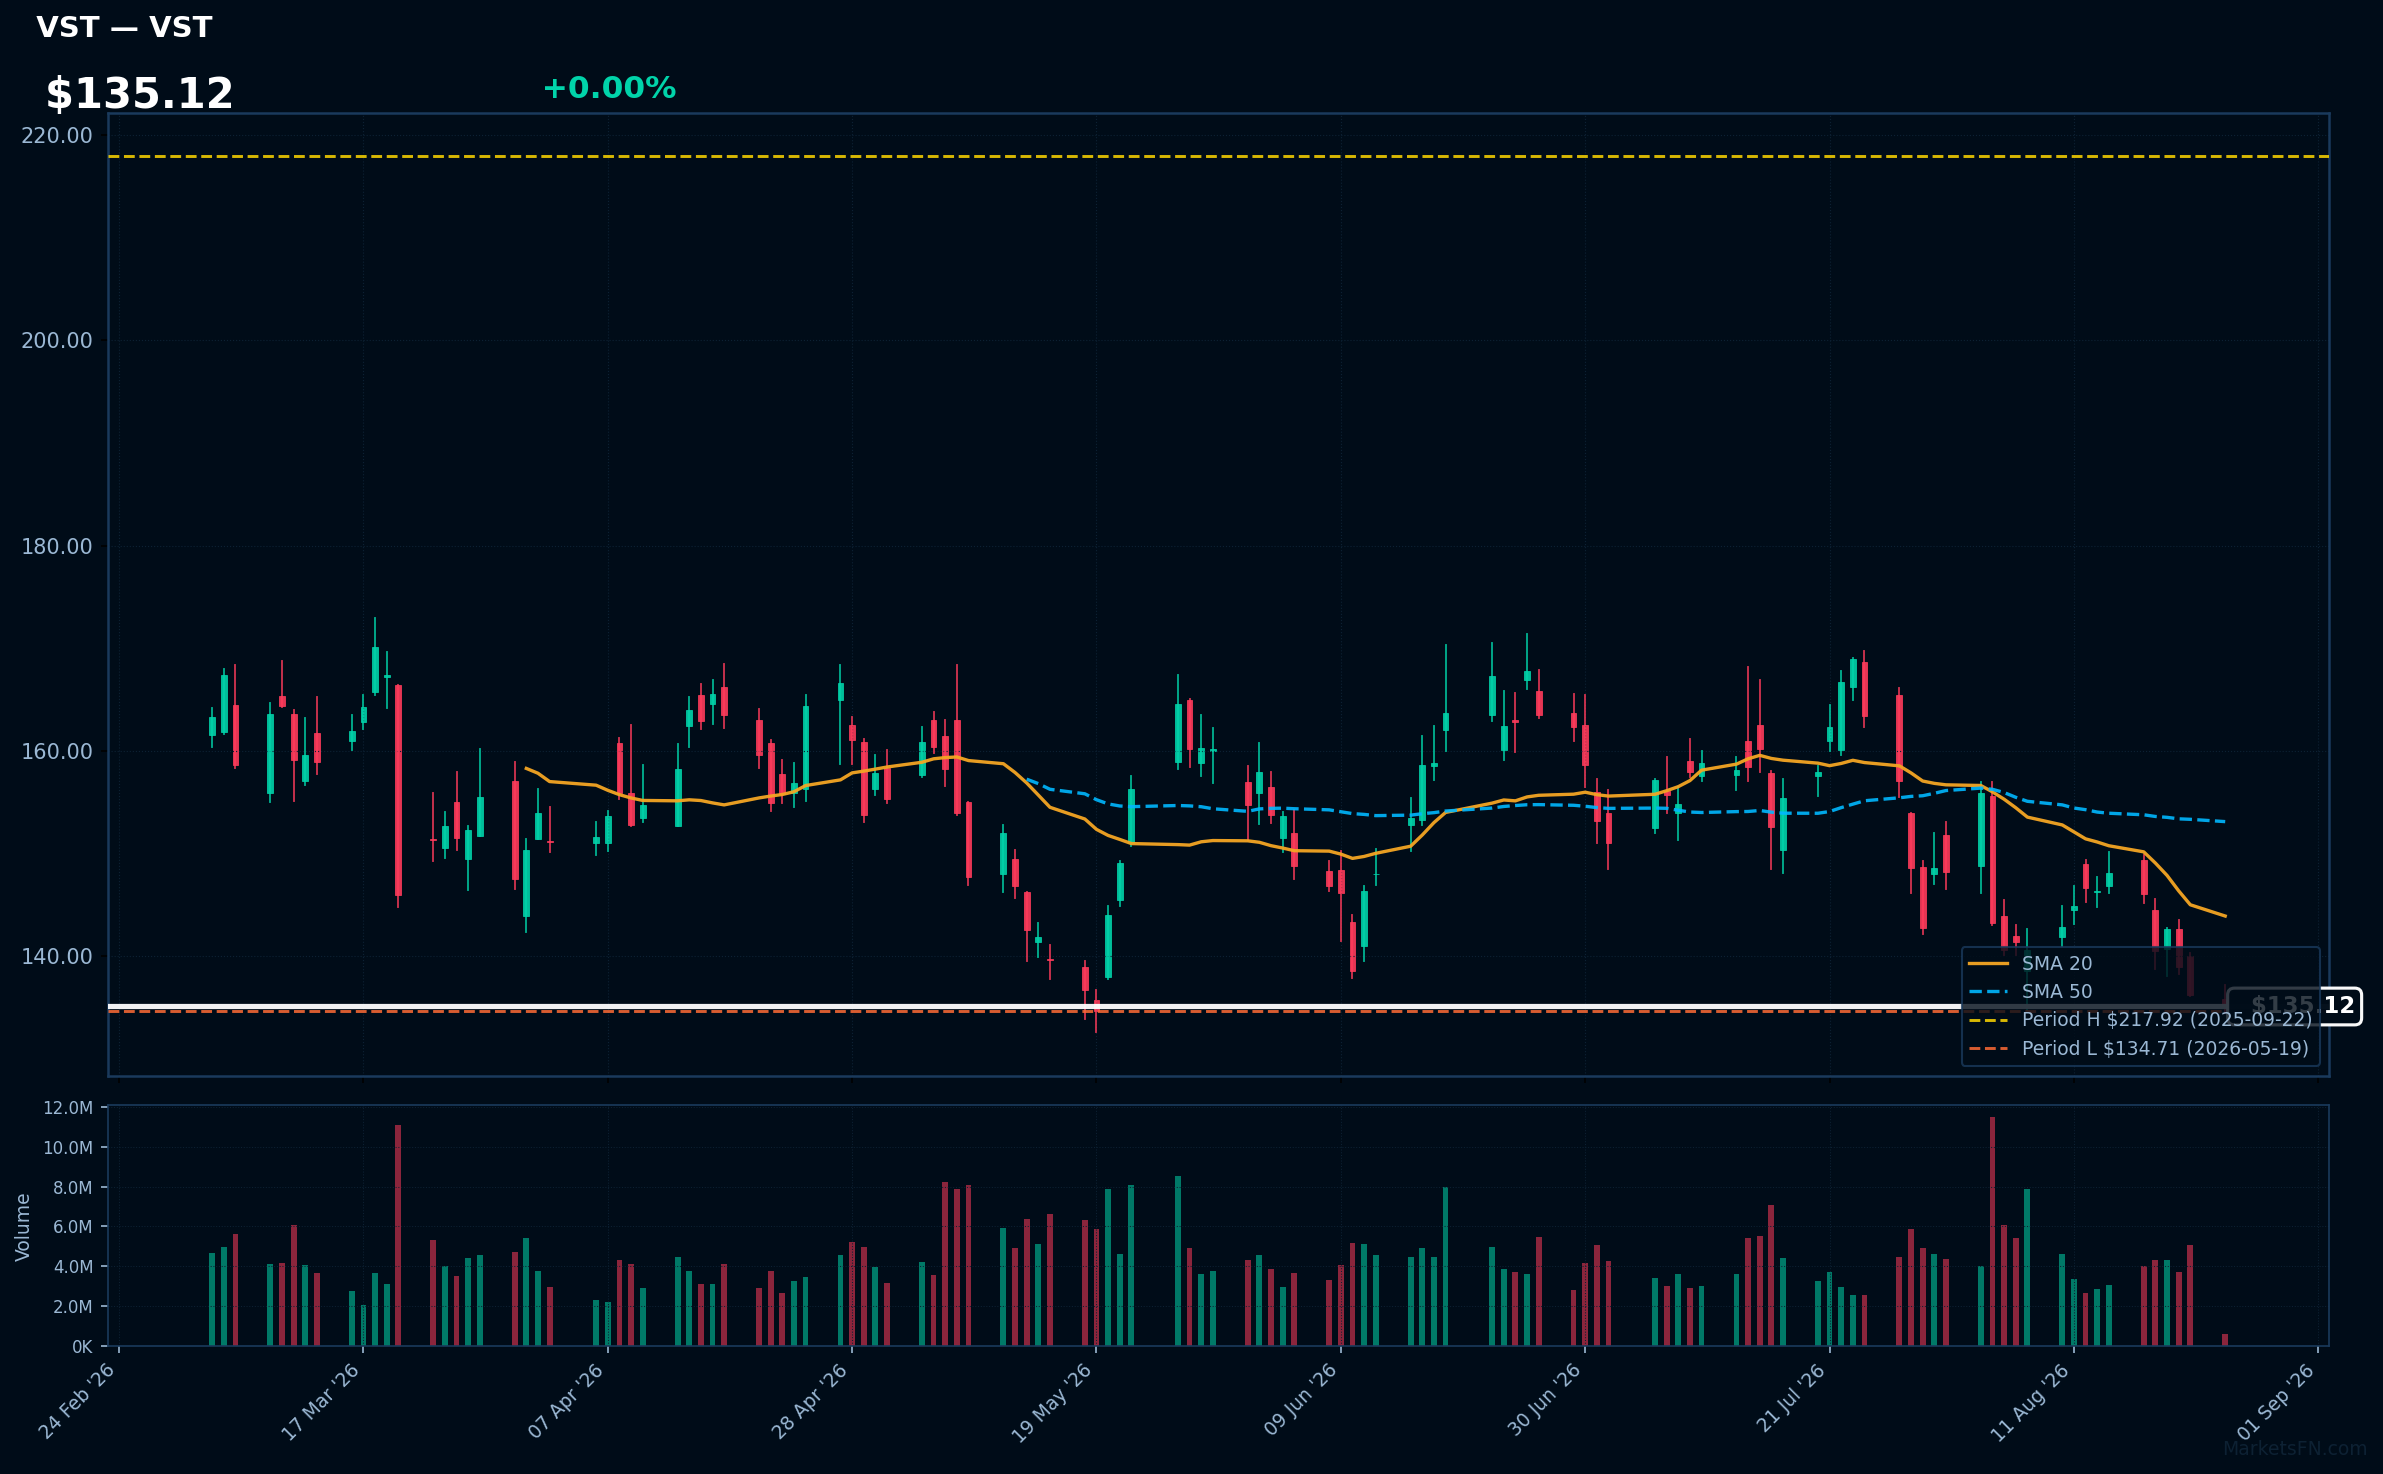
VST | Vistra Corp | Utilities | Price Last: $135.00 | % Realized: -28.98% | RSI: 36.2 | % above MA200: -15.4% | Trend: Below MA20, MA50, MA200
Vistra Corp (VST) is a leading energy company that generates and sells electricity, primarily from natural gas and renewable sources. Investors should care due to its significant role in the energy market and potential impacts from regulatory changes and energy demand fluctuations.
The current technical situation indicates a bearish trend, with an RSI(14) of 36.2 and a bearish MA alignment: price < MA20 < MA50 < MA200. The stock is also 0.2% above its 52-Week low, testing major support.
Related headlines
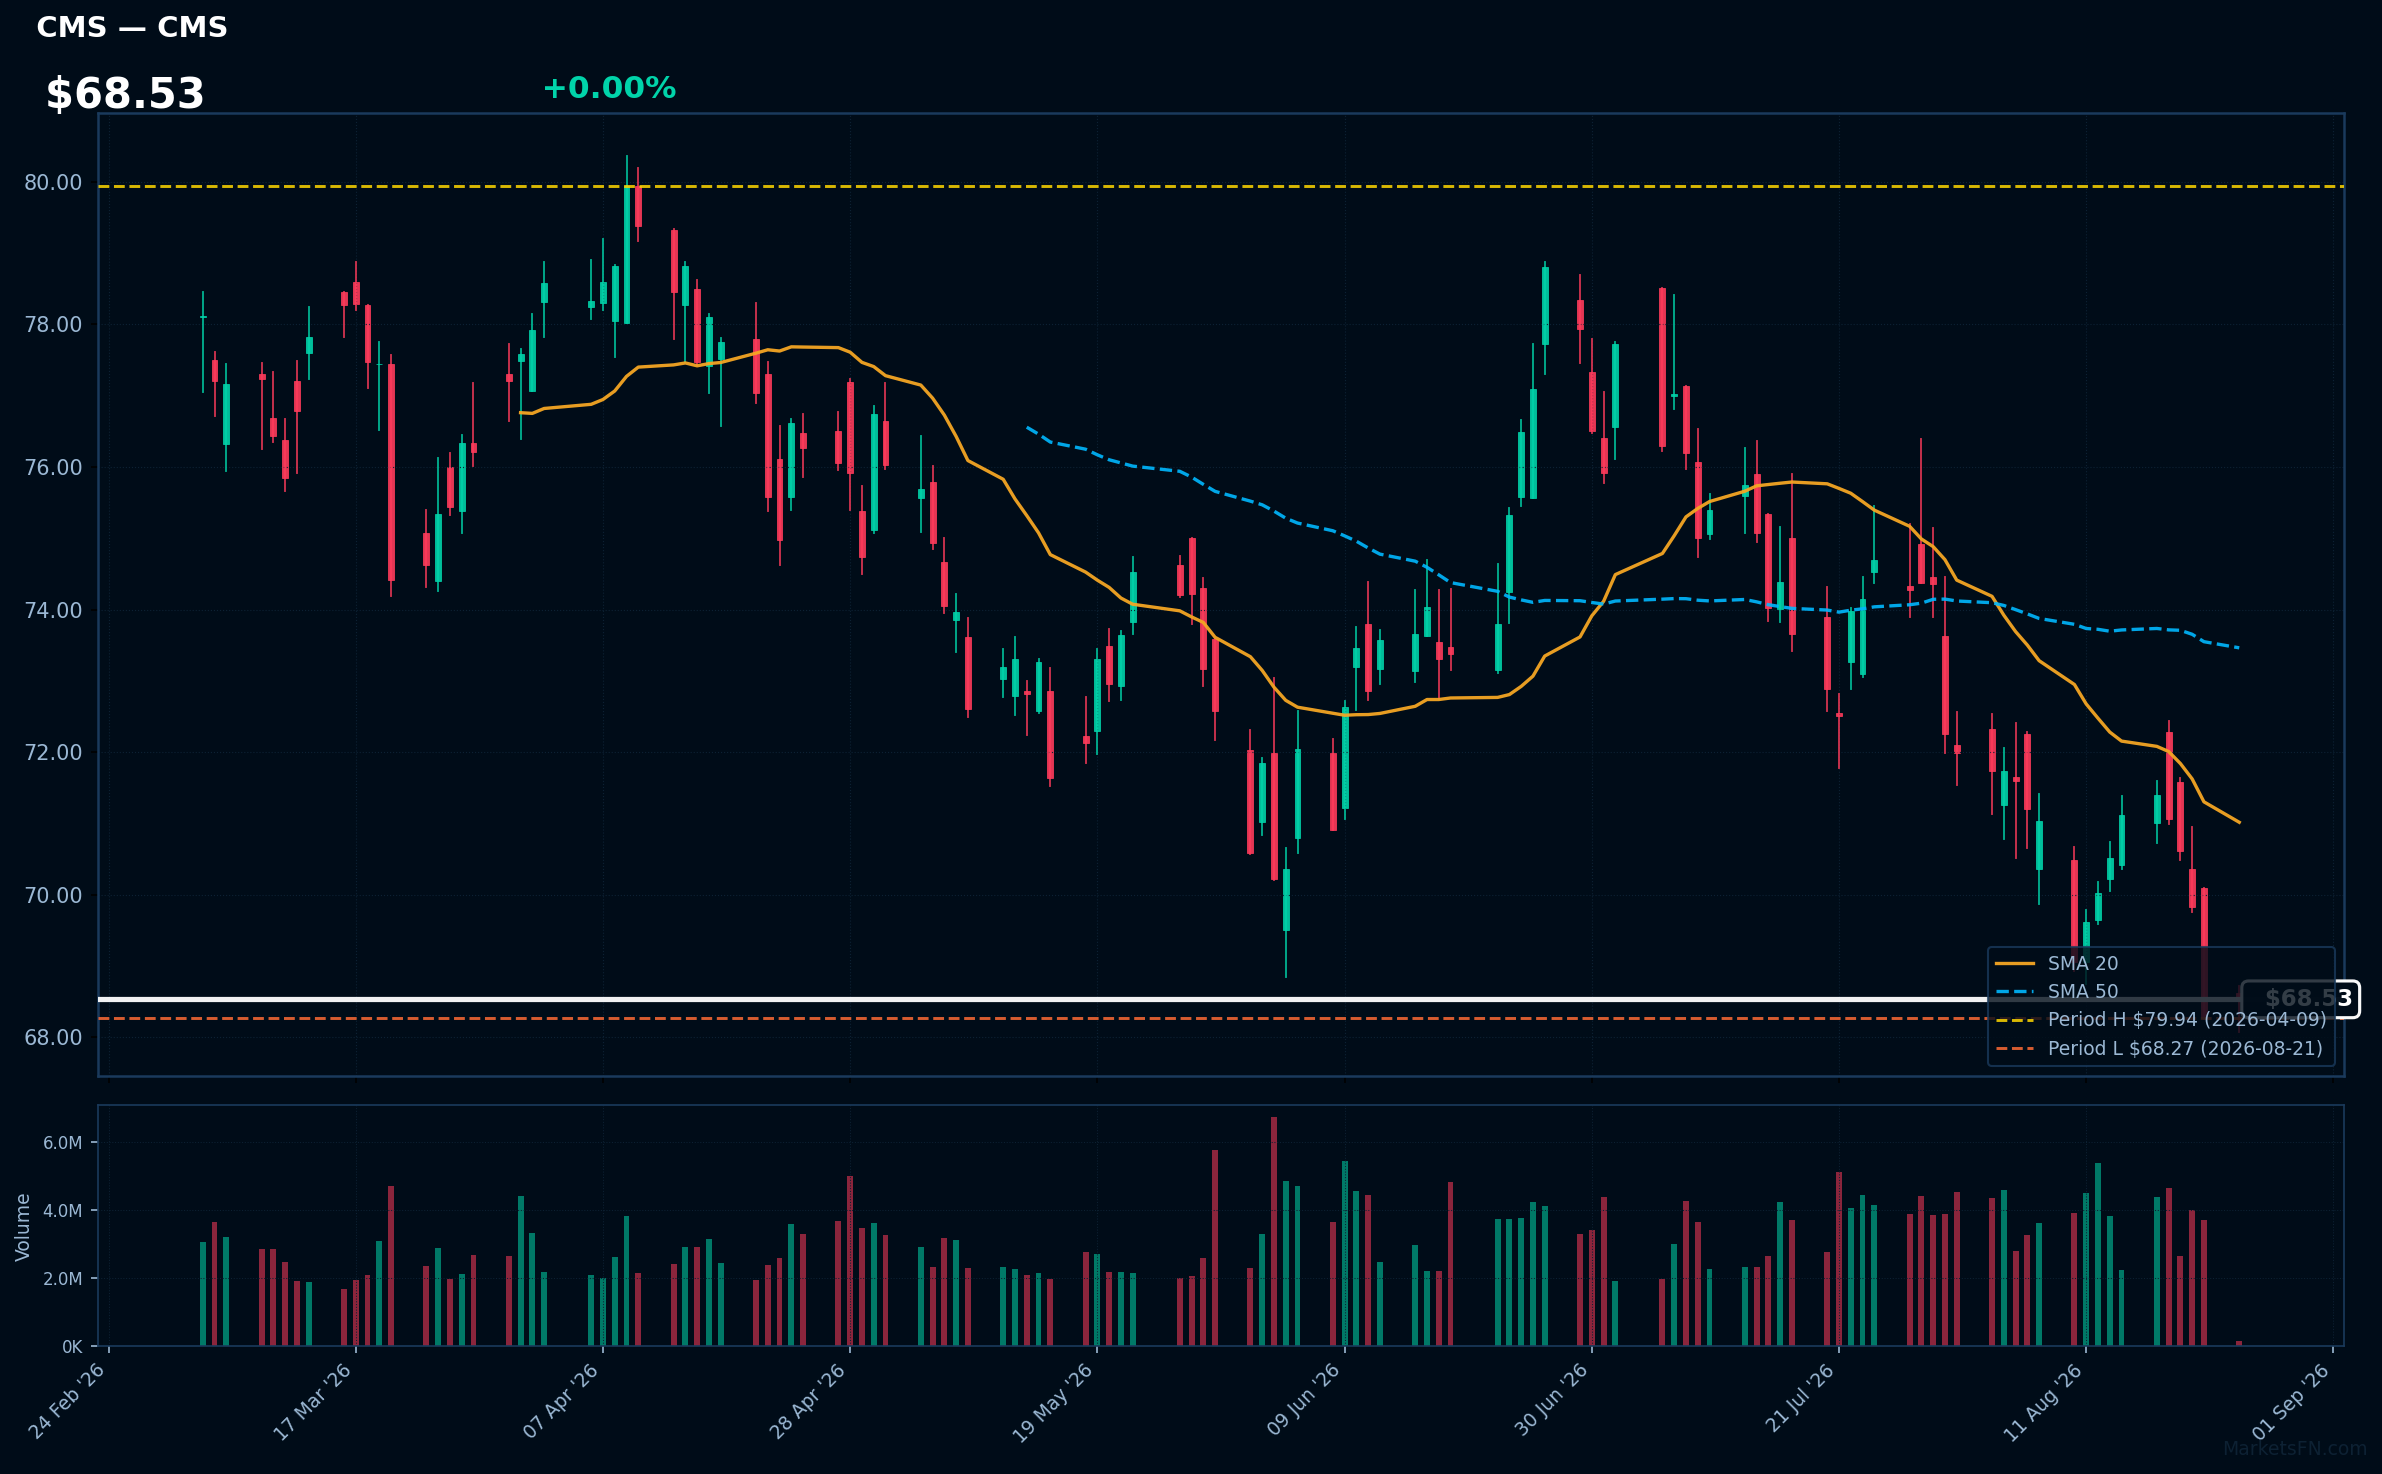
CMS | CMS Energy Corporation | Utilities | Price Last: $68.53 | % Realized: -5.11% | RSI: 32.2 | % above MA200: -7.1% | Trend: Below MA20, MA50, MA200
CMS Energy Corporation is a utility holding company that provides electric and natural gas services in Michigan. Investors should care due to its essential role in energy provision, regulatory environment impacts, and potential for stable dividends amidst market fluctuations.
The current technical situation indicates a bearish trend with an RSI(14) of 32.2 and a MA alignment of price < MA20 < MA50 < MA200, suggesting a sustained downtrend and testing major support just 0.4% above its 52-Week low.
Related headlines
- Why Did APP, CMS, MVIS Stocks Plunge To 52-Week Lows Last Week?
- Consumers Energy Invests in Reliability Upgrades to Secure the Grid for Michigan Customers
- Consumers Energy Secures Natural Gas System with Nearly 150 Miles of Upgrades Across Michigan
- Consumers Energy Foundation launches Community Impact Awards with Grants up to $20,000
Market Commentary
The presence of S&P 500 stocks near 52-week extremes indicates a significant divergence in market sentiment. Stocks like Visa Inc, Coca-Cola Co, Charles Schwab Corp, Union Pacific Corp, and Conoco Phillips are all at 0.0% from their 52-week highs, suggesting strong bullish momentum and investor confidence in these companies. Conversely, L3Harris Technologies Inc, NRG Energy Inc, Lennox International Inc, Vistra Corp, and CMS Energy Corporation are hovering just above their 52-week lows, reflecting potential bearish sentiment and concerns about their respective sectors.
This divergence may be influenced by sector rotation, where investors shift their focus from growth-oriented sectors to more defensive or value-oriented stocks. Macro themes such as interest rate fluctuations, inflationary pressures, and geopolitical uncertainties could be driving these price levels. For instance, the stability of consumer staples like Coca-Cola contrasts with the volatility seen in energy and technology sectors, highlighting a cautious approach among investors.
Key levels to watch include the 52-week highs for the bullish stocks and the lows for the bearish ones. A breakout above these highs could signal further upside potential, while a drop below the lows may indicate deeper declines. Potential catalysts include upcoming earnings reports, economic data releases, and shifts in monetary policy that could influence market dynamics and investor sentiment.
Methodology: All 503 S&P 500 constituents screened. 52-week high = highest daily close over the past 252 trading days (approx. 1 year). 52-week low = lowest daily close over the same period. Distance = (current price / extreme − 1) × 100. Technical indicators computed on up to 1 year of daily OHLCV data.
Disclaimer: For informational purposes only. Not investment advice. Past performance is not indicative of future results.