S&P 500 52-Week Highs & Lows Radar: Thermo Fisher Scientific (TMO), McDonald's (MCD) and more
MarketsFN Team

S&P 500 52-Week Highs & Lows Radar: Thermo Fisher Scientific (TMO), McDonald's (MCD) and more
Screening all 503 S&P 500 constituents for stocks nearest to their 52-week high and their 52-week low. Data as of September 16, 2026. % Realized = 52-week total return.
Legend: RSI > 70 = overbought · RSI < 30 = oversold · Green % Realized = positive 52W return · Red = negative.
📈 Nearest to 52-Week High
Sectors represented: Healthcare (3), Technology (1), Financial (1)
| Ticker | Company | Sector | Price Last | % Realized | 52-Week High Date | RSI | % above MA200 | Trend |
|---|---|---|---|---|---|---|---|---|
| TMO | Thermo Fisher Scientific Inc | Healthcare | $643.86 | +33.93% | 2026-09-16 | 67.9 | +19.8% | Above MA20, MA50, MA200 |
| DELL | Dell Technologies Inc | Technology | $569.58 | +346.10% | 2026-09-16 | 64.0 | +112.5% | Above MA20, MA50, MA200 |
| IQV | IQVIA Holdings Inc | Healthcare | $272.74 | +46.00% | 2026-09-16 | 68.4 | +34.2% | Above MA20, MA50, MA200 |
| DGX | Quest Diagnostics, Inc | Healthcare | $248.57 | +37.97% | 2026-09-16 | 66.0 | +22.6% | Above MA20, MA50, MA200 |
| PFG | Principal Financial Group Inc | Financial | $118.78 | +48.30% | 2026-09-16 | 63.9 | +18.8% | Above MA20, MA50, MA200 |
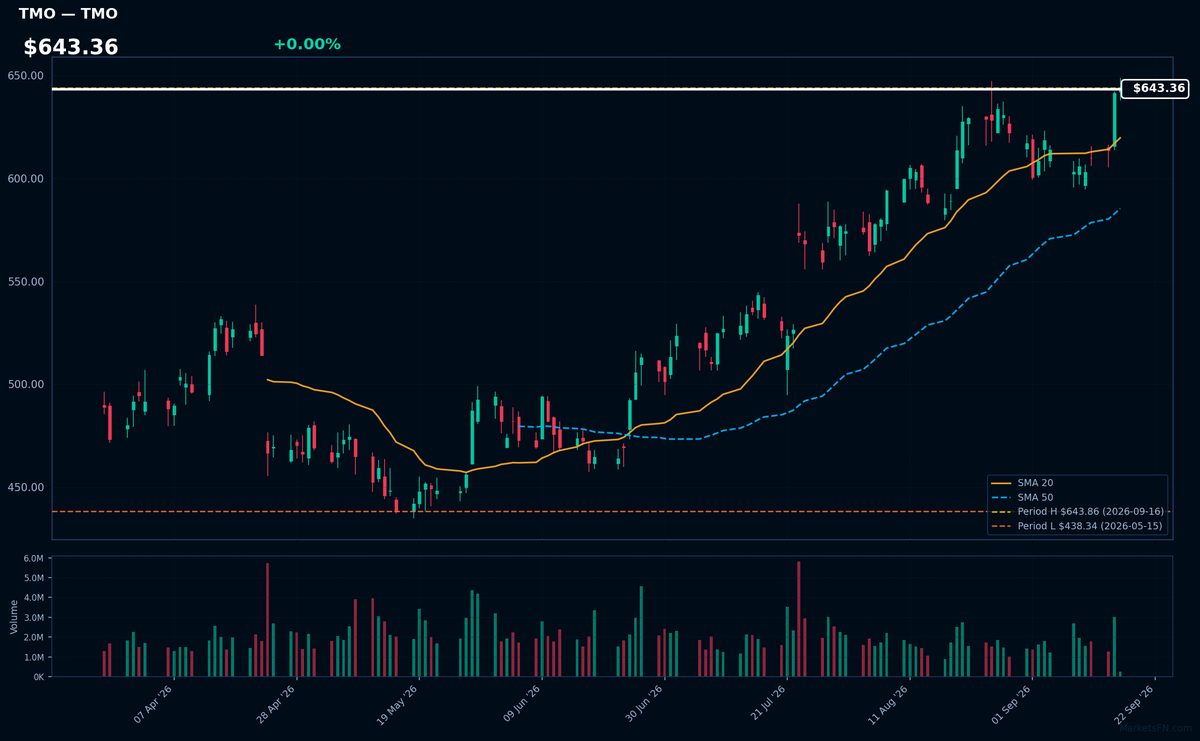
TMO | Thermo Fisher Scientific Inc | Healthcare | Price Last: $643.86 | % Realized: +33.93% | RSI: 67.9 | % above MA200: +19.8% | Trend: Above MA20, MA50, MA200
Thermo Fisher Scientific Inc is a life sciences and laboratory equipment company providing analytical instruments, laboratory equipment, and services to pharmaceutical, biotech, and research institutions, enabling them to advance scientific discovery and product development.
Thermo Fisher's current technical situation indicates sustained uptrend with price at $643.36, RSI(14) at 67.9, and MA alignment: price > MA20 > MA50 > MA200. It's near a potential breakout level, 0.0% below its 52-Week high, having returned 33.9% over the 52-Week period.
Related headlines
- Thermo Fisher CEO Says AI Will Drive More Pharma Spending Sees 7% Organic Growth By 2028
- Uber initiated, Thermo Fisher upgraded: Wall Street's top analyst calls
- Thermo Fisher Scientific to Present at the Morgan Stanley 24th Annual Global Healthcare Conference on September 15, 2026
- Top Research Reports for Amgen, Thermo Fisher & Pepsi
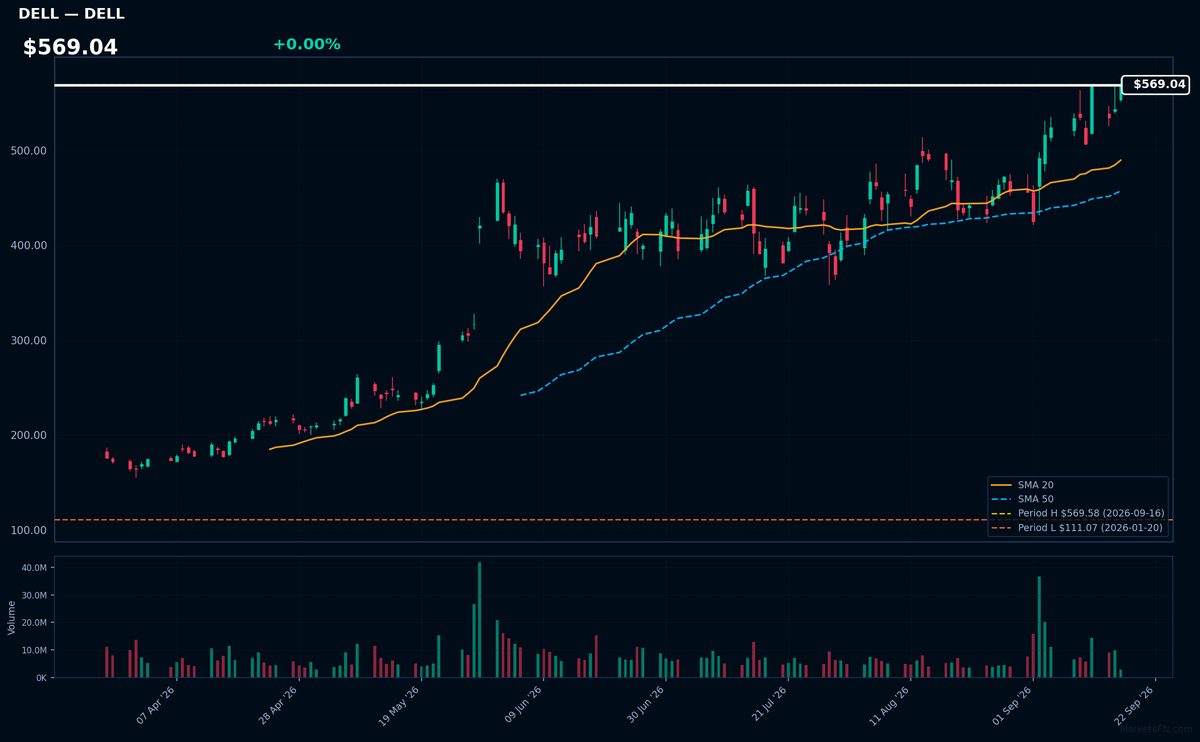
DELL | Dell Technologies Inc | Technology | Price Last: $569.58 | % Realized: +346.10% | RSI: 64.0 | % above MA200: +112.5% | Trend: Above MA20, MA50, MA200
Dell Technologies Inc is a technology company that provides a range of products and services including personal computers, data storage solutions, and IT infrastructure. Investors should care about its ability to innovate and adapt in a rapidly changing tech landscape.
Dell's current technical situation indicates strong momentum with an RSI(14) of 64.0 and a bullish MA alignment: price ($569.04) > MA20 > MA50 > MA200, suggesting a sustained uptrend. The stock is near its 52-Week high, 0.0% below, indicating a potential breakout level.
Related headlines
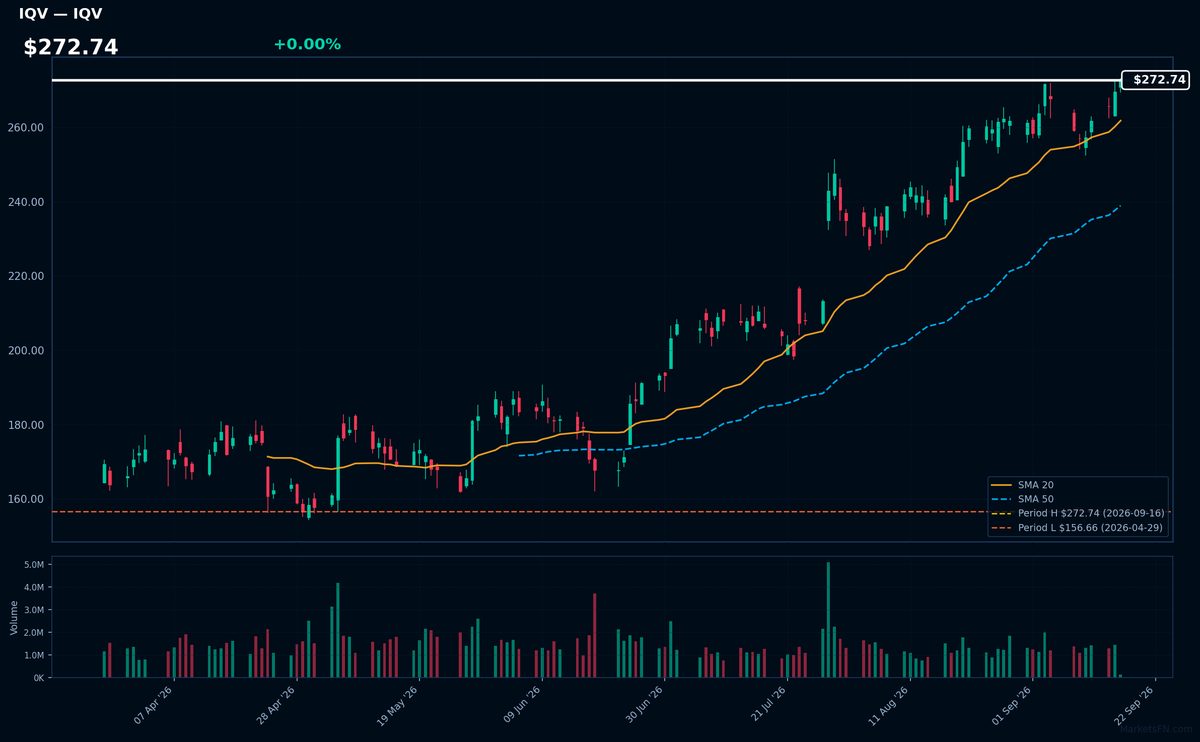
IQV | IQVIA Holdings Inc | Healthcare | Price Last: $272.74 | % Realized: +46.00% | RSI: 68.4 | % above MA200: +34.2% | Trend: Above MA20, MA50, MA200
IQVIA Holdings Inc provides advanced analytics, technology solutions, and contract research services to the healthcare industry, helping clients improve drug development, commercialization, and patient outcomes. Investors care due to its critical role in the pharmaceutical R&D ecosystem.
IQVIA's technicals indicate sustained uptrend with price at $272.74, RSI(14) at 68.4, and MA alignment: price > MA20 > MA50 > MA200. The stock is 0.0% below its 52-Week high, suggesting potential breakout momentum, with a 46.0% 52-Week return.
Related headlines
- IQVIA Announces Pricing of Senior Notes
- IQVIA Announces Offering of Senior Notes
- IQVIA's Predictive Clinical Development Provides Sponsors With Significant Efficiencies to Get Treatments to Market Faster
- IQVIA Wins Multiple Industry Awards for AI and Technology Innovation Across Life Sciences and Healthcare
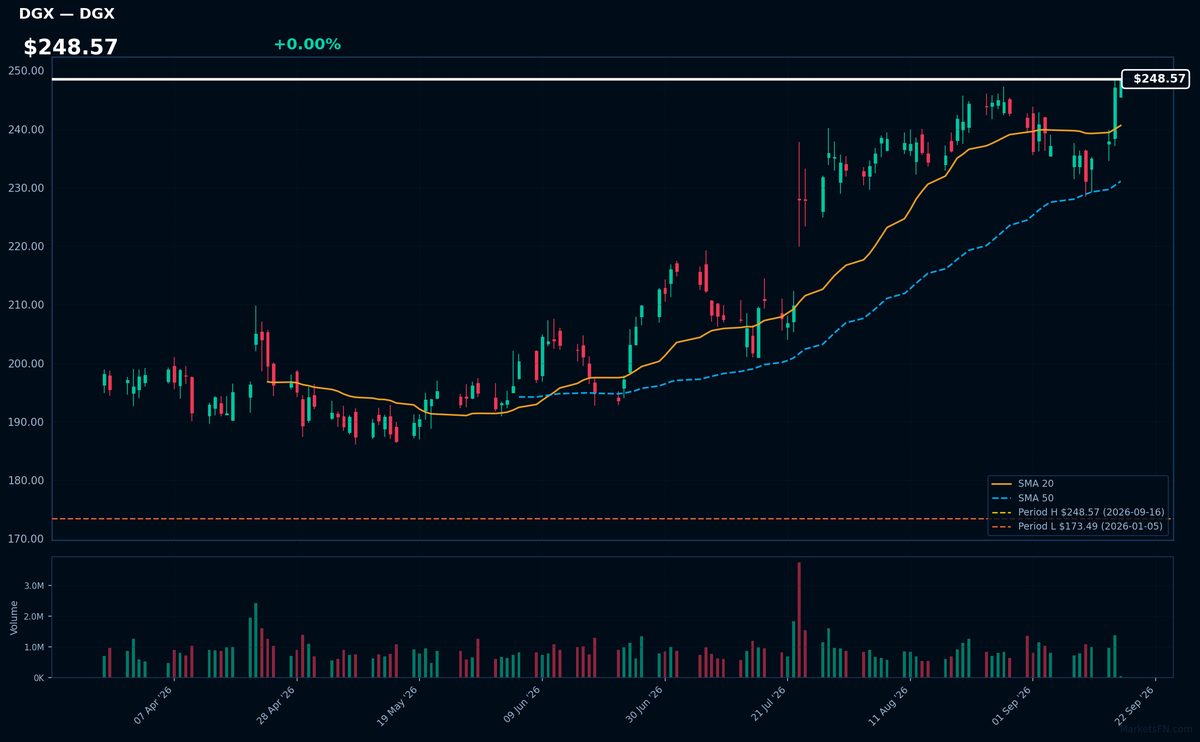
DGX | Quest Diagnostics, Inc | Healthcare | Price Last: $248.57 | % Realized: +37.97% | RSI: 66.0 | % above MA200: +22.6% | Trend: Above MA20, MA50, MA200
Quest Diagnostics, Inc is a leading provider of diagnostic testing, information, and services. Investors should care because its performance reflects healthcare industry trends and demand for diagnostic services, influencing revenue growth and profitability.
DGX is in a sustained uptrend with price > MA20 > MA50 > MA200, RSI(14) at 66.0, and is 0.0% below its 52-Week high, indicating strong momentum with no clear warning signs, having returned 38.0% over the 52-Week period.
Related headlines
- Nine in 10 Voters Express Concern That Medicare Lab Payment Cuts Will Harm Patient Access to Diagnostic Lab Testing, Finds National Survey from Quest Diagnostics
- Apple Health app Users to be Able to Order Labs from Quest Diagnostics
- Quest Diagnostics to Speak at the Baird 2026 Global Healthcare Conference
- Humanity Brings Biological Age Analysis to the U.S. Through questhealth.com
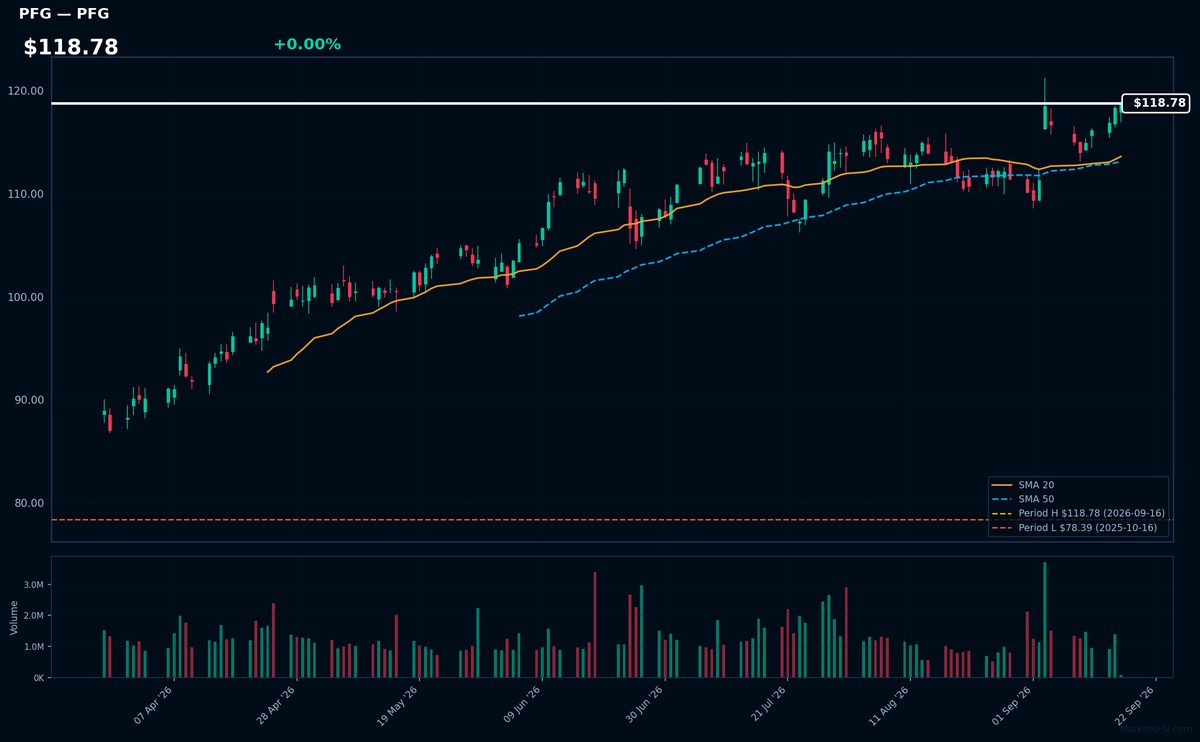
PFG | Principal Financial Group Inc | Financial | Price Last: $118.78 | % Realized: +48.30% | RSI: 63.9 | % above MA200: +18.8% | Trend: Above MA20, MA50, MA200
Principal Financial Group Inc is a life insurance and retirement services company. Investors should care because its performance reflects demand for retirement products and insurance, indicating its sensitivity to demographic trends and economic conditions.
The stock shows bullish MA alignment with price > MA20 > MA50 > MA200, RSI(14) at 63.9, and is 0.0% below its 52-Week high, indicating strong momentum with a potential breakout.
Related headlines
📉 Nearest to 52-Week Low
Sectors represented: Consumer Cyclical (2), Financial (1), Technology (1), Real Estate (1)
| Ticker | Company | Sector | Price Last | % Realized | 52-Week Low Date | RSI | % above MA200 | Trend |
|---|---|---|---|---|---|---|---|---|
| MCD | McDonald's Corp | Consumer Cyclical | $249.73 | -17.66% | 2026-09-16 | 32.8 | -15.1% | Below MA20, MA50, MA200 |
| TJX | TJX Companies, Inc | Consumer Cyclical | $124.34 | -10.90% | 2026-09-16 | 16.3 | -19.2% | Below MA20, MA50, MA200 |
| AON | Aon plc | Financial | $302.08 | -15.28% | 2026-09-16 | 32.2 | -10.0% | Below MA20, MA50, MA200 |
| FIS | Fidelity National Information Services, Inc | Technology | $37.33 | -43.81% | 2026-09-16 | 33.0 | -23.3% | Below MA20, MA50, MA200 |
| EQR | Equity Residential Properties Trust | Real Estate | $63.66 | -7.74% | 2026-08-17 | 21.2 | — | — |
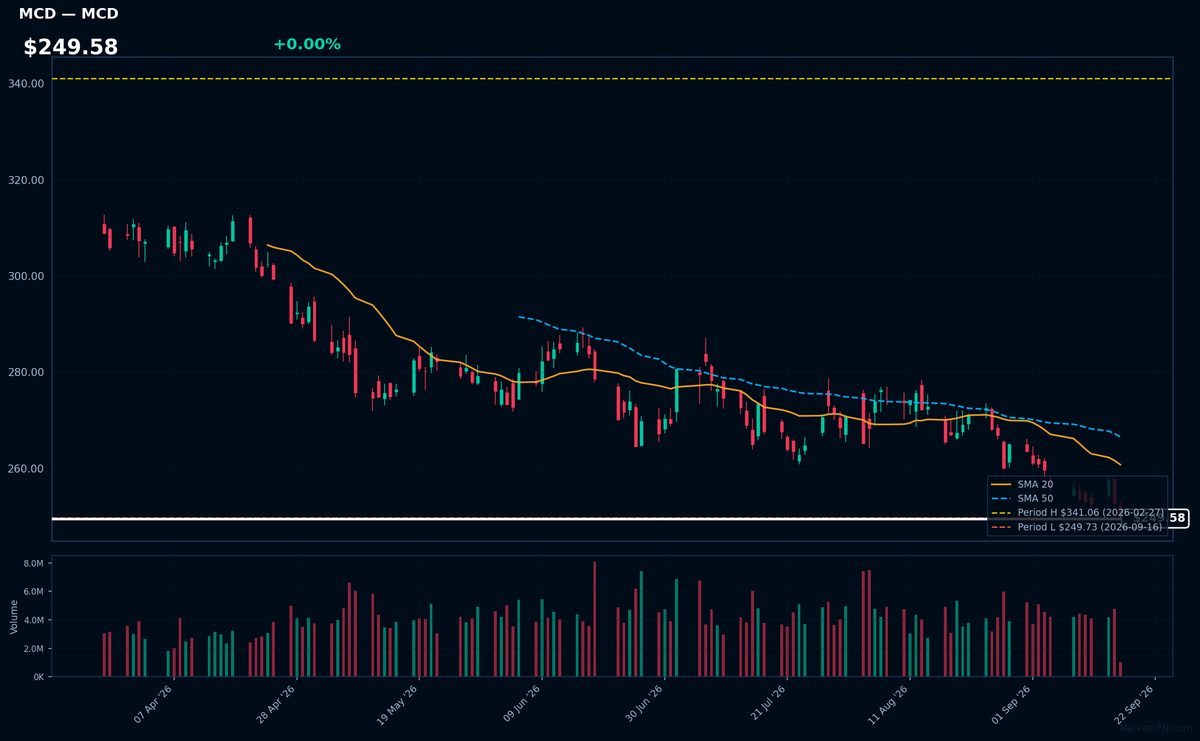
MCD | McDonald's Corp | Consumer Cyclical | Price Last: $249.73 | % Realized: -17.66% | RSI: 32.8 | % above MA200: -15.1% | Trend: Below MA20, MA50, MA200
McDonald's Corp operates a global fast-food chain, serving burgers, fries, and beverages. Investors care about its brand strength, operational efficiency, and market penetration, as these factors influence revenue growth and profitability.
McDonald's Corp is in a sustained downtrend with price ($249.58) below MA20, MA50, and MA200. The RSI(14) is 32.8, nearing oversold territory, and the stock is at its 52-Week low, indicating a potential warning sign.
Related headlines
- WEN, CMG, SBUX, MCD, CAVA Stocks: Seaport Sees One Stock Stand Out Amid Restaurant Traffic Weakness, Valuation Risks
- McDonald's target falls to $325, but Jefferies keeps faith in recovery
- This Chinese Chain Has More Locations Than McDonalds. They Did It By Copying This U.S. Discount Chains Playbook.
- Why Did OPEN, OKLO, MCD Stocks Plunge To 52-Week Lows?
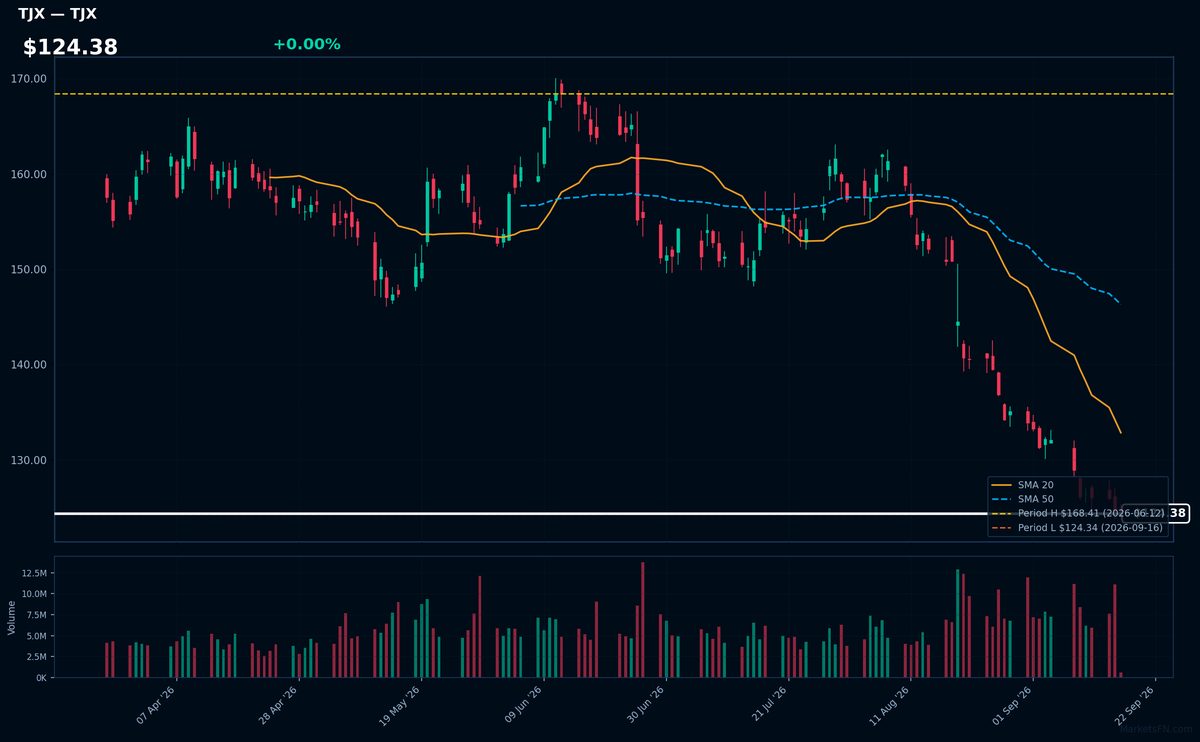
TJX | TJX Companies, Inc | Consumer Cyclical | Price Last: $124.34 | % Realized: -10.90% | RSI: 16.3 | % above MA200: -19.2% | Trend: Below MA20, MA50, MA200
TJX Companies, Inc operates off-price retail stores, offering brand-name merchandise at discounted prices. Investors should care about its ability to maintain margins and sales growth amidst competitive pressures, indicating its resilience in the retail sector.
TJX is in a sustained downtrend with price ($124.38) below MA20, MA50, and MA200. The RSI(14) is 16.3, near oversold territory, and the stock is 0.0% above its 52-Week low, indicating a potential support test.
Related headlines
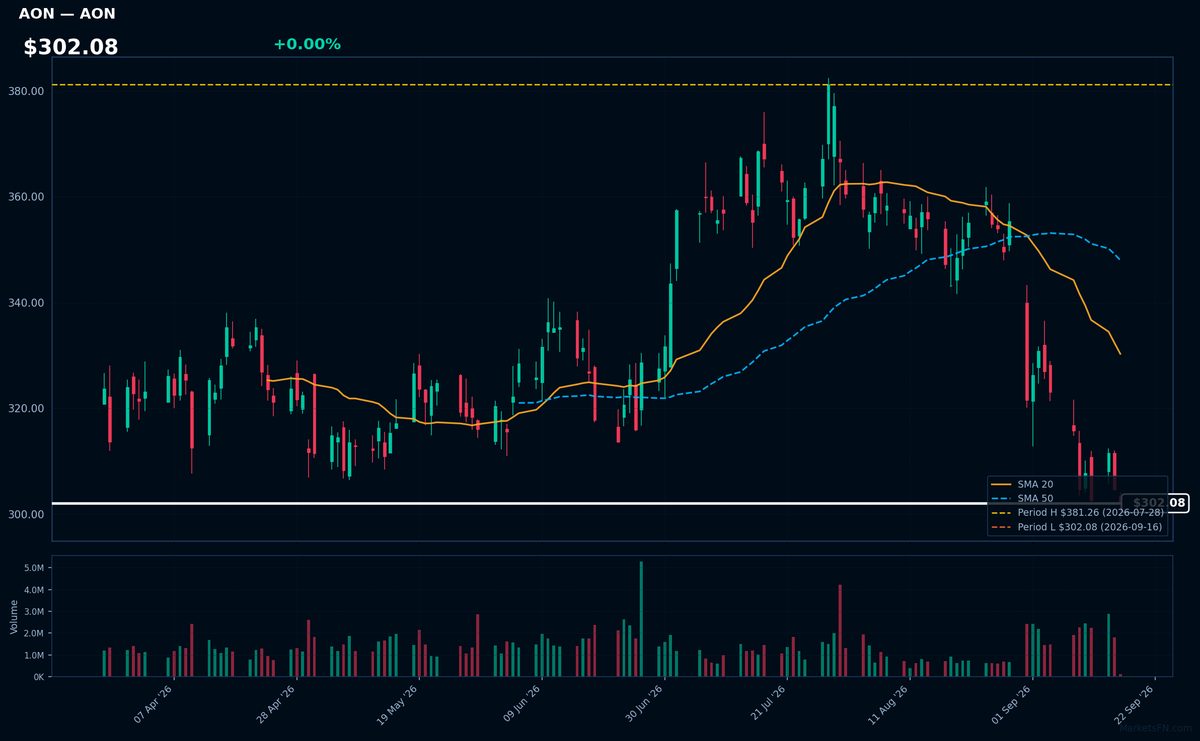
AON | Aon plc | Financial | Price Last: $302.08 | % Realized: -15.28% | RSI: 32.2 | % above MA200: -10.0% | Trend: Below MA20, MA50, MA200
Aon plc is a global risk management and insurance brokerage firm, providing services such as insurance brokerage, reinsurance, and human capital consulting. Investors should care about its performance as it reflects the demand for risk management services and its competitive positioning.
Aon plc's technicals indicate a warning sign with an RSI(14) of 32.2, suggesting oversold conditions, and the stock is below MA20, MA50, and MA200, showing a bearish trend. It's 0.0% above its 52-Week low, testing major support.
Related headlines
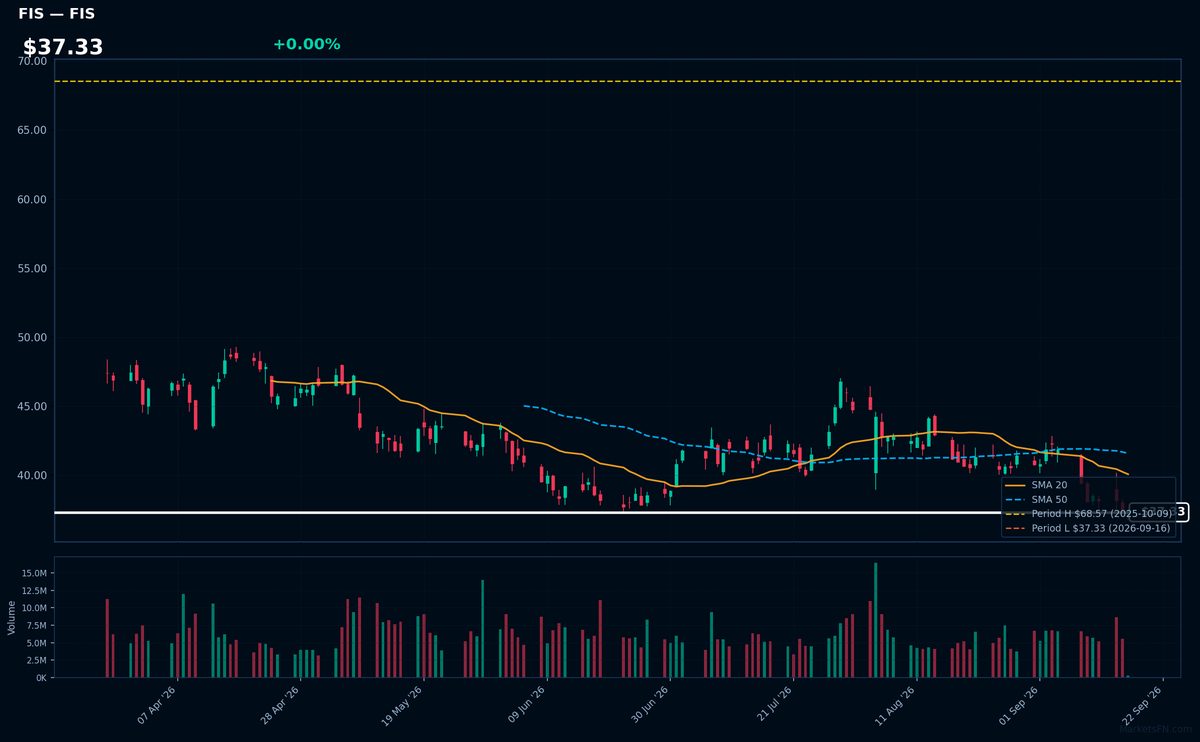
FIS | Fidelity National Information Services, Inc | Technology | Price Last: $37.33 | % Realized: -43.81% | RSI: 33.0 | % above MA200: -23.3% | Trend: Below MA20, MA50, MA200
Fidelity National Information Services, Inc (FIS) provides technology solutions for the financial services industry, including payment processing, risk management, and banking software. Investors should care about its performance as it reflects the health of the financial technology sector.
FIS is in a sustained downtrend with price ($37.33) below MA20, MA50, and MA200. The RSI(14) is 33.0, near oversold territory, and the stock is 0.0% above its 52-Week low, indicating a potential support test, warning of further downside risk.
Related headlines
- FIS Builds Core Banking Momentum Across New $100 Billion Bank and Five New Charters
- Fidelity National Information Services Inc's Dividend Analysis
- Community and Regional Banks are Choosing FIS to Accelerate Modernization
- Fidelity National Information Services Inc. stock underperforms Tuesday when compared to competitors
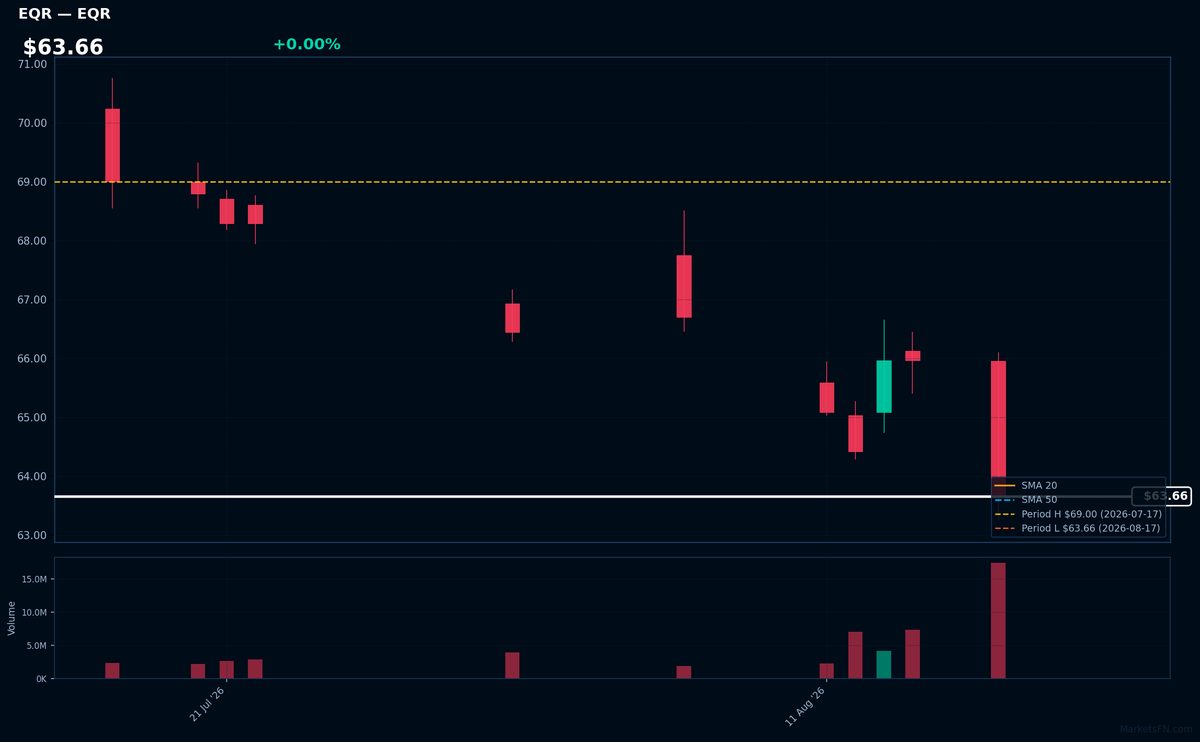
EQR | Equity Residential Properties Trust | Real Estate | Price Last: $63.66 | % Realized: -7.74% | RSI: 21.2 | % above MA200: — | Trend: —
Equity Residential Properties Trust is a real estate investment trust that owns and operates apartment properties, providing rental housing. Investors care about its performance as it reflects demand for rental housing and the company's ability to generate income.
The stock's RSI(14) is 21.2, indicating oversold conditions, and is 0.0% above its 52-Week low, testing major support. The 52-Week return is -7.7%. This is a warning sign, suggesting potential further downside.
Related headlines
Market Commentary
The S&P 500 stocks listed are currently trading near their 52-week extremes, with some at highs and others at lows. Stocks like TMO, DELL, IQV, DGX, and PFG are at their 52-week highs, while MCD, TJX, AON, FIS, and EQR are at their 52-week lows. This indicates a significant price movement, potentially driven by fundamental factors or market sentiment.
The stocks near 52-week highs are primarily from the healthcare and technology sectors, suggesting a potential rotation into these areas. Conversely, the stocks near 52-week lows are from diverse sectors, including consumer staples, financials, and real estate. This may indicate a shift in investor preferences or reactions to macroeconomic themes, such as interest rates or consumer behavior.
Key levels to watch include the current prices of these stocks, as a break above or below their 52-week extremes could signal further price movements. Potential catalysts include earnings reports, macroeconomic data releases, and sector-specific news. Investors should monitor these developments to gauge the sustainability of the current price trends.
Methodology: All 503 S&P 500 constituents screened. 52-week high = highest daily close over the past 252 trading days (approx. 1 year). 52-week low = lowest daily close over the same period. Distance = (current price / extreme − 1) × 100. Technical indicators computed on up to 1 year of daily OHLCV data.
Disclaimer: For informational purposes only. Not investment advice. Past performance is not indicative of future results.

