S&P 500 52-Week Highs & Lows Radar: NVIDIA (NVDA), Netflix (NFLX) and more
MarketsFN Team

S&P 500 52-Week Highs & Lows Radar: NVIDIA (NVDA), Netflix (NFLX) and more
Screening all 503 S&P 500 constituents for stocks nearest to their 52-week high and their 52-week low. Data as of October 02, 2026. % Realized = 52-week total return.
Legend: RSI > 70 = overbought · RSI < 30 = oversold · Green % Realized = positive 52W return · Red = negative.
📈 Nearest to 52-Week High
Sectors represented: Technology (5)
| Ticker | Company | Sector | Price Last | % Realized | 52-Week High Date | RSI | % above MA200 | Trend |
|---|---|---|---|---|---|---|---|---|
| NVDA | NVIDIA Corp | Technology | $237.24 | +25.60% | 2026-10-02 | 65.4 | +18.2% | Above MA20, MA50, MA200 |
| AMD | Advanced Micro Devices Inc | Technology | $638.21 | +276.01% | 2026-10-02 | 70.8 | +70.3% | Above MA20, MA50, MA200 |
| PANW | Palo Alto Networks Inc | Technology | $405.58 | +93.78% | 2026-10-02 | 63.4 | +62.0% | Above MA20, MA50, MA200 |
| CRWD | Crowdstrike Holdings Inc | Technology | $270.61 | +117.88% | 2026-10-02 | 69.0 | +76.2% | Above MA20, MA50, MA200 |
| FTNT | Fortinet Inc | Technology | $182.56 | +111.57% | 2026-10-02 | 65.5 | +54.0% | Above MA20, MA50, MA200 |
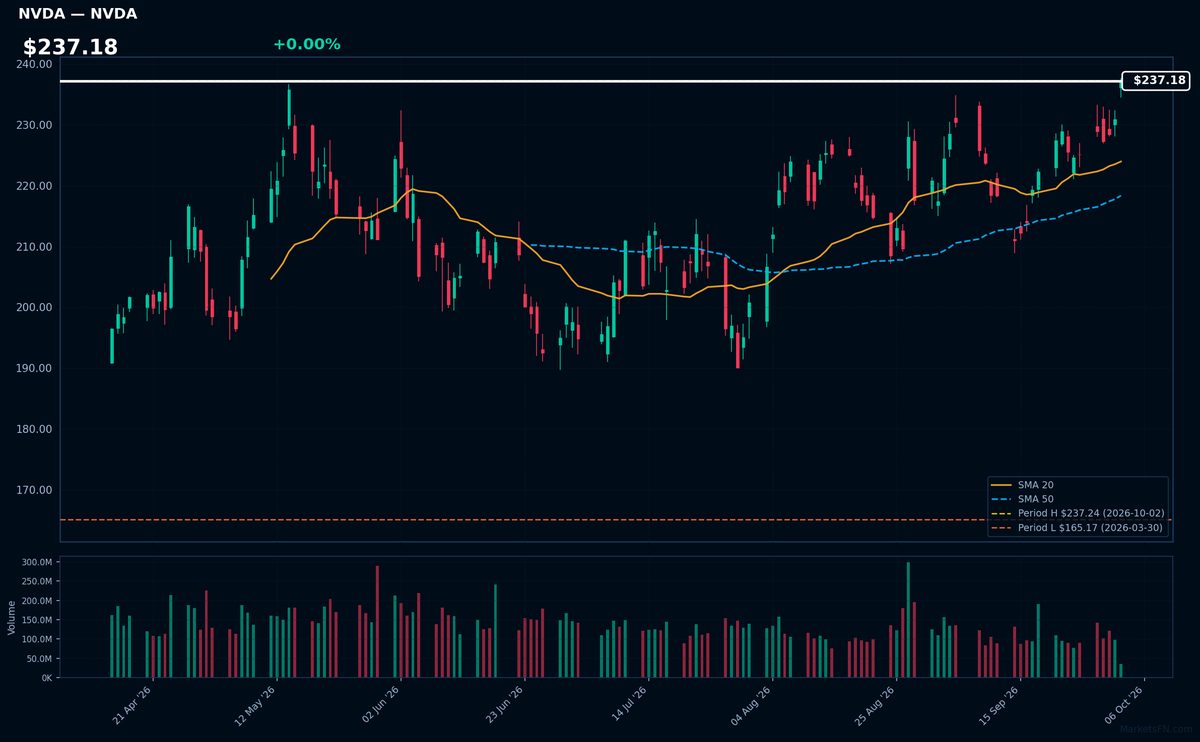
NVDA | NVIDIA Corp | Technology | Price Last: $237.24 | % Realized: +25.60% | RSI: 65.4 | % above MA200: +18.2% | Trend: Above MA20, MA50, MA200
NVIDIA Corp designs the high-performance GPUs and AI infrastructure essential for training large language models and powering data centers. Investors care because the company provides the critical hardware layer enabling the global shift toward accelerated computing and generative AI.
The stock shows strong momentum with a bullish MA alignment (price > MA20 > MA50 > MA200) and is 0.0% below its 52-Week high. With an RSI(14) of 65.4 and a 25.6% 52-Week return, the technicals suggest a sustained uptrend near a potential breakout level.
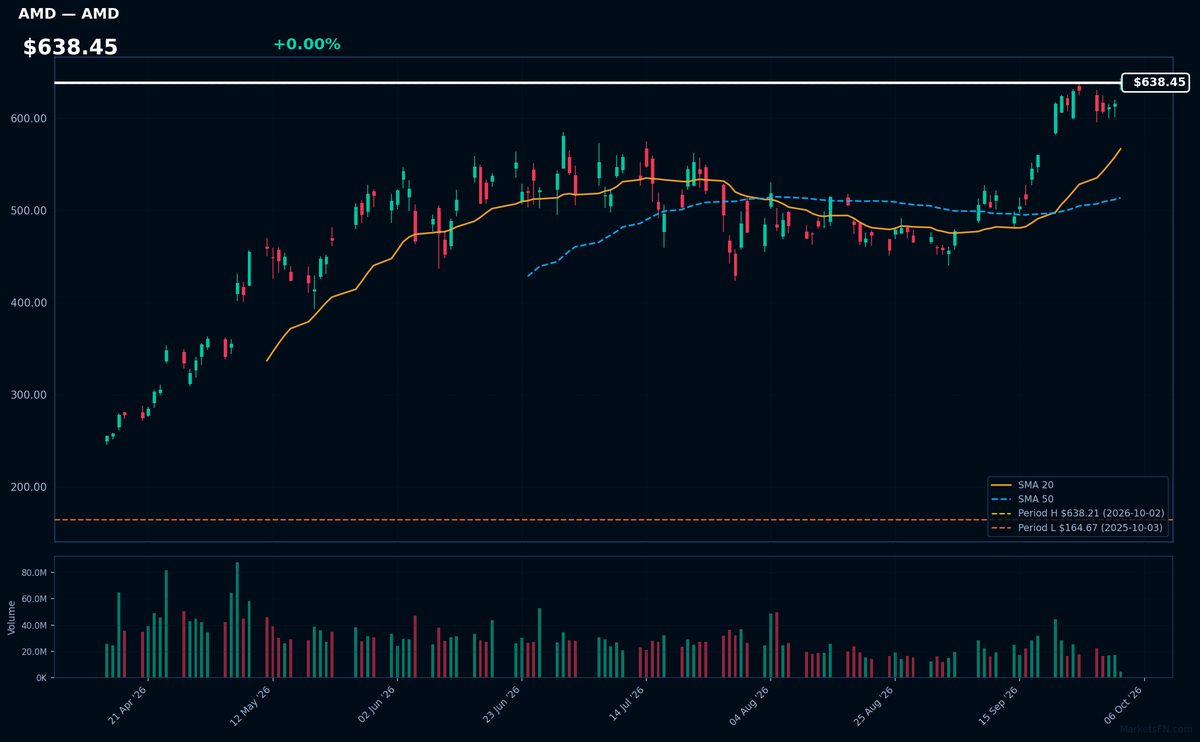
AMD | Advanced Micro Devices Inc | Technology | Price Last: $638.21 | % Realized: +276.01% | RSI: 70.8 | % above MA200: +70.3% | Trend: Above MA20, MA50, MA200
Advanced Micro Devices Inc designs high-performance computing and graphics processors. Investors should care because the company is capturing significant market share in the AI and data center sectors, driving massive growth in its semiconductor portfolio.
Strong bullish momentum is evident with a 276.0% 52-Week return and price > MA20 > MA50 > MA200. With an RSI(14) of 70.8 and the stock 0.0% below its 52-Week high, AMD is positioned at a potential breakout level.
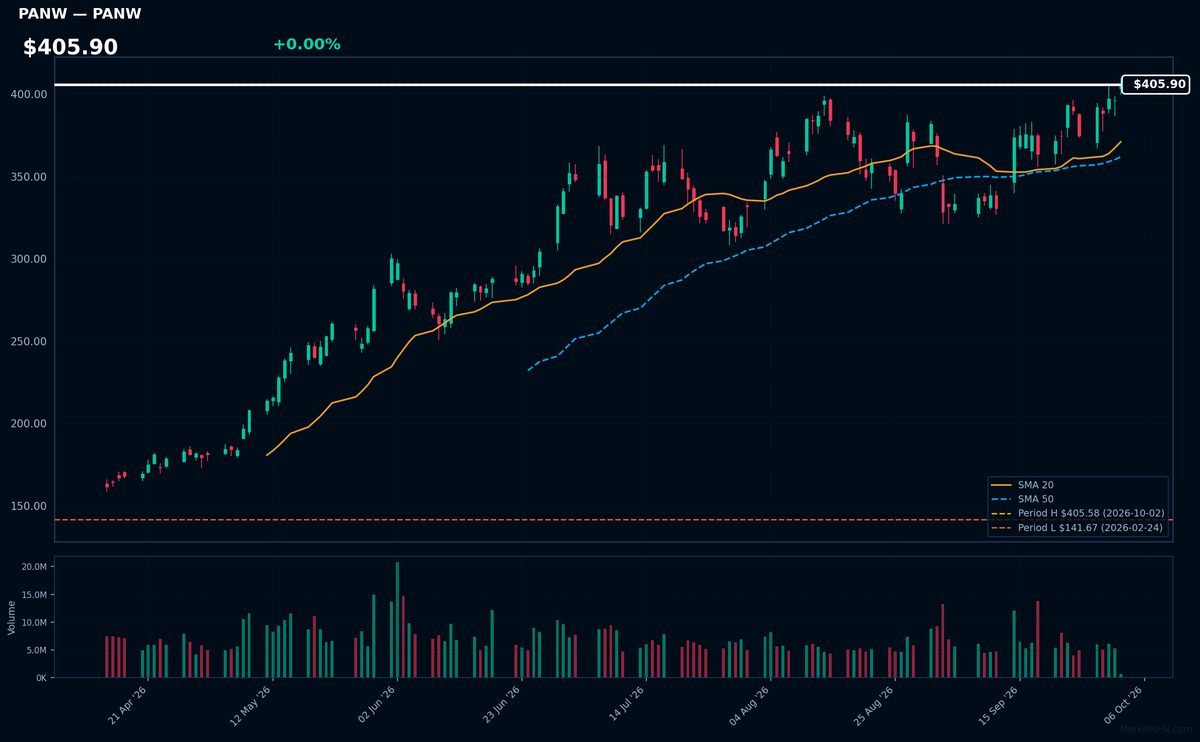
PANW | Palo Alto Networks Inc | Technology | Price Last: $405.58 | % Realized: +93.78% | RSI: 63.4 | % above MA200: +62.0% | Trend: Above MA20, MA50, MA200
Palo Alto Networks Inc provides cybersecurity solutions to protect digital assets. Investors should care because the company is demonstrating significant growth, evidenced by a 93.8% return over the 52-Week period.
The stock shows strong momentum with a bullish MA alignment (price > MA20 > MA50 > MA200) and an RSI(14) of 63.4. Trading at $405.90, it is 0.0% below its 52-Week high, signaling a potential breakout.
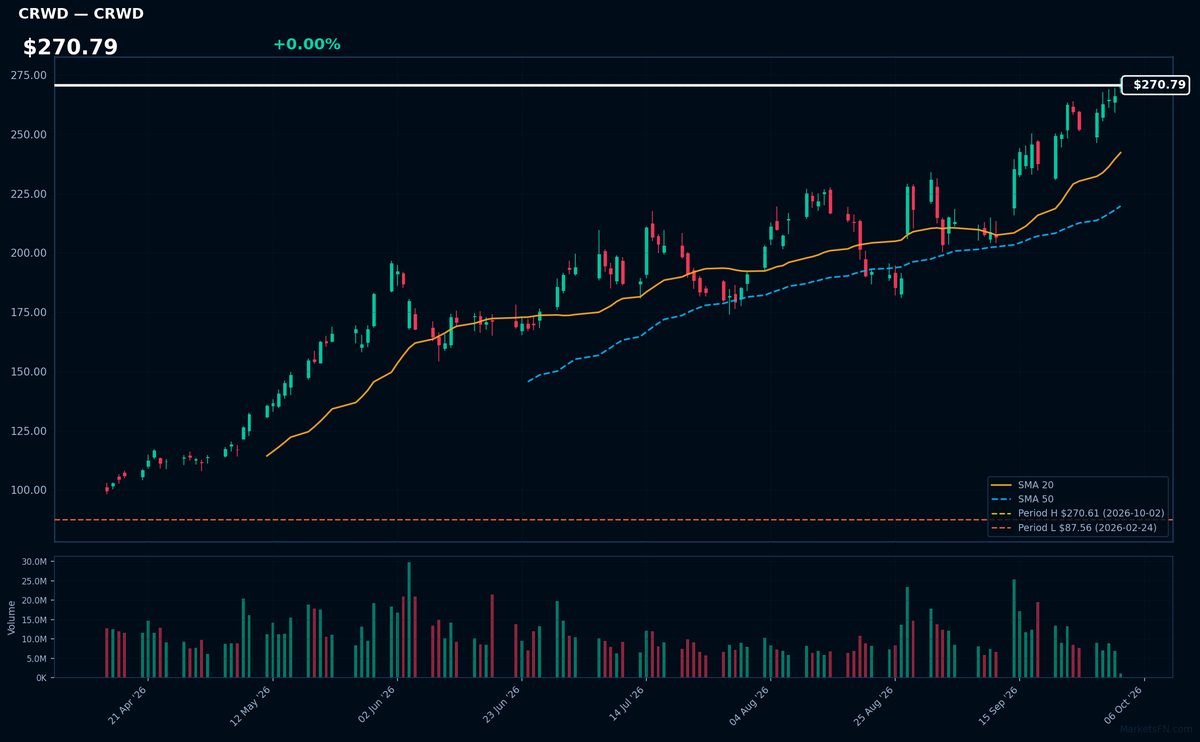
CRWD | Crowdstrike Holdings Inc | Technology | Price Last: $270.61 | % Realized: +117.88% | RSI: 69.0 | % above MA200: +76.2% | Trend: Above MA20, MA50, MA200
Crowdstrike Holdings Inc provides cloud-native endpoint protection and threat intelligence. Investors should care because the company is capturing significant market share in cybersecurity, evidenced by a 117.9% return over the 52-Week period.
The stock shows strong momentum with a bullish MA alignment (price > MA20 > MA50 > MA200). With an RSI(14) of 69.0 and being 0.0% below its 52-Week high, CRWD is positioned for a potential breakout at $270.79.
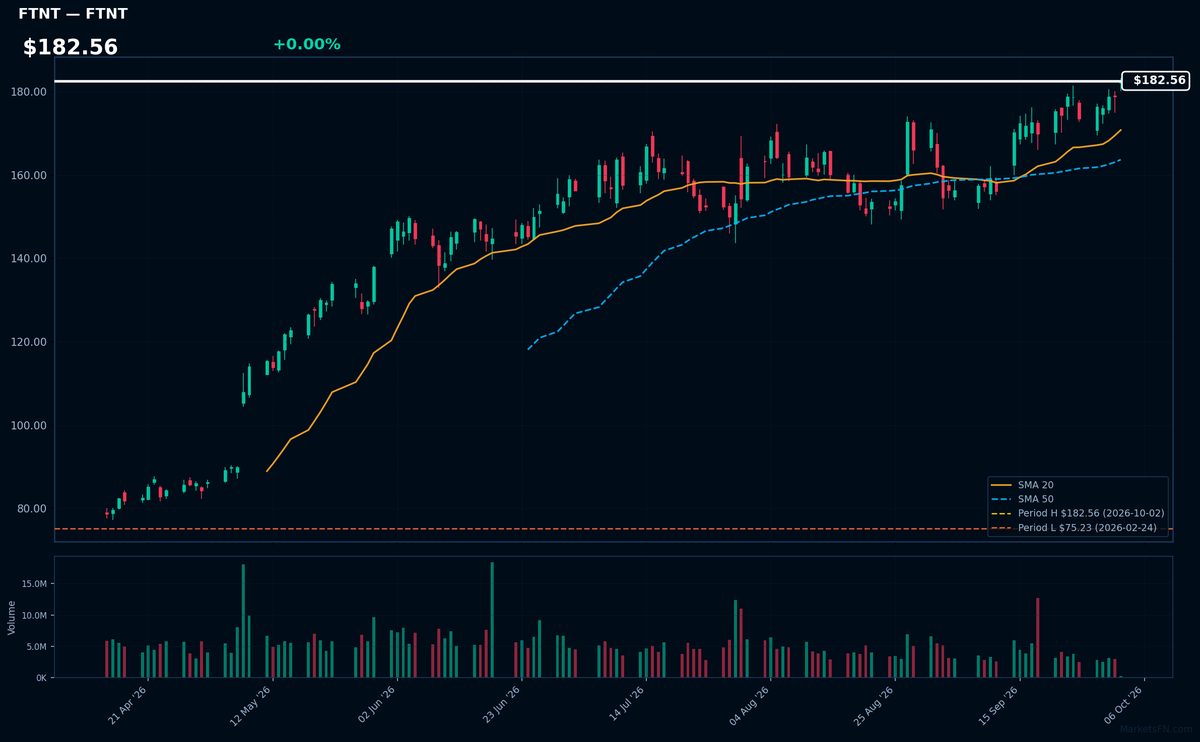
FTNT | Fortinet Inc | Technology | Price Last: $182.56 | % Realized: +111.57% | RSI: 65.5 | % above MA200: +54.0% | Trend: Above MA20, MA50, MA200
Fortinet Inc provides cybersecurity solutions to protect digital assets. Investors should care because the company is demonstrating significant growth, evidenced by a 111.6% return over the 52-Week period.
The stock shows strong momentum with a bullish MA alignment (price > MA20 > MA50 > MA200) and an RSI(14) of 65.5. Trading at $182.56, it is 0.0% below its 52-Week high, signaling a potential breakout.
📉 Nearest to 52-Week Low
Sectors represented: Healthcare (2), Communication Services (1), Consumer Cyclical (1), Industrials (1)
| Ticker | Company | Sector | Price Last | % Realized | 52-Week Low Date | RSI | % above MA200 | Trend |
|---|---|---|---|---|---|---|---|---|
| NFLX | Netflix Inc | Communication Services | $67.50 | -41.93% | 2026-10-02 | 31.7 | -19.7% | Below MA20, MA50, MA200 |
| BSX | Boston Scientific Corp | Healthcare | $42.12 | -56.23% | 2026-10-02 | 34.2 | -31.8% | Below MA20, MA50, MA200 |
| NKE | Nike, Inc | Consumer Cyclical | $32.97 | -55.79% | 2026-10-02 | 25.3 | -32.3% | Below MA20, MA50, MA200 |
| NOC | Northrop Grumman Corp | Industrials | $475.58 | -21.39% | 2026-10-02 | 24.2 | -20.5% | Below MA20, MA50, MA200 |
| ZTS | Zoetis Inc | Healthcare | $69.09 | -52.84% | 2026-10-02 | 34.1 | -29.8% | Below MA20, MA50, MA200 |
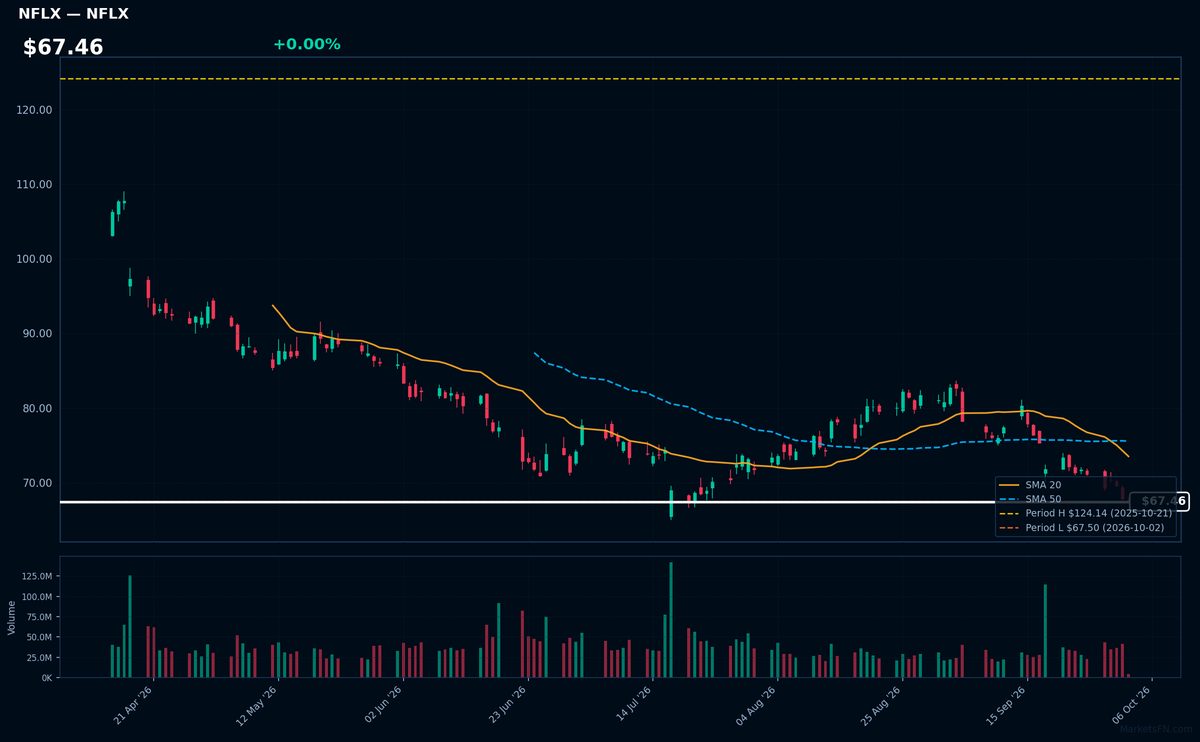
NFLX | Netflix Inc | Communication Services | Price Last: $67.50 | % Realized: -41.93% | RSI: 31.7 | % above MA200: -19.7% | Trend: Below MA20, MA50, MA200
Netflix Inc operates a global subscription-based streaming service, producing and distributing original content and licensed media. Investors track the company as a primary bellwether for the direct-to-consumer entertainment shift and the scalability of digital content monetization.
The technical outlook is a warning sign. NFLX is in a sustained downtrend with a bearish MA alignment (price < MA20 < MA50 < MA200) and an RSI(14) of 31.7. The stock is testing major support, sitting only 0.0% above its 52-Week low.
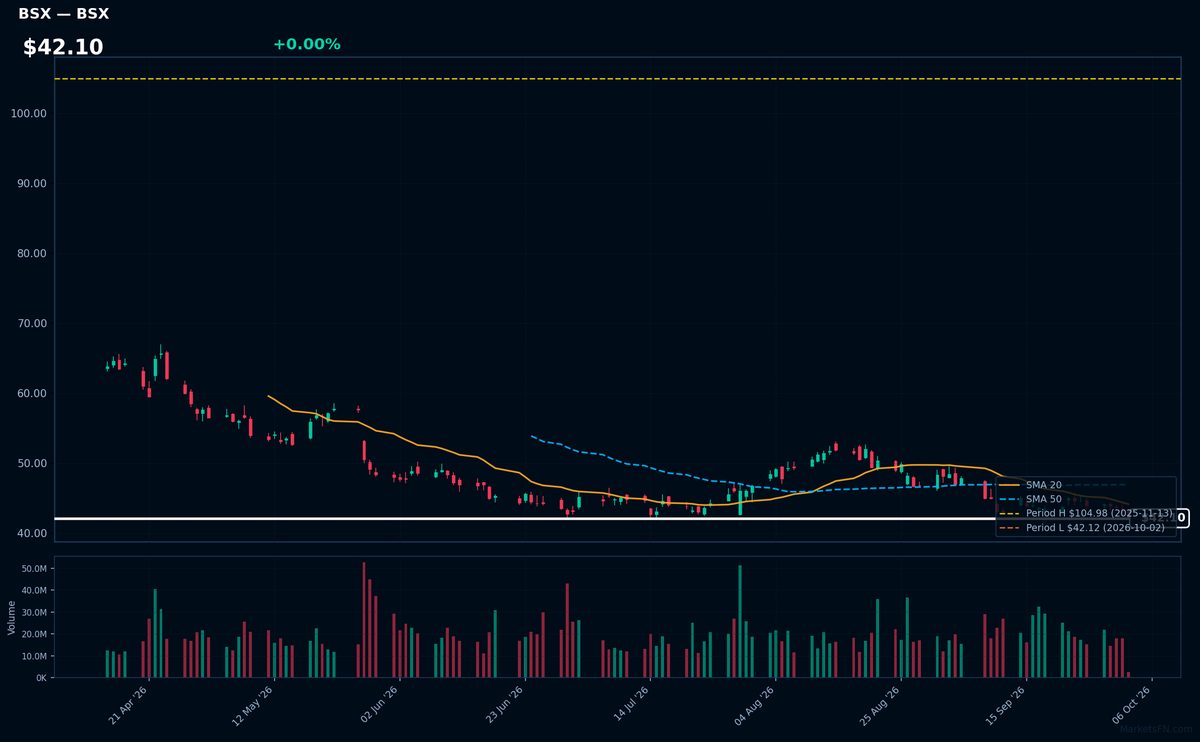
BSX | Boston Scientific Corp | Healthcare | Price Last: $42.12 | % Realized: -56.23% | RSI: 34.2 | % above MA200: -31.8% | Trend: Below MA20, MA50, MA200
Boston Scientific Corp is a medical technology company. Investors should monitor the stock as it tests major support, currently trading at $42.10, which is 0.0% above its 52-Week low.
Technicals signal a warning sign. The stock is in a sustained downtrend with bearish MA alignment (price < MA20 < MA50 < MA200) and a 52-Week return of -56.2%. The RSI(14) stands at 34.2.
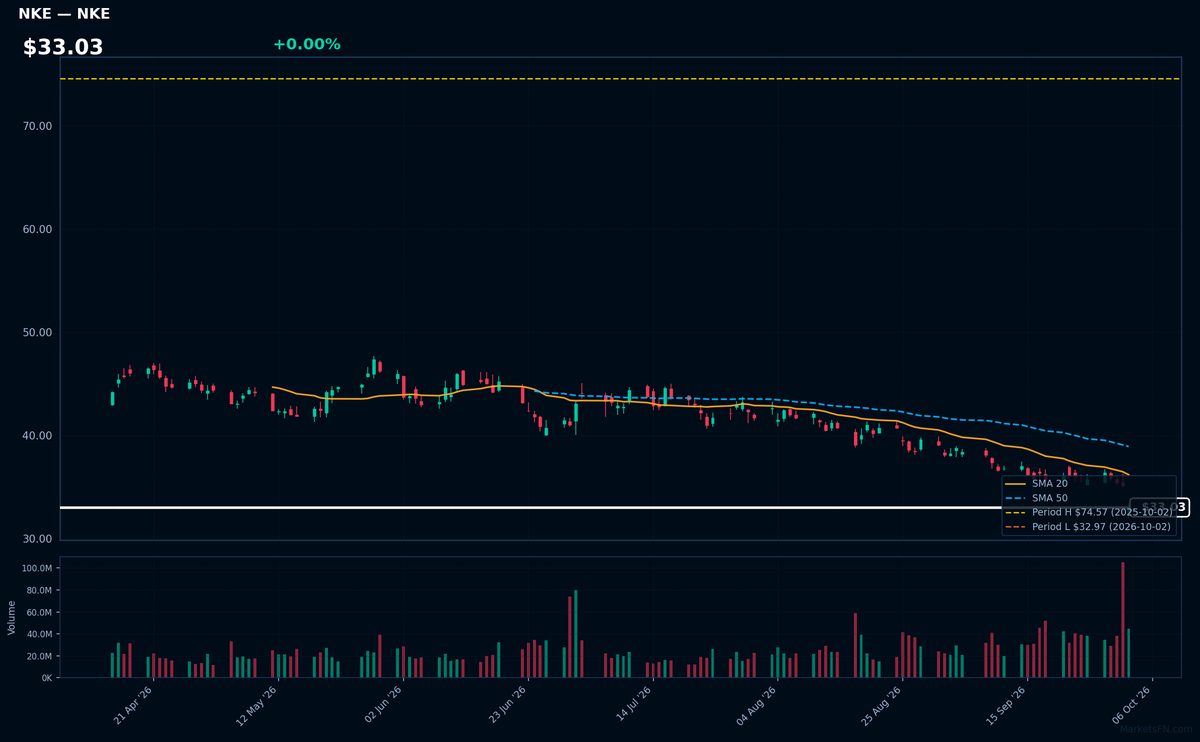
NKE | Nike, Inc | Consumer Cyclical | Price Last: $32.97 | % Realized: -55.79% | RSI: 25.3 | % above MA200: -32.3% | Trend: Below MA20, MA50, MA200
Nike, Inc designs and markets athletic footwear, apparel, and equipment. Investors should care because the company is a global leader in sports brand dominance, though it is currently facing a severe valuation correction as evidenced by a -55.8% return over the 52-Week period.
The technicals signal a severe warning sign. With a bearish MA alignment (price < MA20 < MA50 < MA200) and an RSI(14) of 25.3, the stock is in a sustained downtrend, currently testing major support just 0.0% above its 52-Week low.
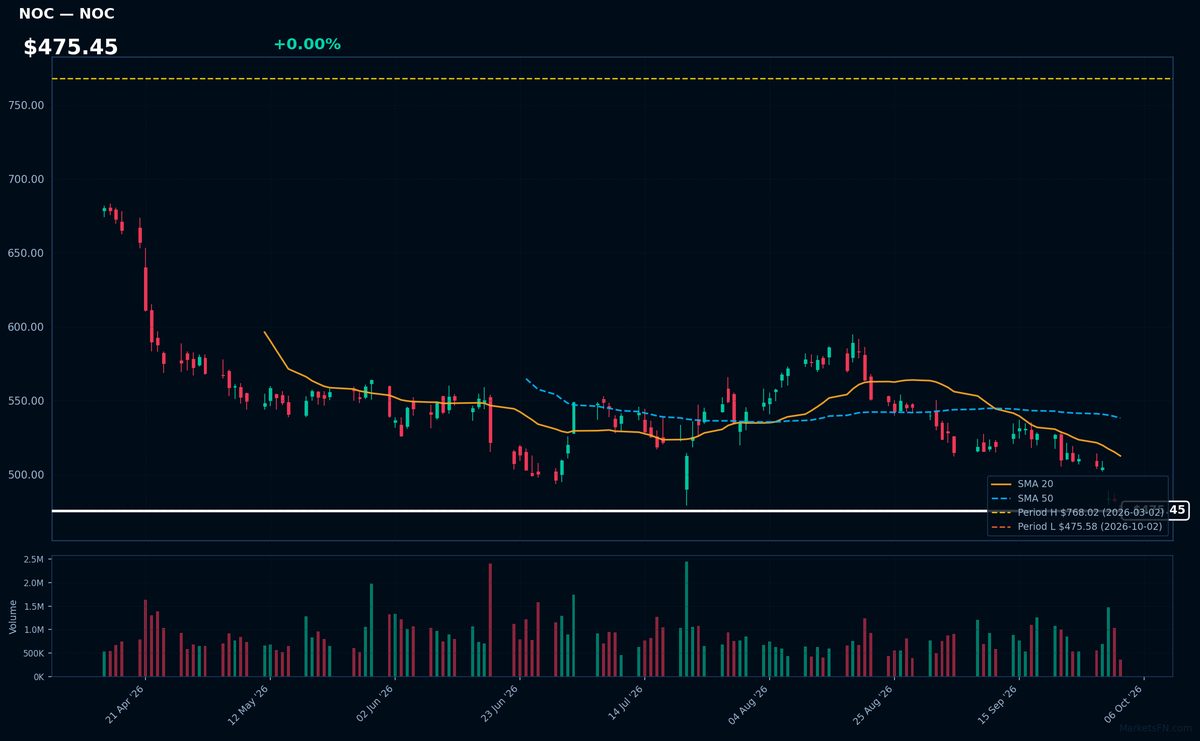
NOC | Northrop Grumman Corp | Industrials | Price Last: $475.58 | % Realized: -21.39% | RSI: 24.2 | % above MA200: -20.5% | Trend: Below MA20, MA50, MA200
Northrop Grumman Corp is a global aerospace and defense company providing innovative systems and solutions in autonomous systems, cyber, space, and strike capabilities. Investors care due to its significant role in defense technology and government contracting.
NOC's RSI(14) is 24.2, indicating oversold conditions. The bearish MA alignment (price < MA20 < MA50 < MA200) and 0.0% proximity to its 52-Week low suggest a sustained downtrend and testing major support, potentially a warning sign.
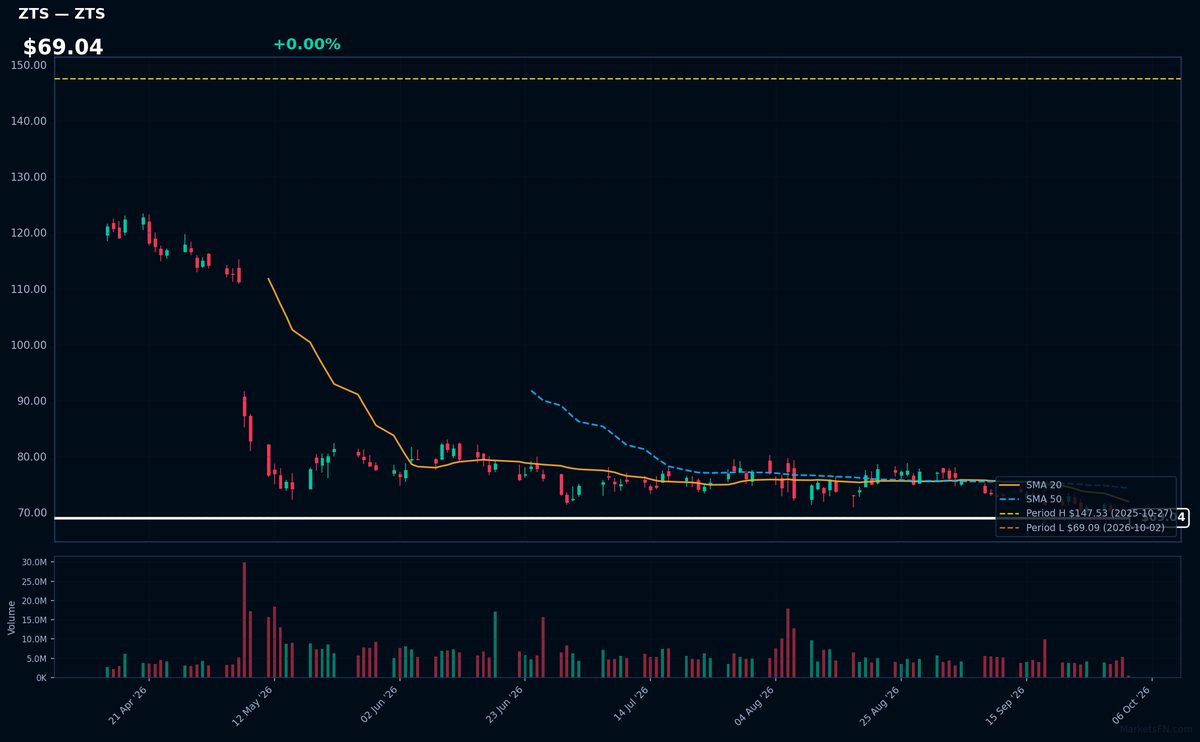
ZTS | Zoetis Inc | Healthcare | Price Last: $69.09 | % Realized: -52.84% | RSI: 34.1 | % above MA200: -29.8% | Trend: Below MA20, MA50, MA200
Zoetis Inc is a global animal health company that develops and manufactures veterinary vaccines, diagnostics, and medicines. Investors should care because its products impact the $180 billion global animal health market, driven by increasing pet ownership and livestock demand.
Zoetis' technical situation is bearish, with an RSI(14) of 34.1 indicating oversold conditions. The stock is in a sustained downtrend (price < MA20 < MA50 < MA200) and testing major support at its 52-Week low, having lost 52.8% over the past year.
Market Commentary
The presence of several S&P 500 stocks at 52-week extremes signals a stark divergence in market sentiment. NVDA, AMD, PANW, CRWD, and FTNT are all 0.0% from their 52-week highs, indicating peak bullish momentum. Conversely, NFLX, BSX, NKE, NOC, and ZTS are +0.0% above their 52-week lows, reflecting significant bearish pressure or valuation resets.
This distribution highlights a clear sector rotation toward semiconductors and cybersecurity. The concentration of stocks at highs—specifically NVDA, AMD, and security firms like PANW, CRWD, and FTNT—underscores a macro theme centered on AI infrastructure and digital defense. Meanwhile, the proximity of NKE and NFLX to 52-week lows suggests headwinds for consumer-facing and discretionary sectors.
Investors should monitor the 0.0% threshold for the high-flyers to see if they can sustain these peaks. For the stocks near lows, such as ZTS and NOC, the +0.0% level serves as a critical support zone. Potential catalysts will depend on whether the momentum in AI-driven names continues to offset the weakness seen in the stocks currently testing their 52-week lows.
Methodology: All 503 S&P 500 constituents screened. 52-week high = highest daily close over the past 252 trading days (approx. 1 year). 52-week low = lowest daily close over the same period. Distance = (current price / extreme − 1) × 100. Technical indicators computed on up to 1 year of daily OHLCV data.
Disclaimer: For informational purposes only. Not investment advice. Past performance is not indicative of future results.

