S&P 500 52-Week Highs & Lows Radar: NVIDIA (NVDA), Comcast (CMCSA) and more
MarketsFN Team

S&P 500 52-Week Highs & Lows Radar: NVIDIA (NVDA), Comcast (CMCSA) and more
Screening all 503 S&P 500 constituents for stocks nearest to their 52-week high and their 52-week low. Data as of October 06, 2026. % Realized = 52-week total return.
Legend: RSI > 70 = overbought · RSI < 30 = oversold · Green % Realized = positive 52W return · Red = negative.
📈 Nearest to 52-Week High
Sectors represented: Technology (3), Healthcare (2)
| Ticker | Company | Sector | Price Last | % Realized | 52-Week High Date | RSI | % above MA200 | Trend |
|---|---|---|---|---|---|---|---|---|
| NVDA | NVIDIA Corp | Technology | $242.37 | +30.63% | 2026-10-06 | 69.4 | +20.4% | Above MA20, MA50, MA200 |
| ABBV | Abbvie Inc | Healthcare | $266.45 | +15.75% | 2026-10-06 | 59.3 | +14.9% | Above MA20, MA50, MA200 |
| AMD | Advanced Micro Devices Inc | Technology | $641.13 | +214.73% | 2026-10-06 | 70.9 | +69.1% | Above MA20, MA50, MA200 |
| TMO | Thermo Fisher Scientific Inc | Healthcare | $685.25 | +25.98% | 2026-10-06 | 66.9 | +26.0% | Above MA20, MA50, MA200 |
| ANET | Arista Networks Inc | Technology | $211.08 | +41.19% | 2026-10-06 | 63.5 | +32.1% | Above MA20, MA50, MA200 |
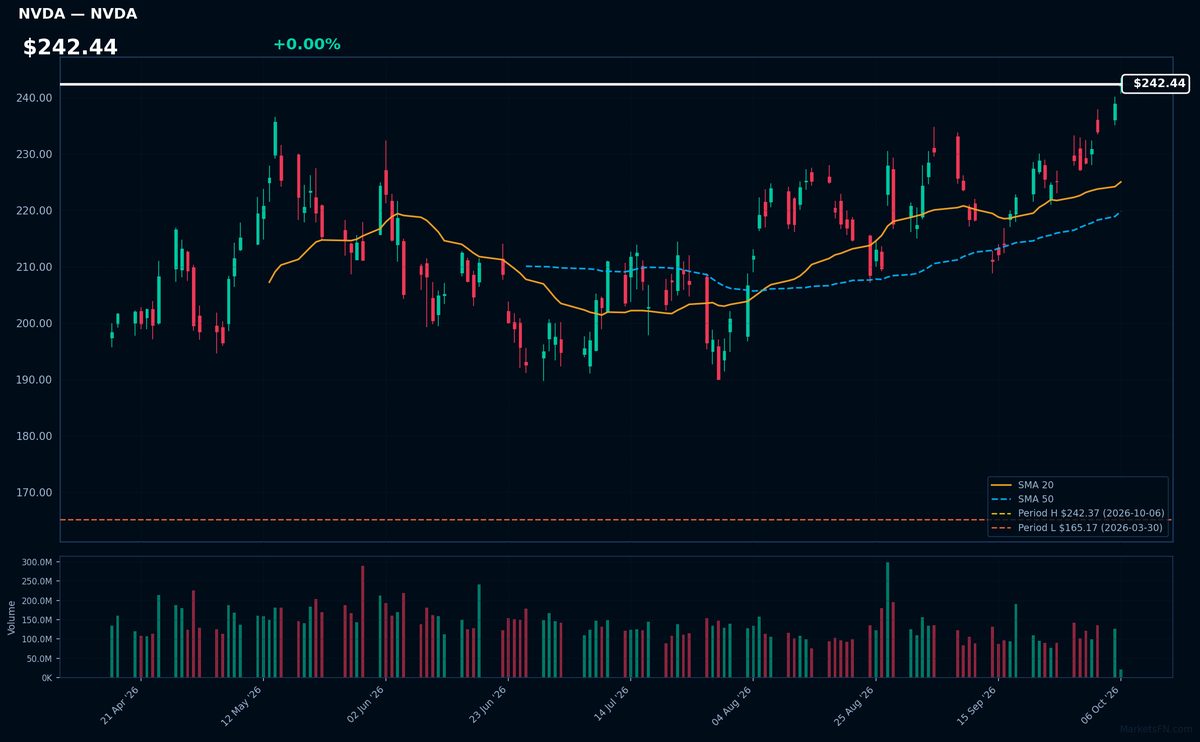
NVDA | NVIDIA Corp | Technology | Price Last: $242.37 | % Realized: +30.63% | RSI: 69.4 | % above MA200: +20.4% | Trend: Above MA20, MA50, MA200
NVIDIA dominates GPU design for AI/ML workloads and gaming, with its chips becoming the backbone of modern data centers. Investors care because its hardware accelerates transformative technologies like generative AI, creating pricing power in a near-monopoly position.
Technically bullish with RSI(14) at 69.4 and price > MA20 > MA50 > MA200, testing 52-week highs after a 30.6% yearly gain. The MA alignment confirms uptrend momentum, though RSI nears overbought territory.
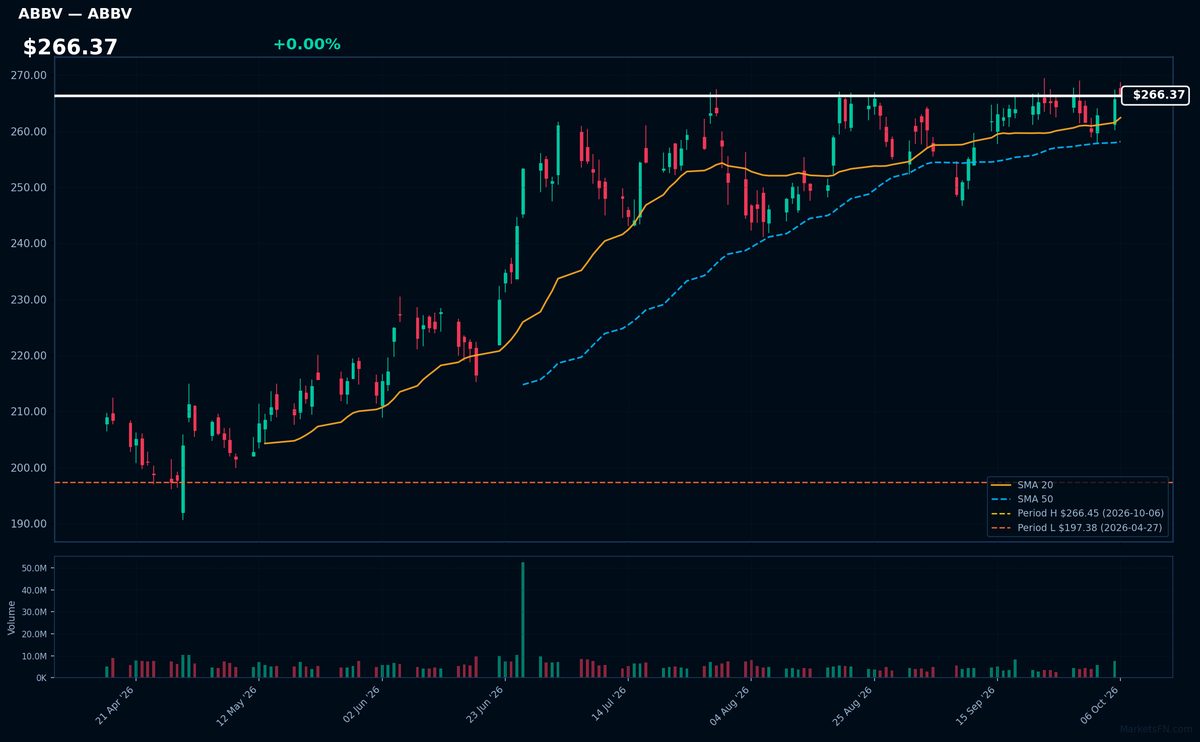
ABBV | Abbvie Inc | Healthcare | Price Last: $266.45 | % Realized: +15.75% | RSI: 59.3 | % above MA200: +14.9% | Trend: Above MA20, MA50, MA200
AbbVie Inc is a biopharmaceutical leader specializing in immunology (Humira, Skyrizi) and oncology (Imbruvica, Venclexta) therapies. Investors should note its dominant autoimmune franchise and pipeline expansion into neuroscience, with recent FDA approvals for migraine and Parkinson's treatments driving growth beyond its patent-cliff challenges.
ABBV shows bullish momentum with price ($266.37) above all key MAs (20/50/200) and RSI(14) at 59.3 — neither overbought nor oversold. The stock sits at its 52-week high after a 15.8% annual gain, suggesting sustained uptrend confirmation but requiring monitoring for breakout validation.
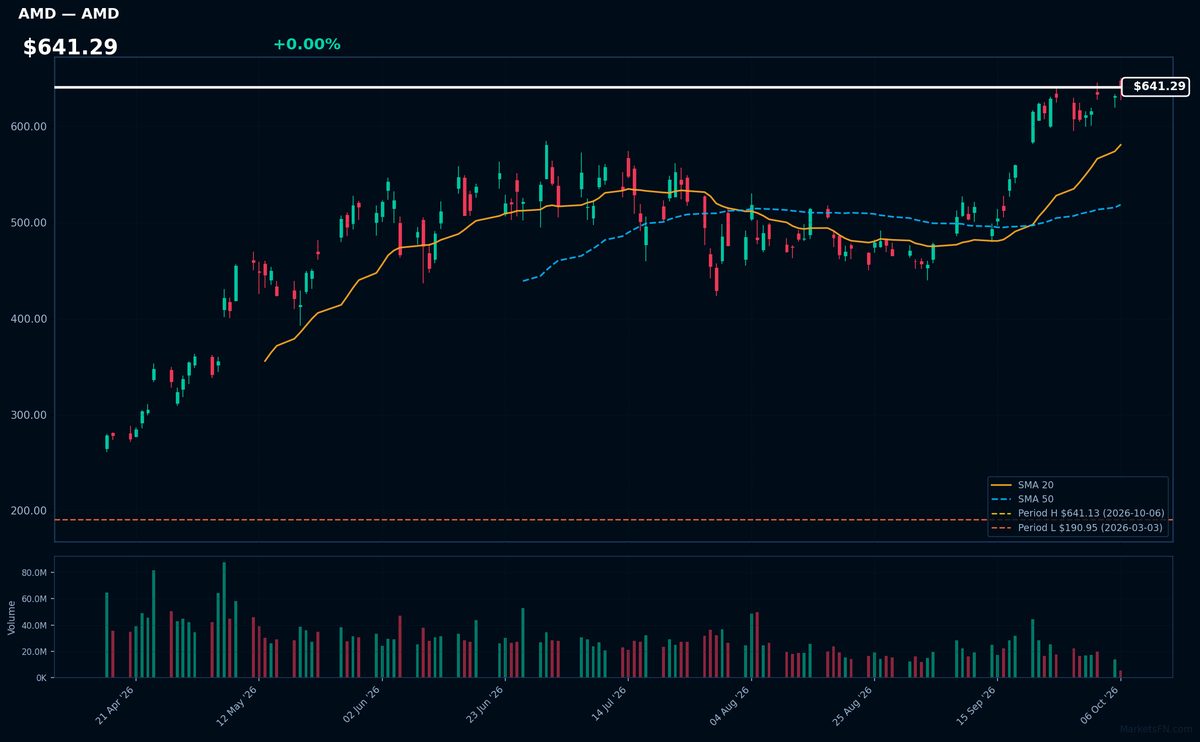
AMD | Advanced Micro Devices Inc | Technology | Price Last: $641.13 | % Realized: +214.73% | RSI: 70.9 | % above MA200: +69.1% | Trend: Above MA20, MA50, MA200
Advanced Micro Devices Inc designs high-performance computing and graphics processors competing with Nvidia and Intel. Investors care because AMD's chips power AI workloads, gaming, and data centers—markets with explosive growth potential as computing demands accelerate globally.
Technically bullish with RSI(14) at 70.9 (overbought) and price > MA20 > MA50 > MA200 in sustained uptrend. Stock tests 52-week high after 214.7% annual return—momentum extreme that warrants caution despite alignment.
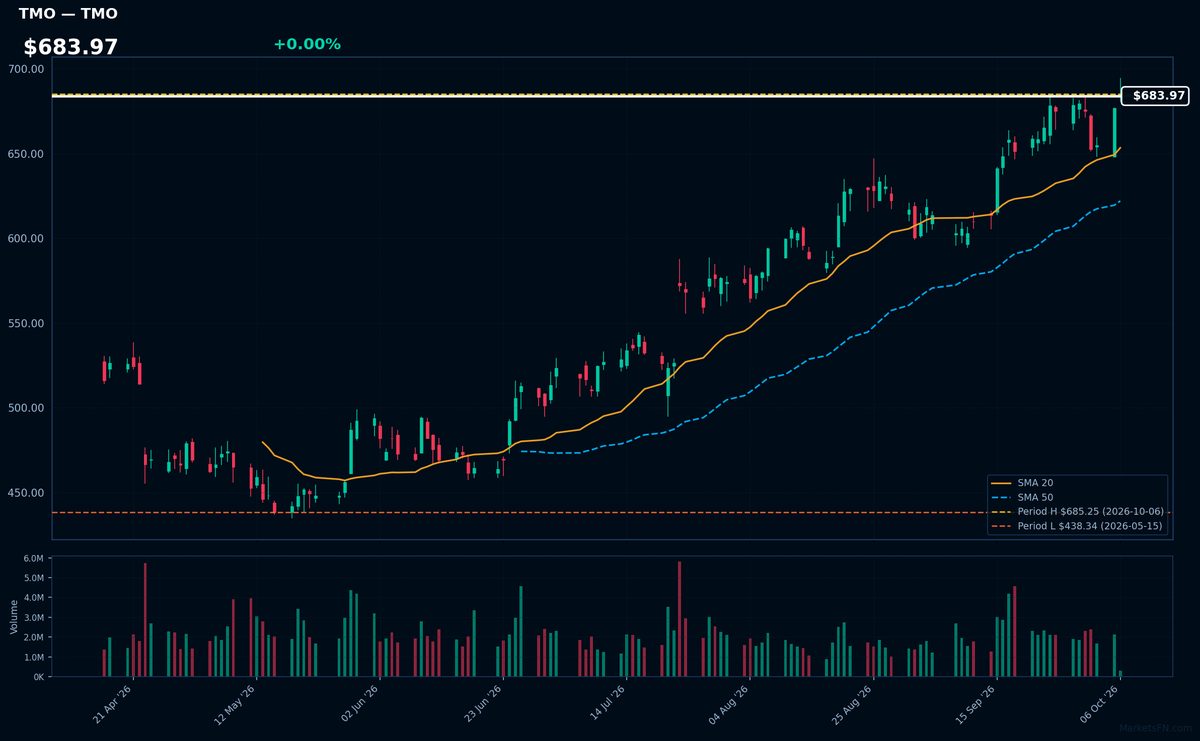
TMO | Thermo Fisher Scientific Inc | Healthcare | Price Last: $685.25 | % Realized: +25.98% | RSI: 66.9 | % above MA200: +26.0% | Trend: Above MA20, MA50, MA200
Thermo Fisher Scientific provides lab equipment, diagnostics, and life sciences tools for pharma, biotech, and healthcare. Investors care because its essential products drive consistent demand across research cycles, with recurring revenue from consumables and services.
Technically bullish: price ($683.97) > MA20 > MA50 > MA200 in sustained uptrend, RSI(14) at 66.9 (approaching overbought). Stock sits at 52-week high (+26.0% YoY) — momentum suggests continuation but warrants caution near extremes.
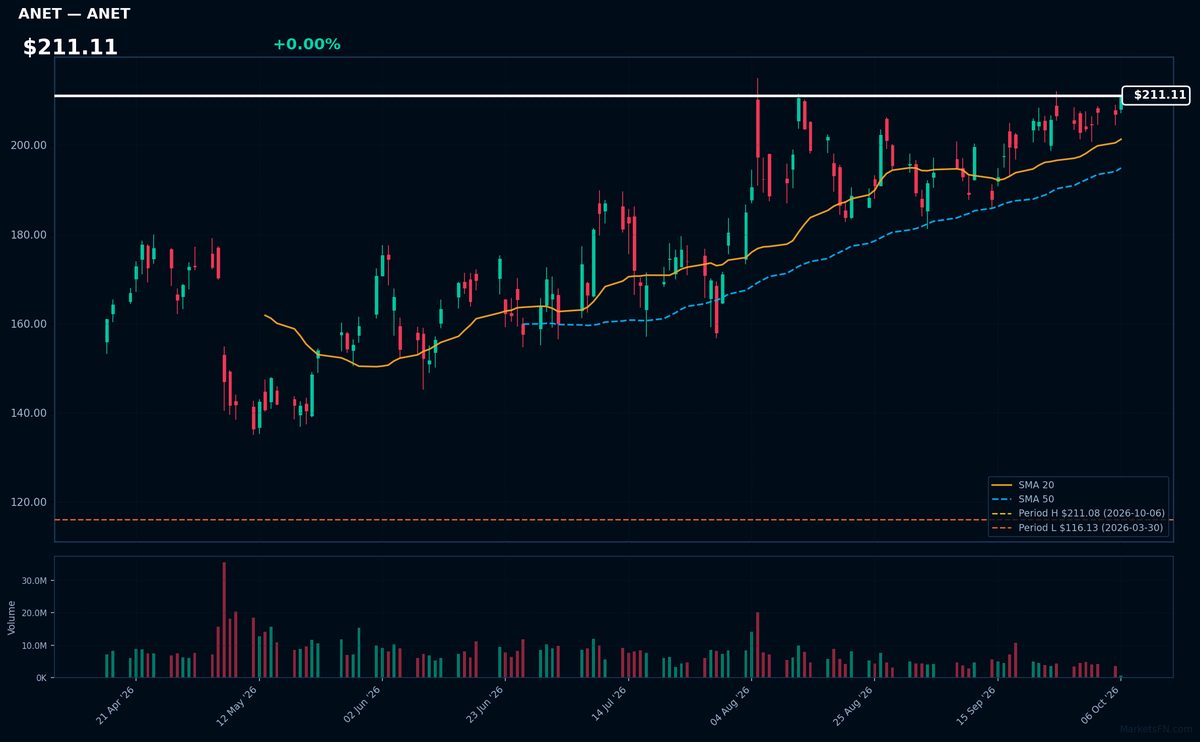
ANET | Arista Networks Inc | Technology | Price Last: $211.08 | % Realized: +41.19% | RSI: 63.5 | % above MA200: +32.1% | Trend: Above MA20, MA50, MA200
Arista Networks provides cloud networking solutions for data centers and campus environments, specializing in high-speed switches and software. Investors care because its performance-driven architecture dominates hyperscale data centers, with recurring software revenue gaining traction as enterprises modernize infrastructure.
ANET shows bullish momentum with price ($211.11) above a stacked MA20>MA50>MA200 and RSI(14) at 63.5 — elevated but not overbought. At 0.0% below its 52-week high after a 41.2% rally, it tests breakout resistance. The alignment suggests sustained uptrend continuation, not warning signs.
📉 Nearest to 52-Week Low
Sectors represented: Consumer Cyclical (2), Industrials (2), Communication Services (1)
| Ticker | Company | Sector | Price Last | % Realized | 52-Week Low Date | RSI | % above MA200 | Trend |
|---|---|---|---|---|---|---|---|---|
| CMCSA | Comcast Corp | Communication Services | $21.52 | -26.14% | 2026-10-06 | 26.8 | -19.2% | Below MA20, MA50, MA200 |
| NKE | Nike, Inc | Consumer Cyclical | $33.78 | -52.54% | 2026-10-06 | 28.2 | -30.2% | Below MA20, MA50, MA200 |
| NOC | Northrop Grumman Corp | Industrials | $475.33 | -23.15% | 2026-10-06 | 24.1 | -20.4% | Below MA20, MA50, MA200 |
| CPRT | Copart, Inc | Industrials | $27.12 | -38.98% | 2026-10-06 | 32.9 | -18.7% | Below MA20, MA50, MA200 |
| LULU | Lululemon Athletica inc | Consumer Cyclical | $92.60 | -46.82% | 2026-10-06 | 31.9 | -35.6% | Below MA20, MA50, MA200 |
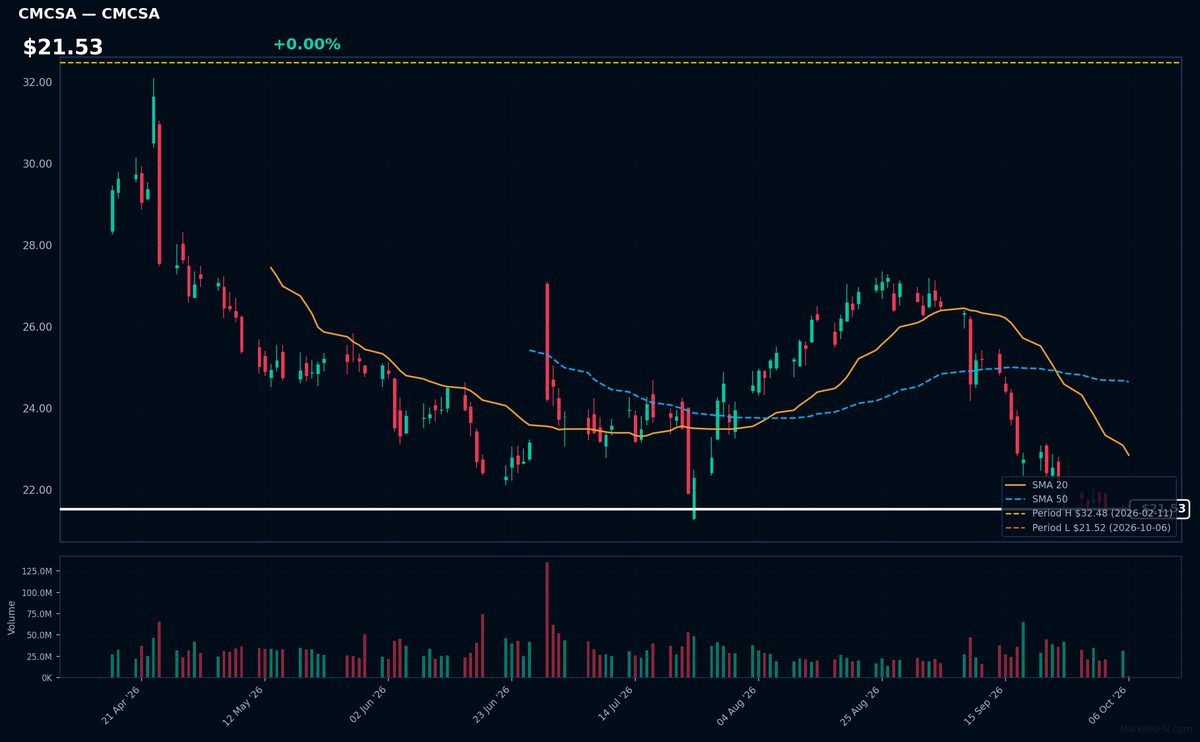
CMCSA | Comcast Corp | Communication Services | Price Last: $21.52 | % Realized: -26.14% | RSI: 26.8 | % above MA200: -19.2% | Trend: Below MA20, MA50, MA200
Comcast Corp (CMCSA) operates as a global media and technology conglomerate, dominating U.S. broadband and cable TV through Xfinity while expanding into streaming (Peacock) and theme parks (Universal). Investors watch its ability to pivot from legacy cable to high-growth digital services amid cord-cutting pressures.
Technically dire: RSI(14) at 26.8 signals extreme oversold conditions, while bearish MA alignment (price < MA20 < MA50 < MA200) confirms sustained downtrend. At 0.0% above 52-week lows after a -26.1% plunge, this tests critical support — a clear warning, not momentum.
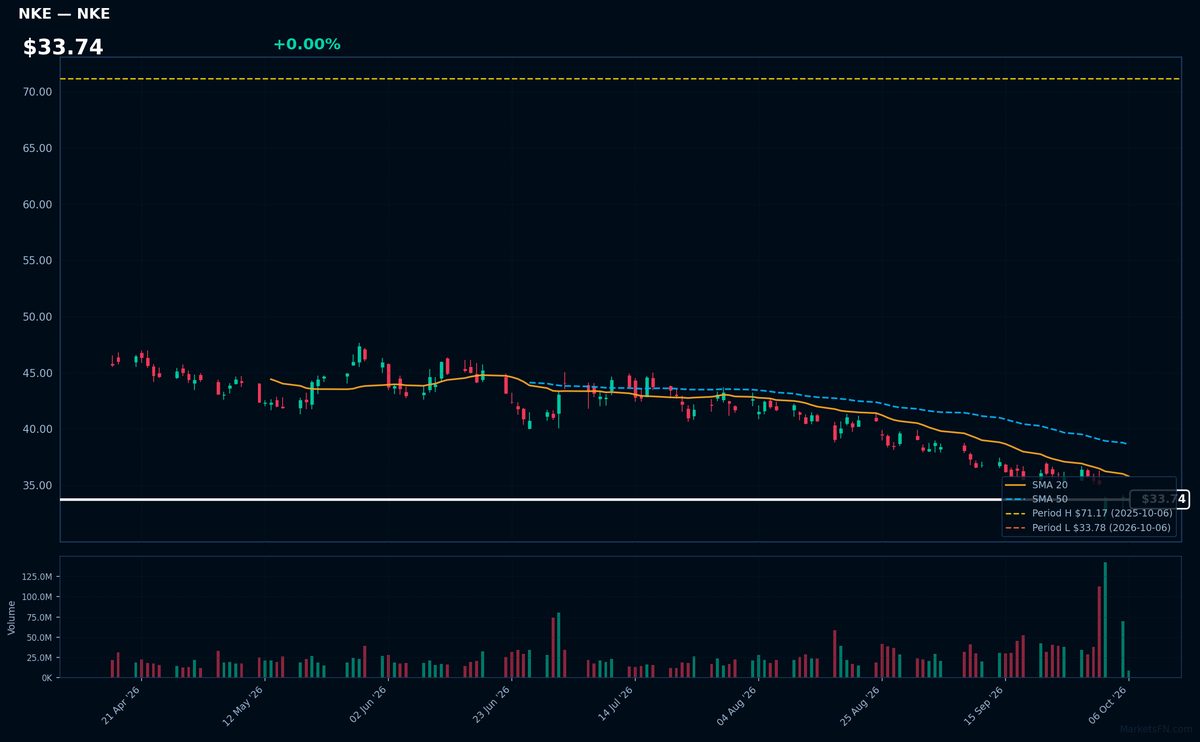
NKE | Nike, Inc | Consumer Cyclical | Price Last: $33.78 | % Realized: -52.54% | RSI: 28.2 | % above MA200: -30.2% | Trend: Below MA20, MA50, MA200
Nike designs, markets, and sells athletic footwear, apparel, and equipment globally. Investors care because it dominates global sportswear with iconic brands (Nike, Jordan, Converse) and direct-to-consumer growth, though recent struggles highlight retail volatility.
Technically dire: RSI(14) at 28.2 (oversold) with bearish MA alignment (price < MA20 < MA50 < MA200) and -52.5% annual return. Testing 52-week lows signals severe weakness.
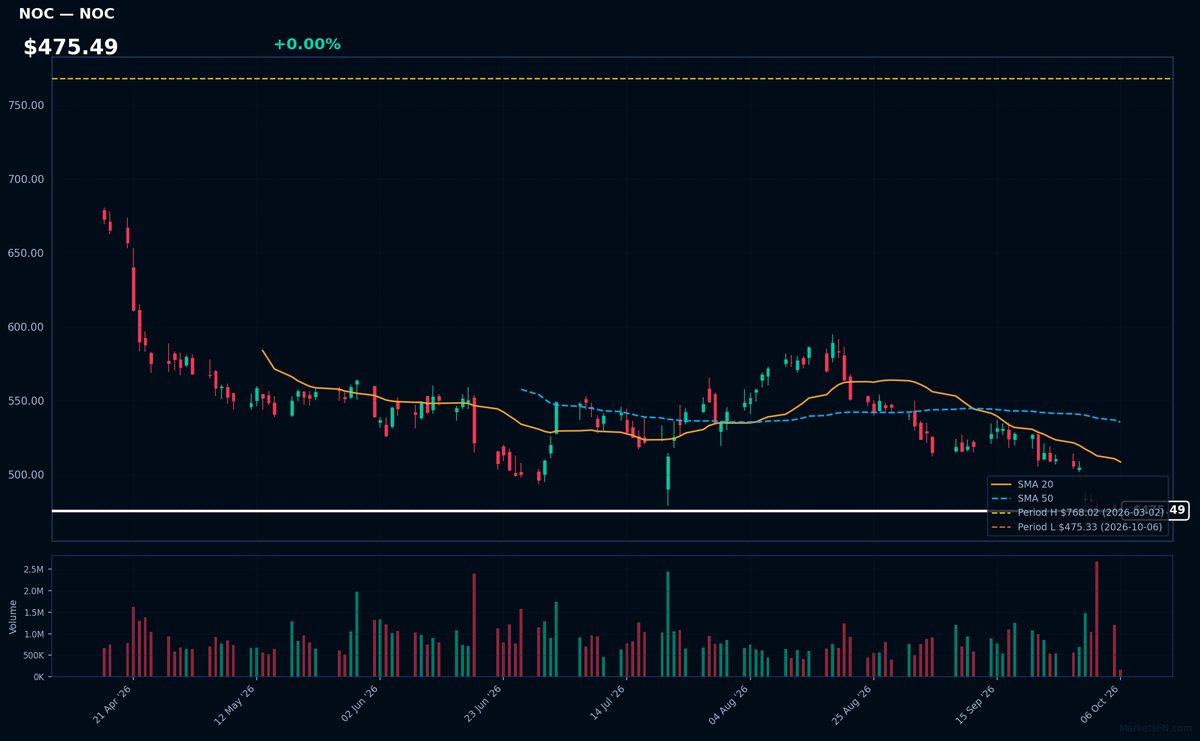
NOC | Northrop Grumman Corp | Industrials | Price Last: $475.33 | % Realized: -23.15% | RSI: 24.1 | % above MA200: -20.4% | Trend: Below MA20, MA50, MA200
Northrop Grumman Corp (NOC) designs advanced defense systems, including stealth bombers and space technologies, for U.S. government contracts. Investors watch its stable revenue from long-term military programs, though budget cycles create volatility.
Technically distressed: RSI(14) at 24.1 (oversold) with bearish MA alignment (price < MA20 < MA50 < MA200). Testing 52-week lows after -23.2% decline — caution warranted.
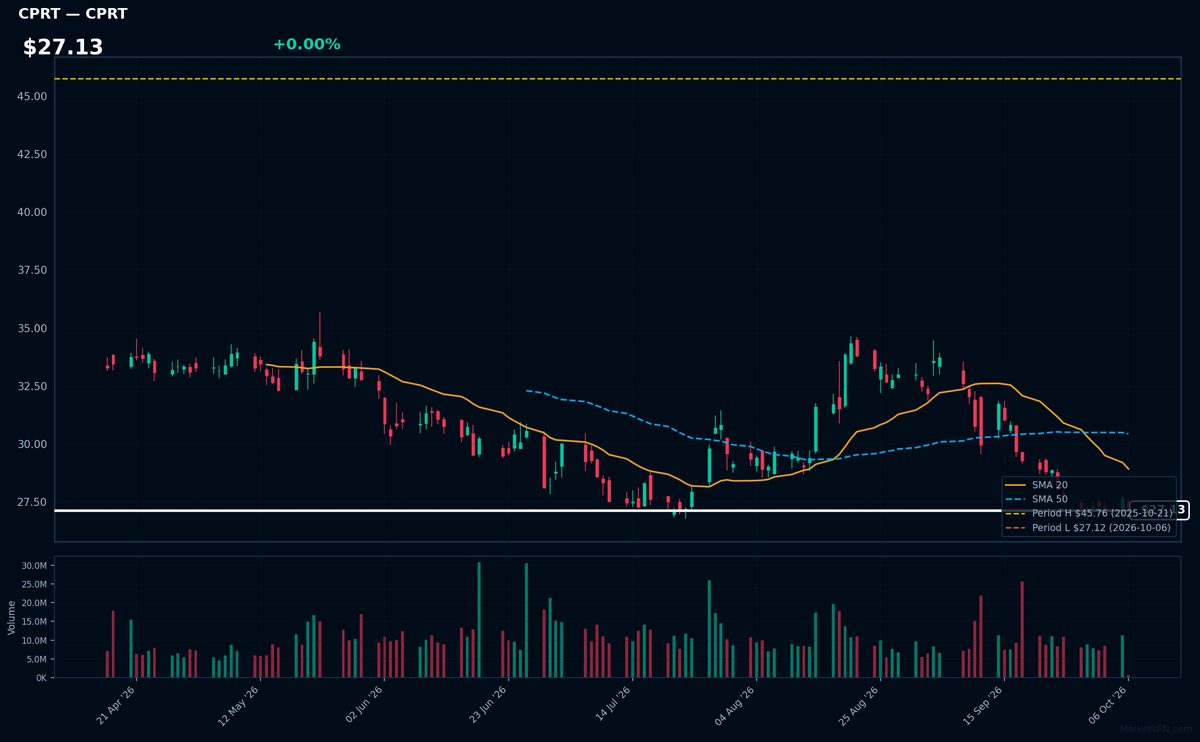
CPRT | Copart, Inc | Industrials | Price Last: $27.12 | % Realized: -38.98% | RSI: 32.9 | % above MA200: -18.7% | Trend: Below MA20, MA50, MA200
Copart operates an online vehicle auction platform, specializing in salvage and used cars for dealers, dismantlers, and insurers. Investors watch it as a cyclical play on auto industry dynamics and insurance claims volume, with asset-light scalability.
Technically dire: RSI(14) at 32.9 shows near-oversold but with bearish MA alignment (price < MA20 < MA50 < MA200) and just 0.0% above 52-week lows after a -39.0% plunge. Pure warning sign.
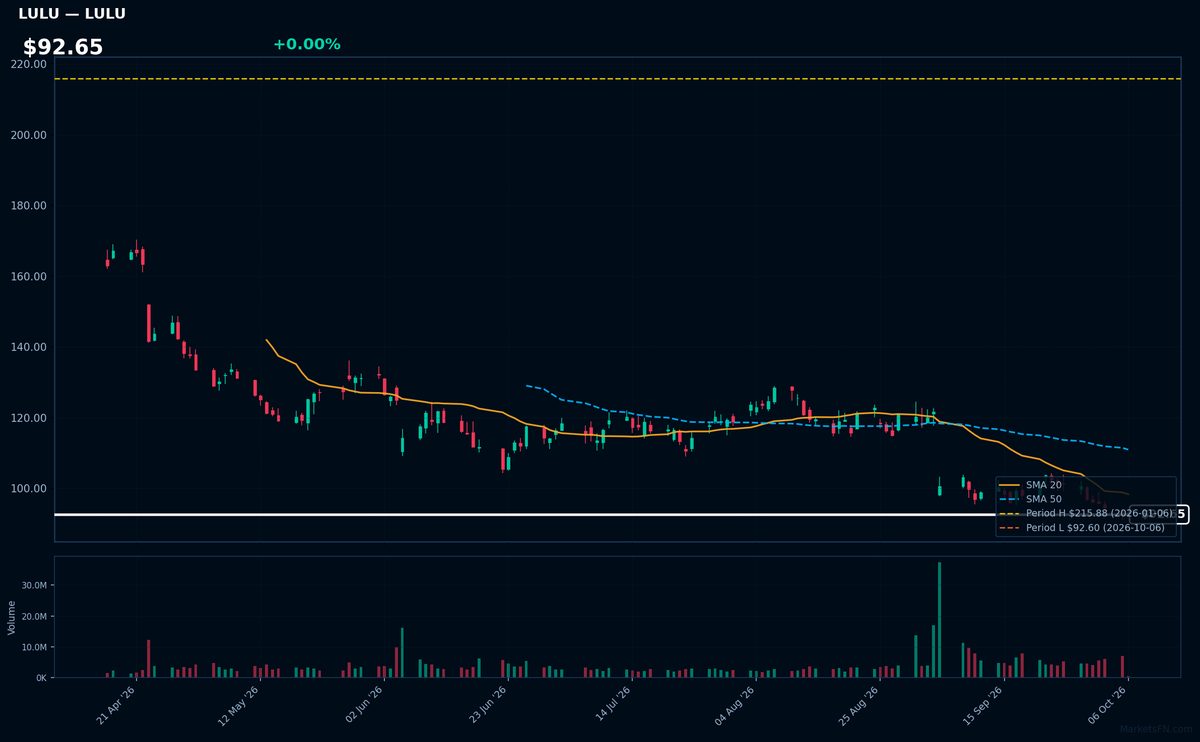
LULU | Lululemon Athletica inc | Consumer Cyclical | Price Last: $92.60 | % Realized: -46.82% | RSI: 31.9 | % above MA200: -35.6% | Trend: Below MA20, MA50, MA200
Lululemon designs premium athletic apparel and accessories, with cult-like brand loyalty in yoga/athleisure. Investors watch its pricing power and international expansion as key growth drivers in the $300B global activewear market.
Technically dire: RSI(14) at 31.9 shows oversold conditions amid bearish MA alignment (price < MA20 < MA50 < MA200). Stock tests 52-week lows after -46.8% plunge — extreme weakness.
Market Commentary
The concentration of S&P 500 stocks at 52-week highs (NVDA, ABBV, AMD, TMO, ANET) reflects persistent strength in tech, semiconductors, biopharma, and life sciences tools—sectors benefiting from AI adoption, resilient healthcare demand, and R&D investment. Conversely, stocks near 52-week lows (CMCSA, NKE, NOC, CPRT, LULU) highlight pressure on consumer discretionary (athleisure, footwear) and media, alongside mixed performance in industrials (defense) and auto salvage, suggesting selective risk-off sentiment amid macro uncertainty.
Sector rotation favors growth and defensives over cyclicals, with mega-cap tech (NVDA, AMD) and healthcare (ABBV, TMO) leading as inflation and rate concerns linger. Weakness in NKE and LULU signals consumer spending fatigue, while CMCSA’s struggles reflect cord-cutting and broadband competition. Defense contractor NOC near lows may indicate budget uncertainty, contrasting with industrials like ANET thriving on cloud/AI infrastructure spend.
Key levels to watch include the 52-week highs for NVDA and AMD as AI momentum indicators, and NKE/LULU’s ability to hold lows amid consumer sentiment shifts. Catalysts include earnings revisions (semiconductors, biotech), Fed policy, and discretionary spending trends. A break below 52-week lows in CPRT or CMCSA could signal broader sector distress.
Methodology: All 503 S&P 500 constituents screened. 52-week high = highest daily close over the past 252 trading days (approx. 1 year). 52-week low = lowest daily close over the same period. Distance = (current price / extreme − 1) × 100. Technical indicators computed on up to 1 year of daily OHLCV data.
Disclaimer: For informational purposes only. Not investment advice. Past performance is not indicative of future results.