S&P 500 52-Week Highs & Lows Radar: Dell (DELL), McDonald's (MCD) and more
MarketsFN Team

S&P 500 52-Week Highs & Lows Radar: Dell (DELL), McDonald's (MCD) and more
Screening all 503 S&P 500 constituents for stocks nearest to their 52-week high and their 52-week low. Data as of September 07, 2026. % Realized = 52-week total return.
Legend: RSI > 70 = overbought · RSI < 30 = oversold · Green % Realized = positive 52W return · Red = negative.
📈 Nearest to 52-Week High
Sectors represented: Energy (2), Technology (1), Communication Services (1), Financial (1)
| Ticker | Company | Sector | Price Last | % Realized | 52-Week High Date | RSI | % above MA200 | Trend |
|---|---|---|---|---|---|---|---|---|
| DELL | Dell Technologies Inc | Technology | $524.14 | +319.88% | 2026-09-04 | 63.7 | +106.8% | Above MA20, MA50, MA200 |
| MPC | Marathon Petroleum Corp | Energy | $388.90 | +115.72% | 2026-09-04 | 77.8 | +60.9% | Above MA20, MA50, MA200 |
| VLO | Valero Energy Corp | Energy | $370.72 | +136.47% | 2026-09-04 | 75.2 | +54.7% | Above MA20, MA50, MA200 |
| EA | Electronic Arts, Inc | Communication Services | $209.70 | +0.38% | 2026-08-04 | — | — | — |
| STT | State Street Corp | Financial | $194.26 | +71.99% | 2026-09-04 | 60.4 | +30.4% | Above MA20, MA50, MA200 |
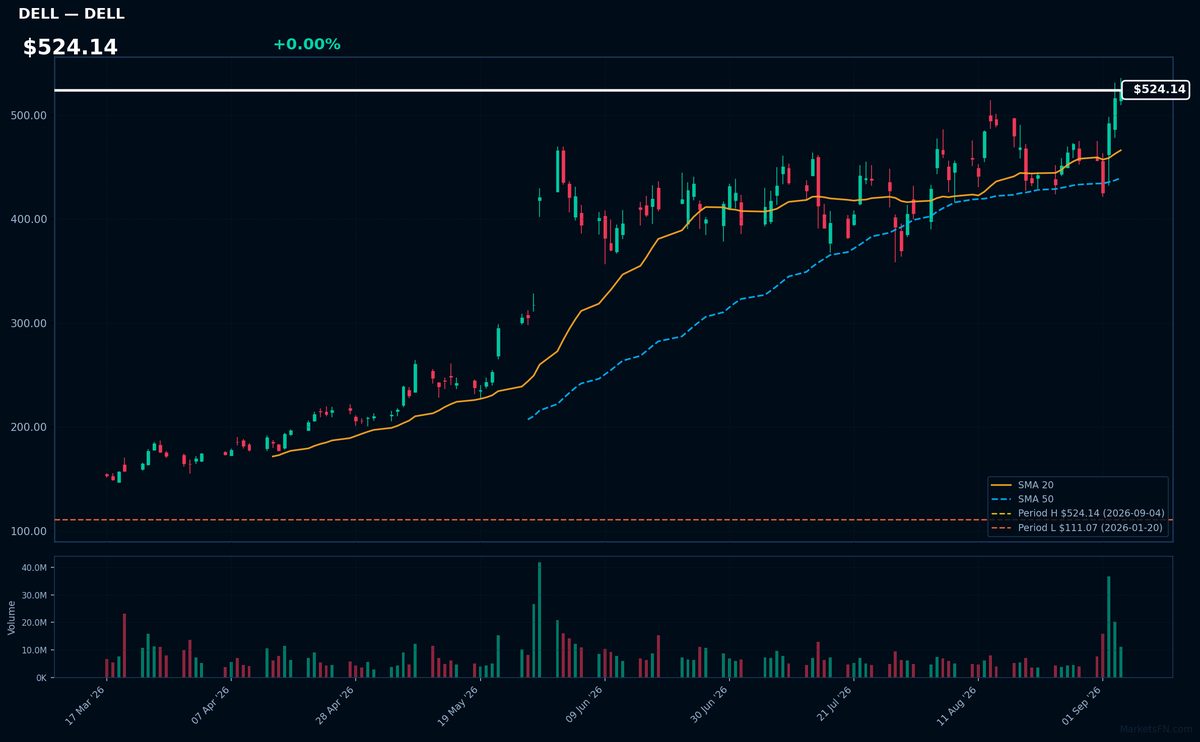
DELL | Dell Technologies Inc | Technology | Price Last: $524.14 | % Realized: +319.88% | RSI: 63.7 | % above MA200: +106.8% | Trend: Above MA20, MA50, MA200
Dell Technologies Inc is a leading technology company that provides a range of products and services including personal computers, data storage solutions, and IT infrastructure. Investors should care about its ability to innovate and adapt in a rapidly changing tech landscape.
Dell's current technical situation indicates strong momentum with an RSI(14) of 63.7 and a bullish MA alignment: price ($524.14) > MA20 > MA50 > MA200, suggesting a sustained uptrend. The stock is near its 52-Week high, 0.0% below, indicating a potential breakout level.
Related headlines
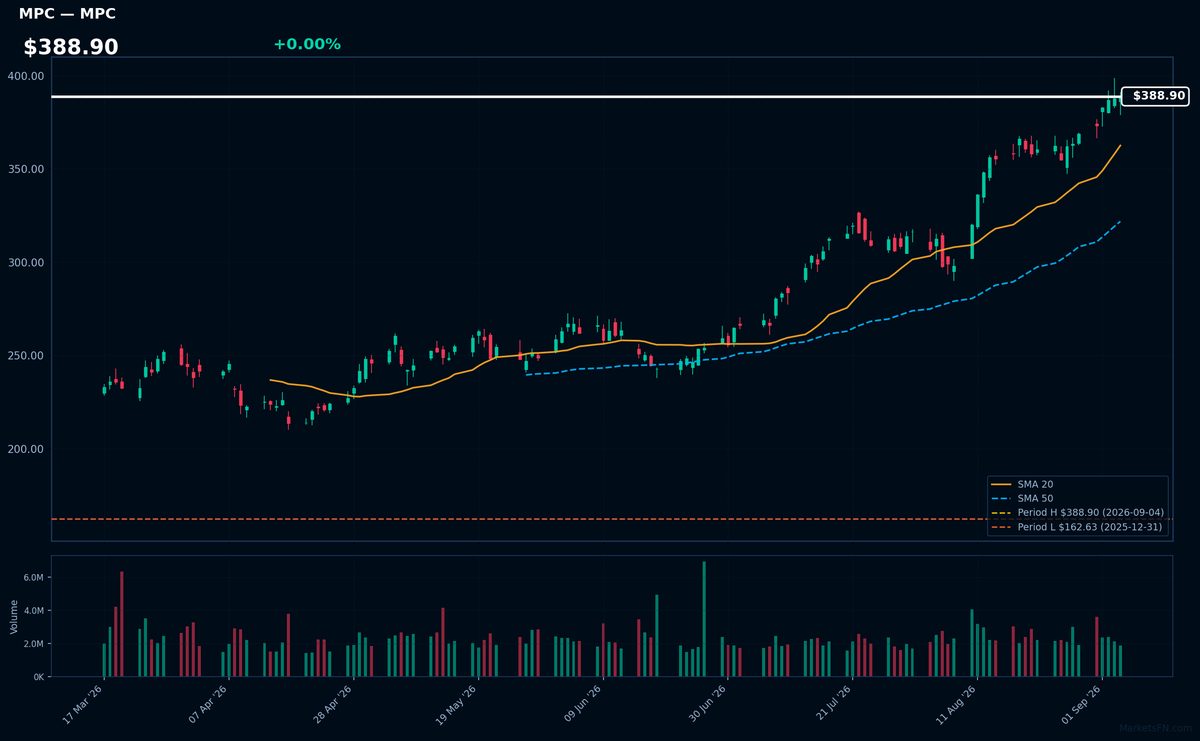
MPC | Marathon Petroleum Corp | Energy | Price Last: $388.90 | % Realized: +115.72% | RSI: 77.8 | % above MA200: +60.9% | Trend: Above MA20, MA50, MA200
Marathon Petroleum Corp is an energy company that refines, markets, and transports petroleum products. Investors should care because its refining and logistics operations are crucial to the energy supply chain, and its performance is tied to global energy demand and refining margins.
The stock exhibits strong bullish momentum with an RSI(14) of 77.8, indicating potential overbought conditions. The MA alignment is bullish (price > MA20 > MA50 > MA200), and the stock is 0.0% below its 52-Week high, suggesting a potential breakout.
Related headlines
- Marathon Petroleum Named a Top 100 Internship Program for the Third Consecutive Year
- PSX, MPC Reportedly Weighed A Giant Merger What Sank The $180B Deal Between Phillips 66 And Marathon Petroleum
- MPC, PSX Stocks Hit All-Time Highs Whats Driving The Rally In These Energy Stocks?
- Marathon Petroleum Corp. stock outperforms competitors on strong trading day
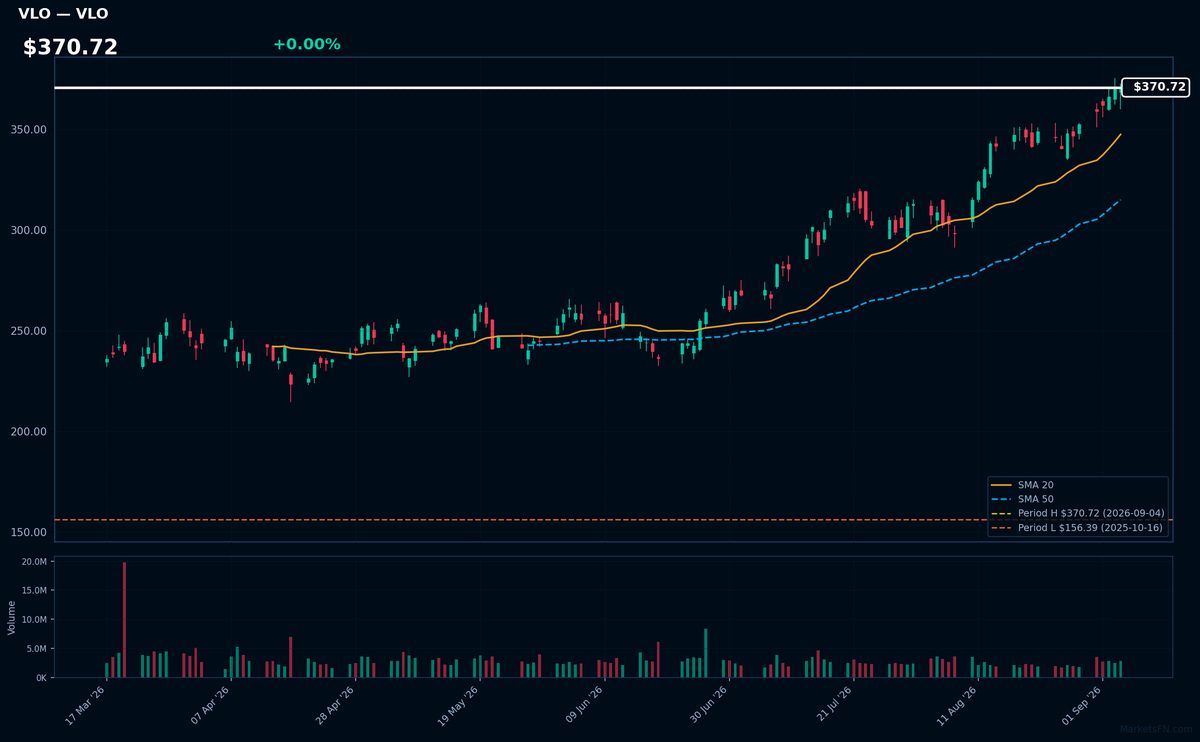
VLO | Valero Energy Corp | Energy | Price Last: $370.72 | % Realized: +136.47% | RSI: 75.2 | % above MA200: +54.7% | Trend: Above MA20, MA50, MA200
Valero Energy Corp is a major refining company that converts crude oil into fuels like gasoline and diesel, operating 15 refineries with a combined throughput capacity of approximately 3.2 million barrels per day, though specifics aren't given here.
Valero Energy Corp's RSI is 75.2, indicating strong momentum as it's near overbought territory; its price is above MA20, MA50, and MA200, showing a sustained uptrend. The stock is 0.0% below its 52-Week high, nearing a potential breakout.
Related headlines
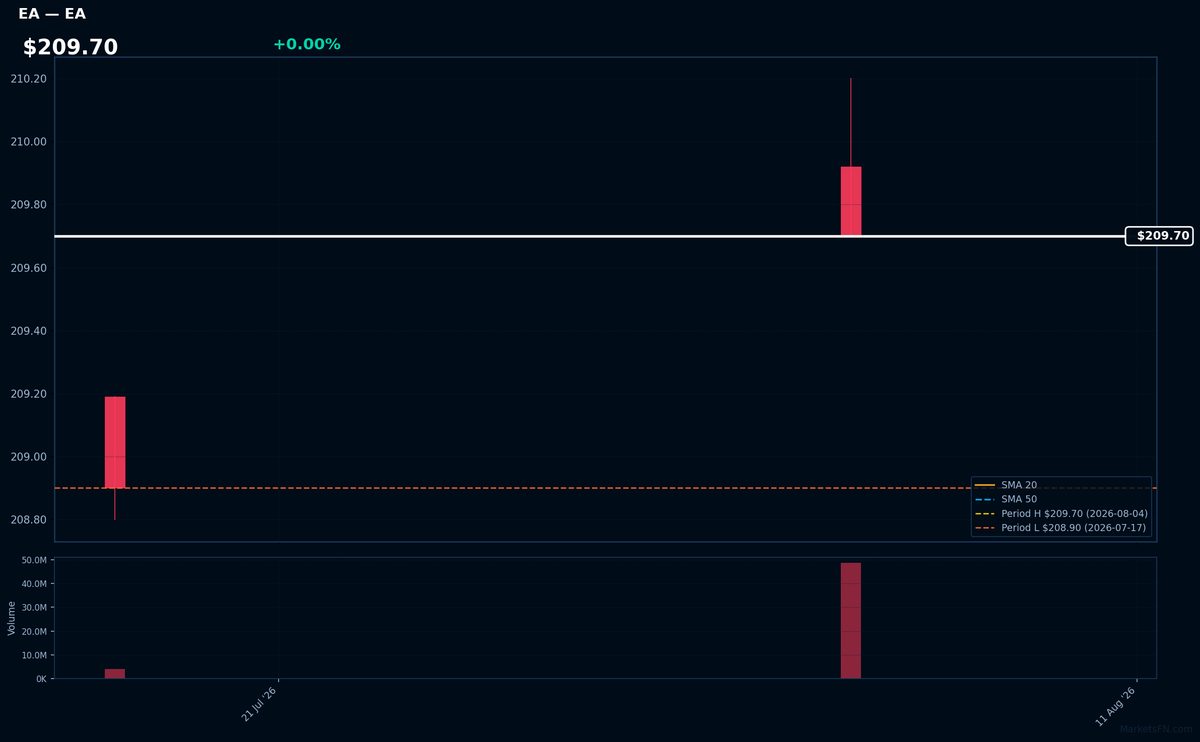
EA | Electronic Arts, Inc | Communication Services | Price Last: $209.70 | % Realized: +0.38% | RSI: — | % above MA200: — | Trend: —
Electronic Arts, Inc (EA) is a leading interactive entertainment software company that develops and publishes games such as Madden NFL, FIFA, and The Sims. Investors should care about its ability to innovate and drive engagement in the gaming industry.
The stock is near its 52-Week high, with a 0.4% return over the period, but MA alignment and RSI(14) data are unavailable for further technical analysis, making it difficult to assess momentum or potential warning signs.
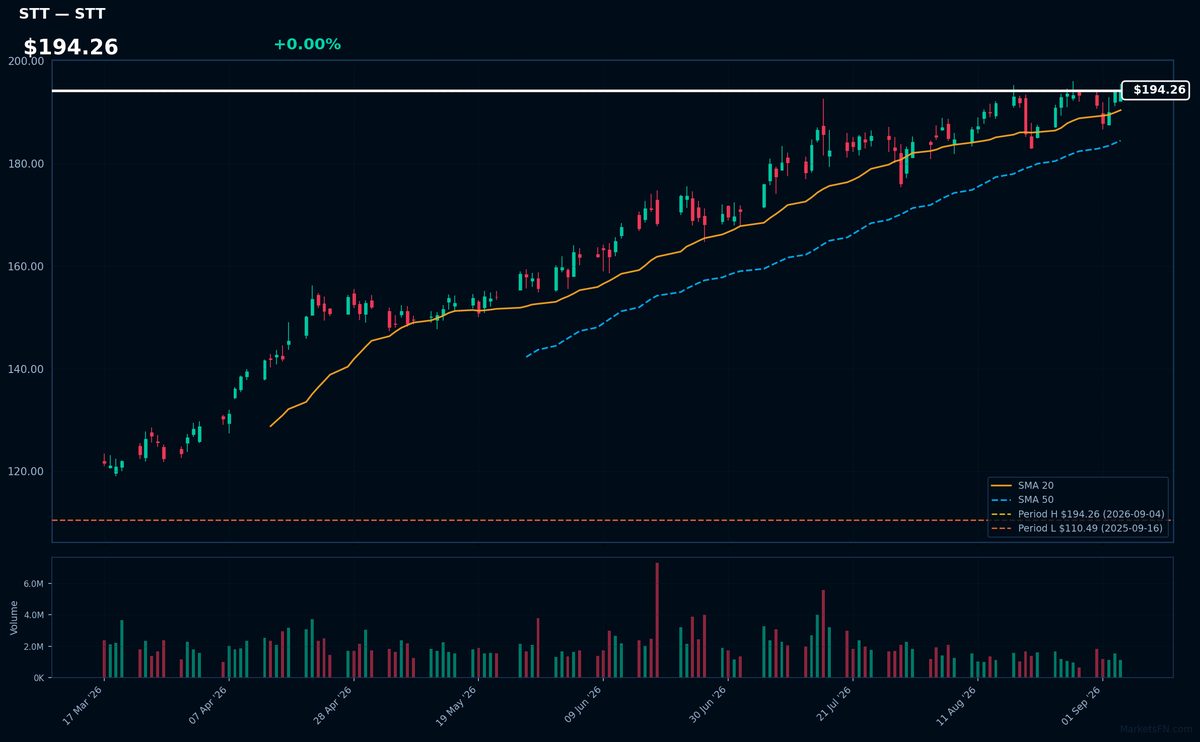
STT | State Street Corp | Financial | Price Last: $194.26 | % Realized: +71.99% | RSI: 60.4 | % above MA200: +30.4% | Trend: Above MA20, MA50, MA200
State Street Corp is a global financial services provider specializing in custody, trust, and investment management services for institutional investors. Investors care due to its critical role in servicing large asset managers and pension funds, generating fee-based revenue.
State Street Corp's technicals indicate sustained uptrend with price > MA20 > MA50 > MA200, RSI(14) at 60.4, and 0.0% below 52-Week high, suggesting momentum; the stock has returned 72.0% over the 52-Week period, reinforcing the uptrend's strength.
Related headlines
📉 Nearest to 52-Week Low
Sectors represented: Consumer Cyclical (2), Industrials (2), Real Estate (1)
| Ticker | Company | Sector | Price Last | % Realized | 52-Week Low Date | RSI | % above MA200 | Trend |
|---|---|---|---|---|---|---|---|---|
| MCD | McDonald's Corp | Consumer Cyclical | $255.69 | -18.67% | 2026-09-04 | 34.3 | -13.6% | Below MA20, MA50, MA200 |
| LHX | L3Harris Technologies Inc | Industrials | $256.45 | -5.85% | 2026-09-04 | 31.7 | -18.4% | Below MA20, MA50, MA200 |
| VICI | VICI Properties Inc | Real Estate | $25.42 | -24.35% | 2026-09-04 | 37.4 | -8.8% | Below MA20, MA50, MA200 |
| XYL | Xylem Inc | Industrials | $105.69 | -24.81% | 2026-09-04 | 29.9 | -14.9% | Below MA20, MA50, MA200 |
| LULU | Lululemon Athletica inc | Consumer Cyclical | $100.61 | -40.04% | 2026-09-04 | 31.8 | -34.1% | Below MA20, MA50, MA200 |
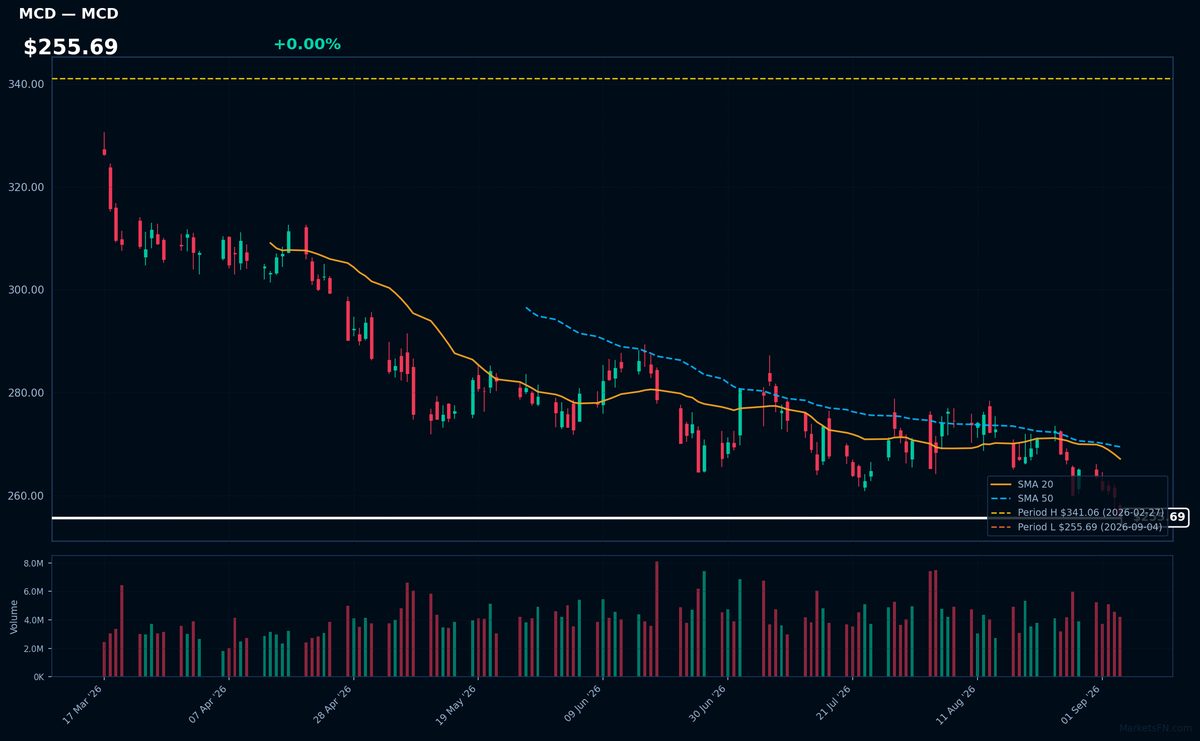
MCD | McDonald's Corp | Consumer Cyclical | Price Last: $255.69 | % Realized: -18.67% | RSI: 34.3 | % above MA200: -13.6% | Trend: Below MA20, MA50, MA200
McDonald's Corp operates and franchises restaurants serving burgers, fries, and beverages. Investors should care about its same-store sales growth, margin expansion, and brand health, as these drive revenue and profitability.
McDonald's Corp is in a sustained downtrend with price ($255.69) below MA20, MA50, and MA200. RSI(14) is 34.3, near oversold territory. The stock is testing major support at its 52-Week low, having lost 18.7% over the past year, indicating a warning sign.
Related headlines
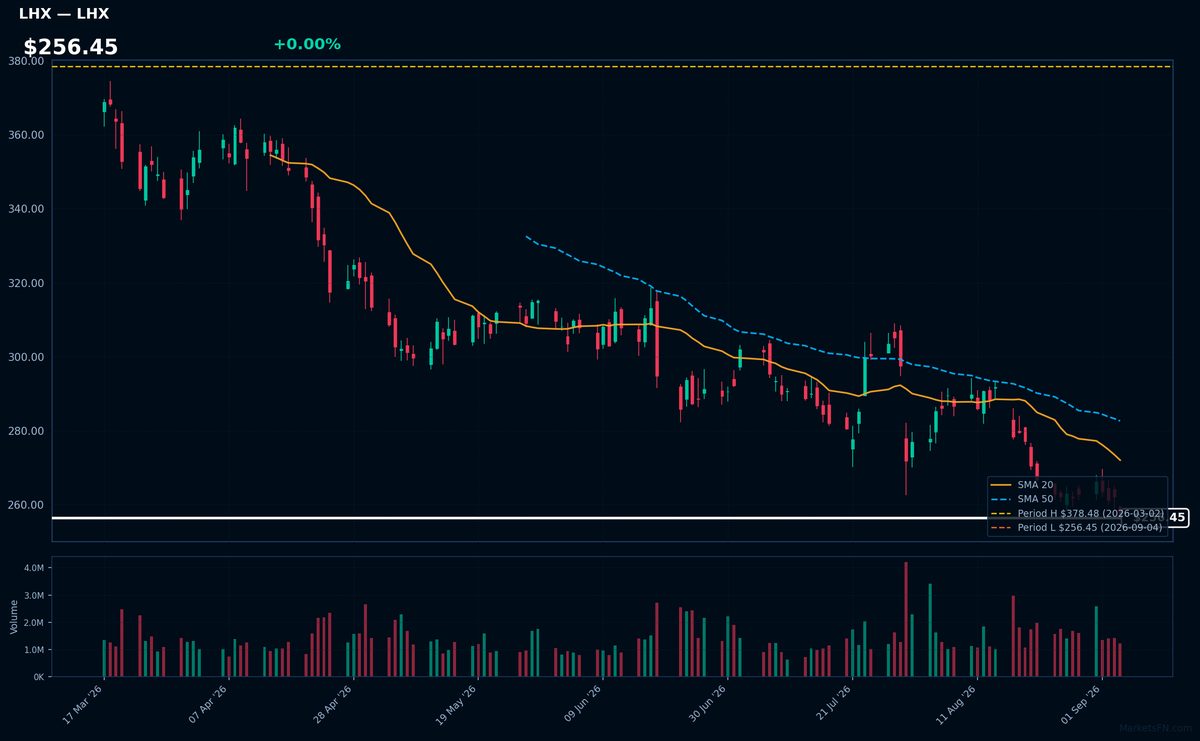
LHX | L3Harris Technologies Inc | Industrials | Price Last: $256.45 | % Realized: -5.85% | RSI: 31.7 | % above MA200: -18.4% | Trend: Below MA20, MA50, MA200
L3Harris Technologies Inc is a defense technology company providing advanced defense and commercial technologies. Investors should care because its products and services are critical to national security and have significant government funding, potentially driving stable revenue.
L3Harris Technologies Inc is testing major support with its price 0.0% above its 52-Week low. The RSI(14) is 31.7, indicating oversold conditions. The MA alignment is bearish with price < MA20 < MA50 < MA200, signaling a sustained downtrend and potential further decline.
Related headlines
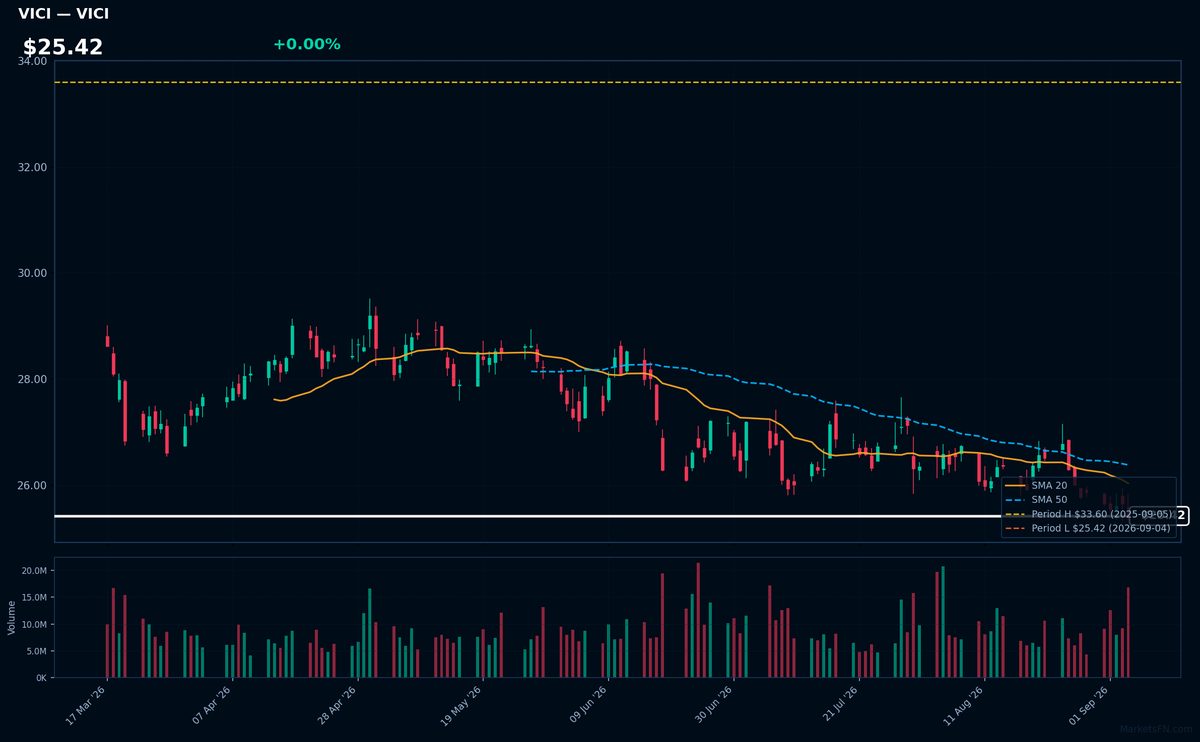
VICI | VICI Properties Inc | Real Estate | Price Last: $25.42 | % Realized: -24.35% | RSI: 37.4 | % above MA200: -8.8% | Trend: Below MA20, MA50, MA200
VICI Properties Inc is a real estate investment trust (REIT) that owns and acquires entertainment, hospitality, and gaming properties. Investors care about its performance as it reflects the health of the gaming and leisure industry.
VICI's technicals indicate a sustained downtrend with price at $25.42, below MA20, MA50, and MA200. RSI(14) is 37.4, near oversold territory, and the stock is 0.0% above its 52-Week low, testing major support, warning of potential further decline.
Related headlines
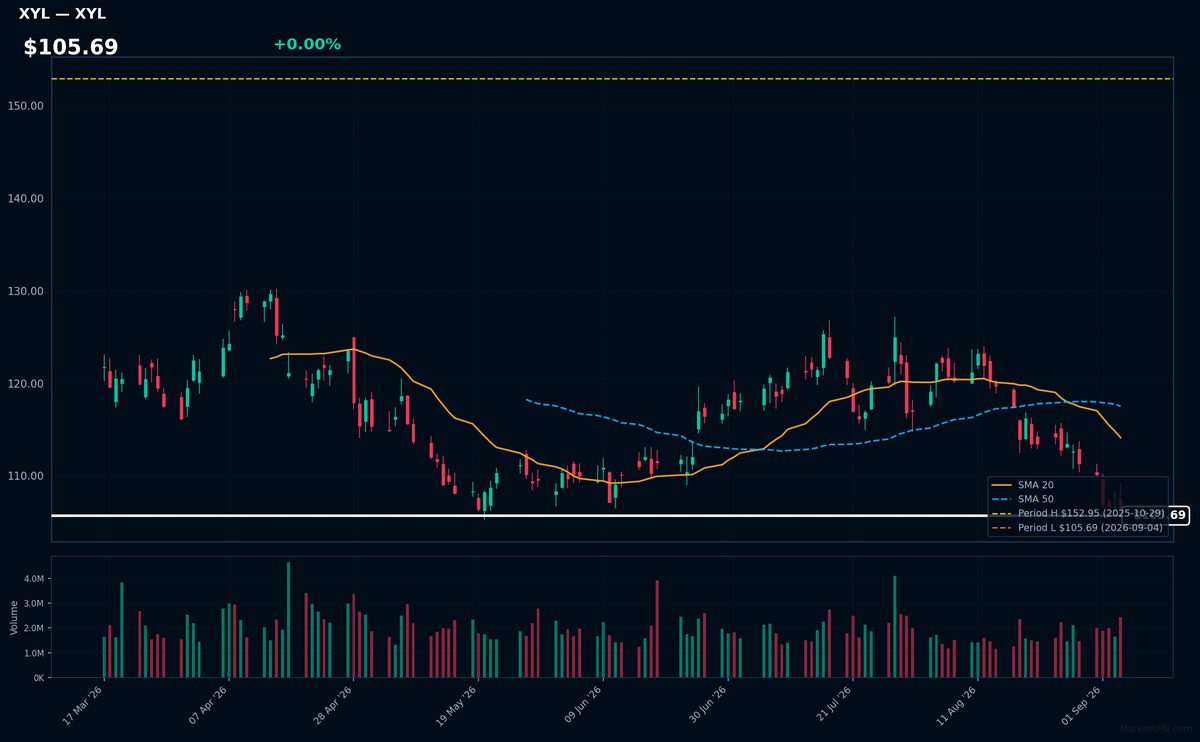
XYL | Xylem Inc | Industrials | Price Last: $105.69 | % Realized: -24.81% | RSI: 29.9 | % above MA200: -14.9% | Trend: Below MA20, MA50, MA200
Xylem Inc (XYL) is a water technology company providing solutions for water management, treatment, and testing. Investors should care as the company addresses critical global water challenges, offering a range of products and services that could drive long-term growth.
XYL's technical situation is bearish, with an RSI(14) of 29.9 indicating oversold conditions, and a sustained downtrend as price ($105.69) remains below MA20, MA50, and MA200, with the stock testing major support at its 52-Week low.
Related headlines
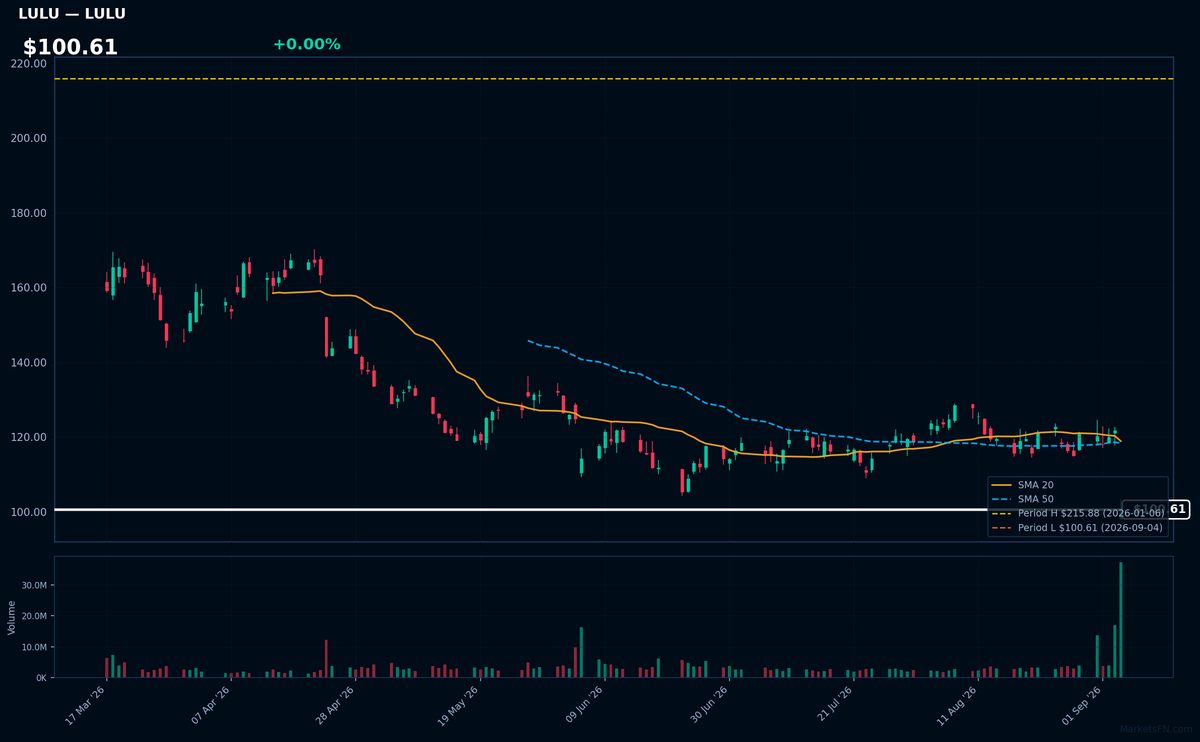
LULU | Lululemon Athletica inc | Consumer Cyclical | Price Last: $100.61 | % Realized: -40.04% | RSI: 31.8 | % above MA200: -34.1% | Trend: Below MA20, MA50, MA200
Lululemon Athletica inc is a premium athletic apparel retailer. Investors should care about its performance as it indicates demand for high-end fitness wear and the company's ability to maintain its brand premium amidst competition.
Lululemon's RSI is 31.8, indicating oversold conditions. It's below MA20, MA50, and MA200, showing mixed signals. The stock is at its 52-Week low, having lost 40.0% over the period, potentially a warning sign.
Related headlines
Market Commentary
The S&P 500 stocks listed are currently trading near their 52-week extremes, with some at highs and others at lows. Stocks like DELL, MPC, and EA are at their 52-week highs, while MCD, LHX, and LULU are at their 52-week lows. This indicates a significant price movement, potentially driven by fundamental factors or market sentiment.
The stocks near 52-week highs are from diverse sectors, including technology (DELL, EA) and energy (MPC). Those near 52-week lows are also from various sectors, including consumer staples (MCD), industrials (LHX), and consumer discretionary (LULU). This suggests sector rotation and potential macro themes driving these price levels, such as changes in energy demand or consumer behavior.
Key levels to watch include the sustainability of these extreme price levels. For stocks at 52-week highs, a failure to maintain these levels could signal a reversal. For those at 52-week lows, a bounce could indicate a potential buying opportunity. Catalysts to watch include earnings reports, industry trends, and broader market sentiment shifts that could impact these stocks.
Methodology: All 503 S&P 500 constituents screened. 52-week high = highest daily close over the past 252 trading days (approx. 1 year). 52-week low = lowest daily close over the same period. Distance = (current price / extreme − 1) × 100. Technical indicators computed on up to 1 year of daily OHLCV data.
Disclaimer: For informational purposes only. Not investment advice. Past performance is not indicative of future results.