S&P 500 52-Week Highs & Lows Radar: Conoco Phillips (COP), L3Harris (LHX) and more
MarketsFN Team

S&P 500 52-Week Highs & Lows Radar: Conoco Phillips (COP), L3Harris (LHX) and more
Screening all 503 S&P 500 constituents for stocks nearest to their 52-week high and their 52-week low. Data as of August 21, 2026. % Realized = 52-week total return.
Legend: RSI > 70 = overbought · RSI < 30 = oversold · Green % Realized = positive 52W return · Red = negative.
📈 Nearest to 52-Week High
Sectors represented: Energy (2), Basic Materials (1), Healthcare (1), Communication Services (1)
| Ticker | Company | Sector | Price Last | % Realized | 52-Week High Date | RSI | % above MA200 | Trend |
|---|---|---|---|---|---|---|---|---|
| COP | Conoco Phillips | Energy | $135.21 | +42.66% | 2026-08-21 | 74.2 | +22.4% | Above MA20, MA50, MA200 |
| EOG | EOG Resources, Inc | Energy | $152.22 | +28.44% | 2026-08-21 | 64.7 | +20.1% | Above MA20, MA50, MA200 |
| FCX | Freeport-McMoRan Inc | Basic Materials | $77.19 | +85.03% | 2026-08-21 | 69.8 | +30.5% | Above MA20, MA50, MA200 |
| BDX | Becton Dickinson & Co | Healthcare | $189.12 | +22.35% | 2026-08-21 | 76.5 | +20.0% | Above MA20, MA50, MA200 |
| EA | Electronic Arts, Inc | Communication Services | $209.70 | +0.38% | 2026-08-04 | — | — | — |
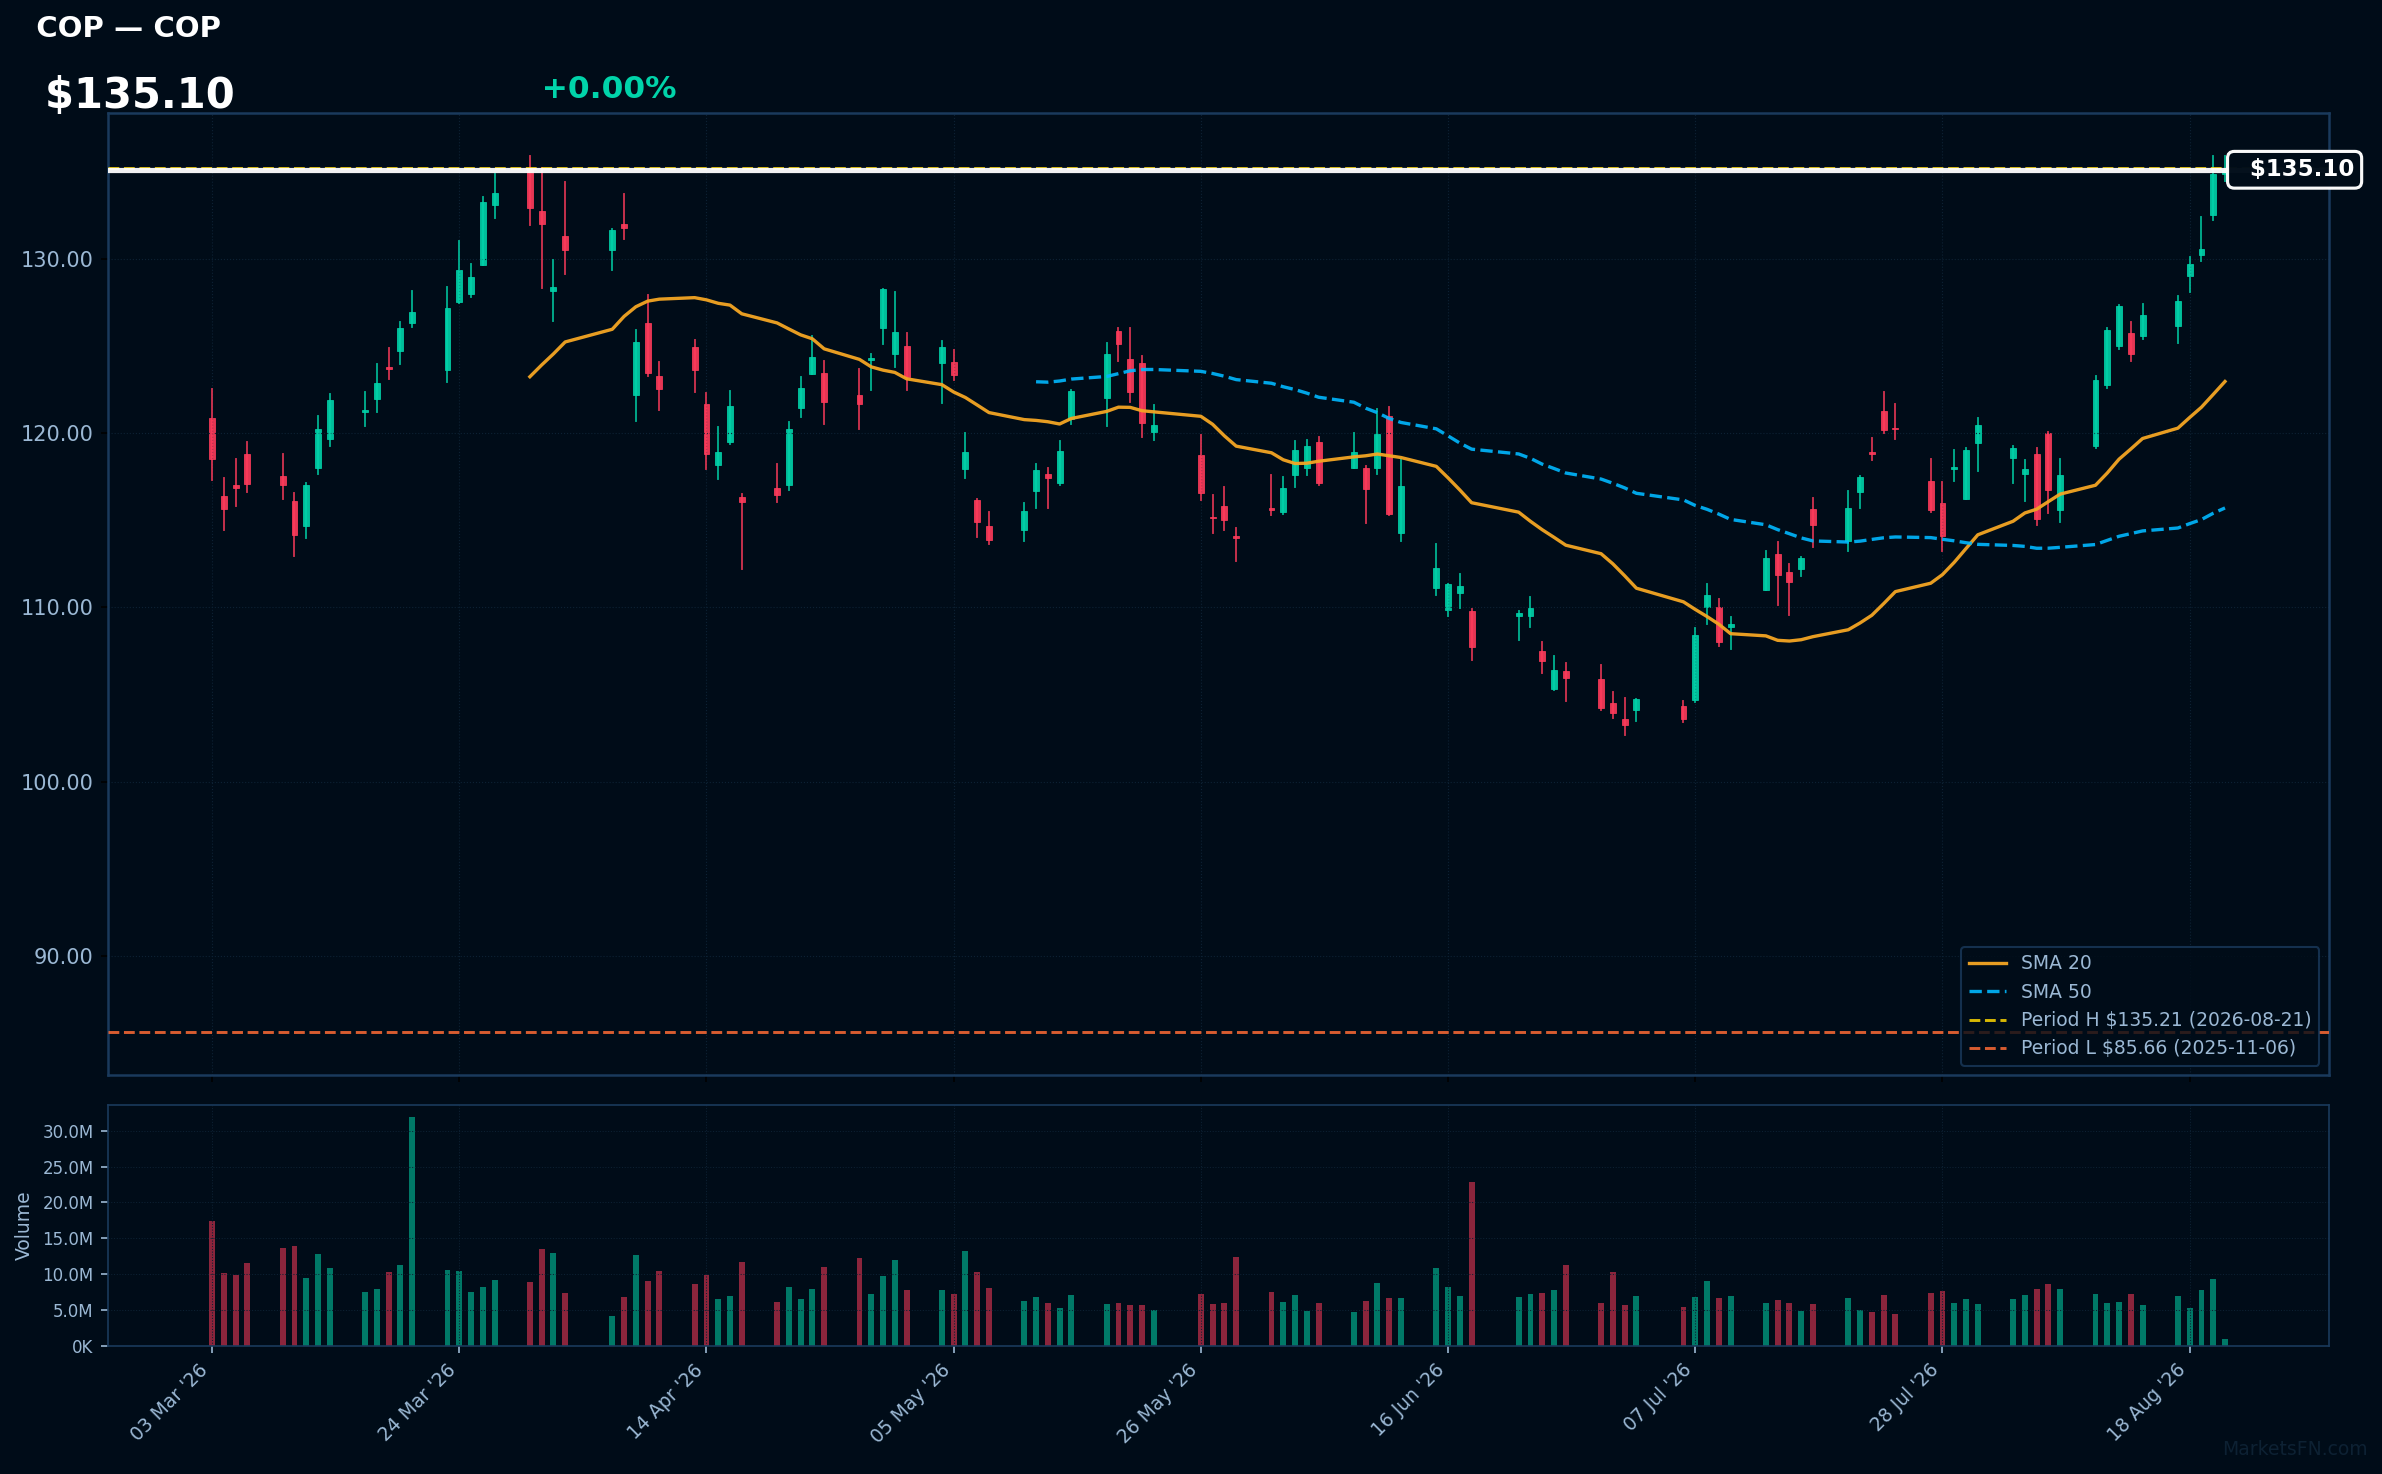
COP | Conoco Phillips | Energy | Price Last: $135.21 | % Realized: +42.66% | RSI: 74.2 | % above MA200: +22.4% | Trend: Above MA20, MA50, MA200
ConocoPhillips (COP) is a leading independent exploration and production company, focusing on oil and natural gas. Investors should care due to its significant role in energy markets and potential for strong returns, especially amid fluctuating commodity prices.
The current technical situation indicates bullish momentum, with an RSI(14) of 74.2 and a bullish MA alignment: price > MA20 > MA50 > MA200. The stock is also 0.0% below its 52-Week high.
Related headlines
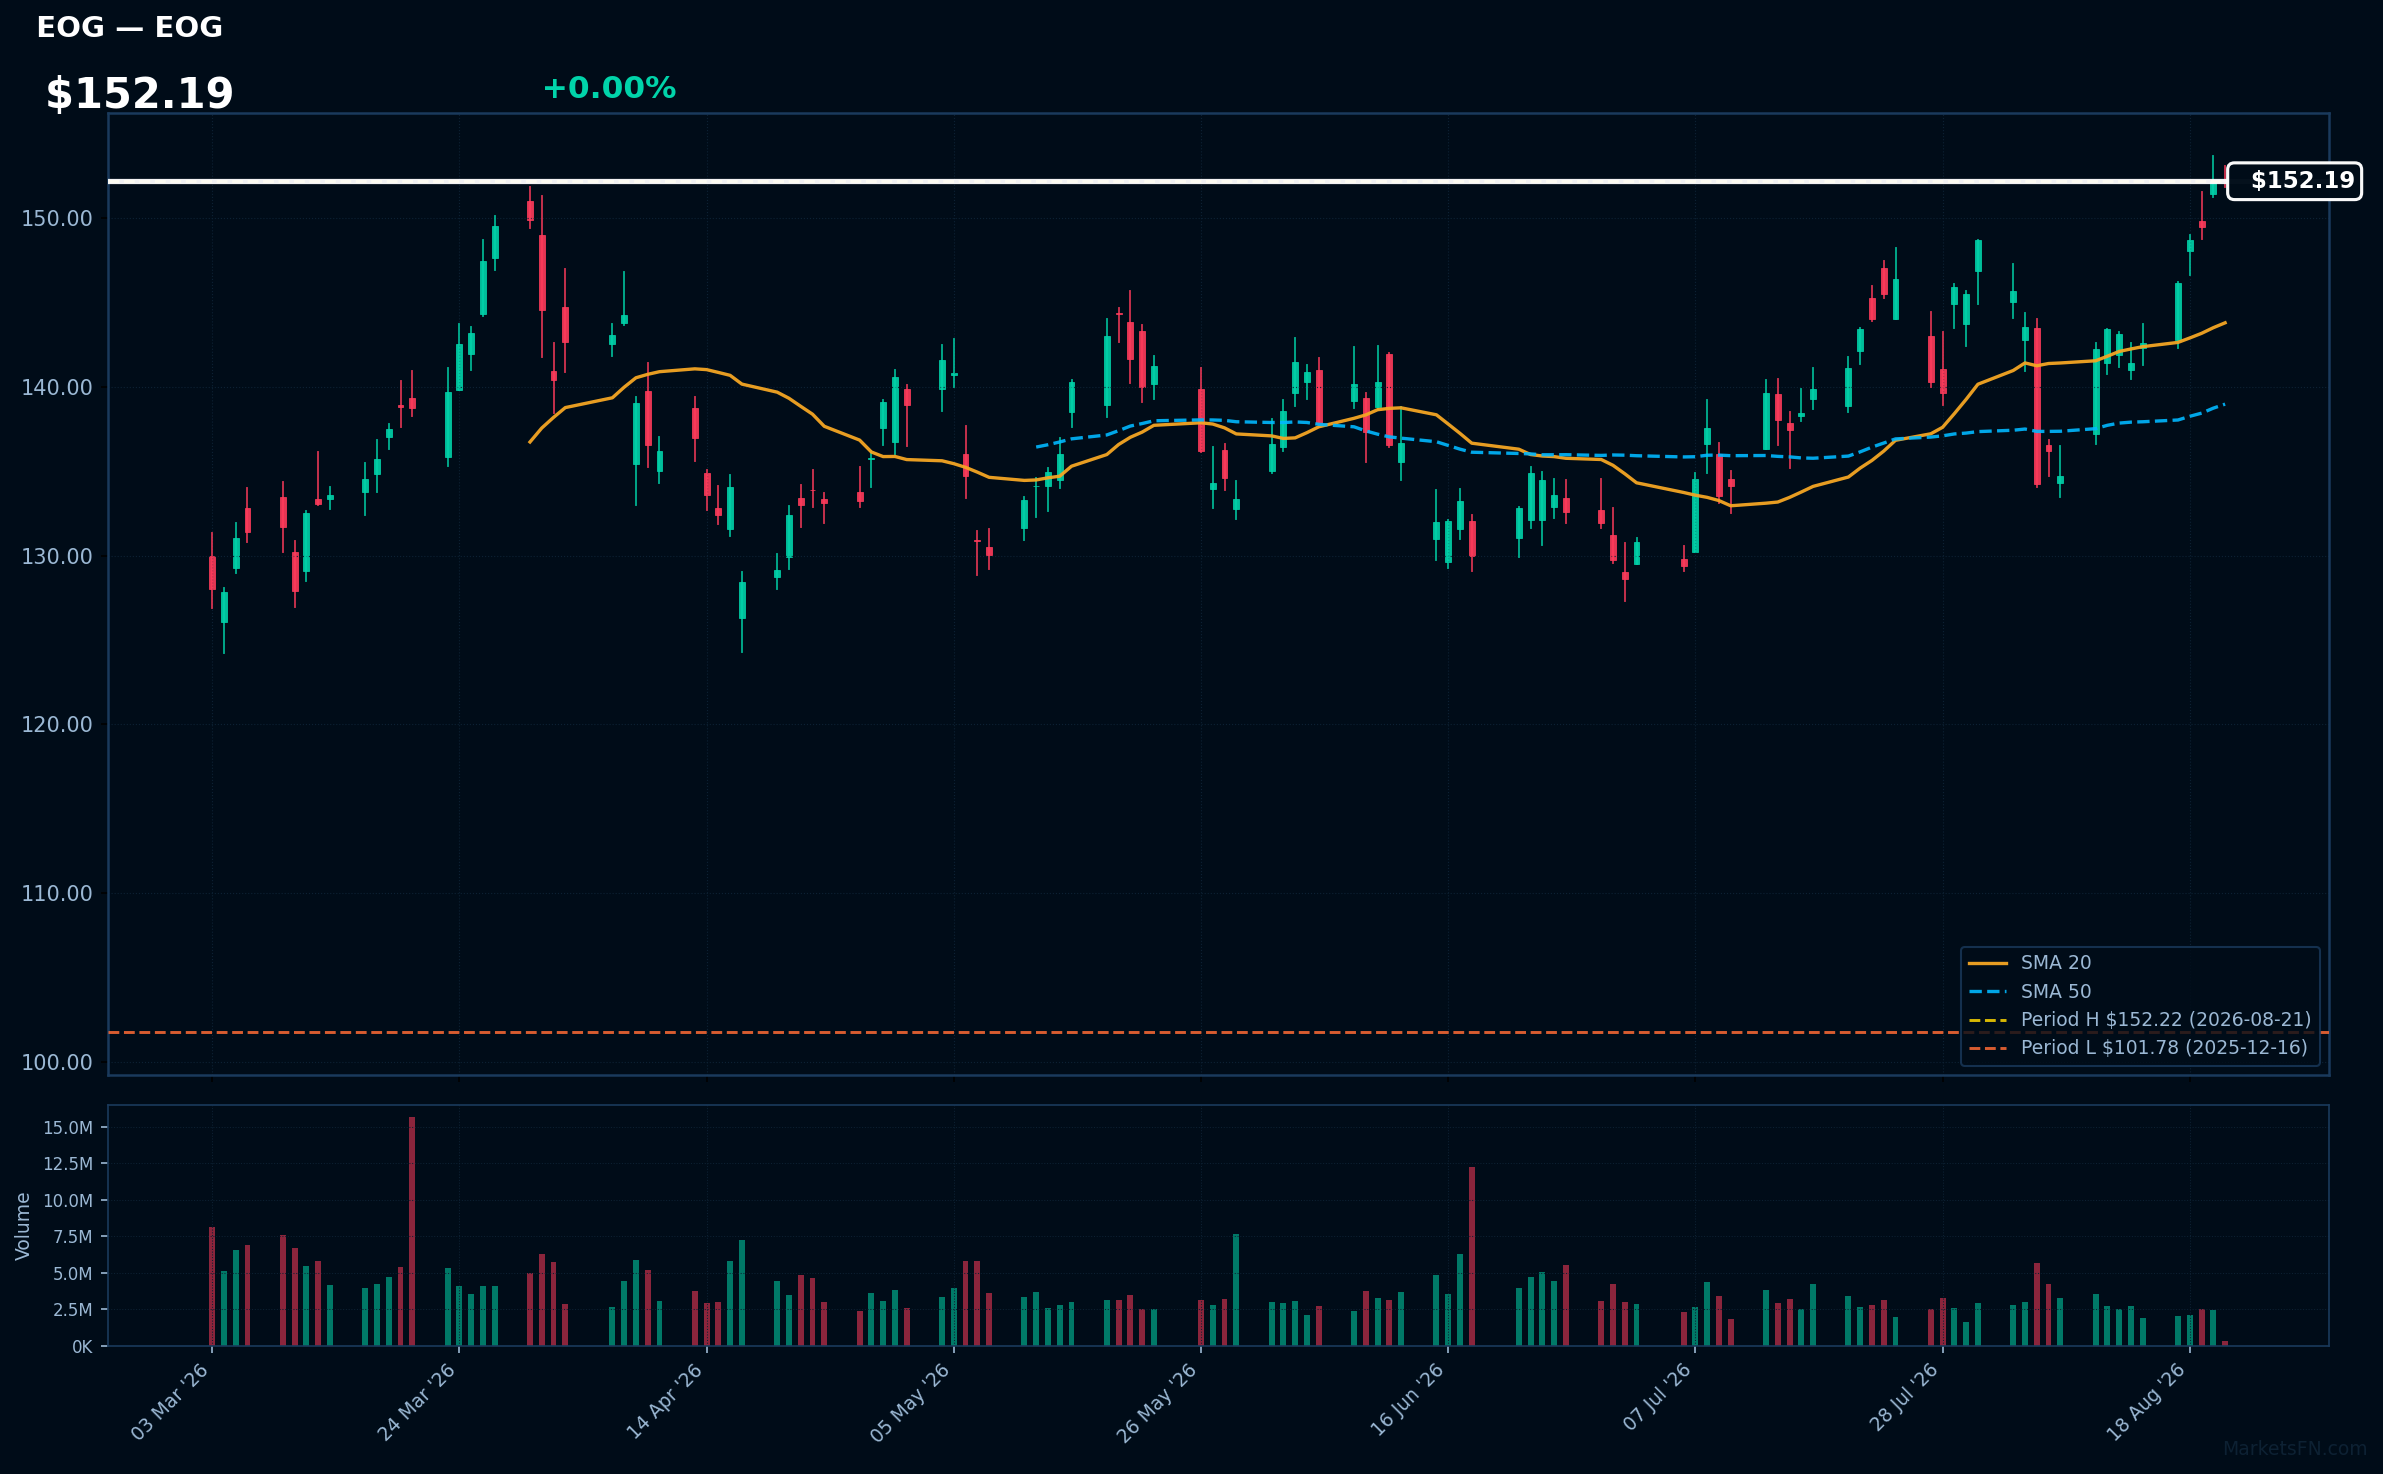
EOG | EOG Resources, Inc | Energy | Price Last: $152.22 | % Realized: +28.44% | RSI: 64.7 | % above MA200: +20.1% | Trend: Above MA20, MA50, MA200
EOG Resources, Inc. is a leading oil and natural gas exploration and production company. Investors should care due to its strong operational efficiency and significant returns, as evidenced by a 28.4% period return over the past 52 weeks.
The current technical situation shows bullish momentum with an RSI(14) of 64.7 and a bullish MA alignment: price > MA20 > MA50 > MA200. The stock is also 0.0% below its 52-Week high, indicating a potential breakout.
Related headlines
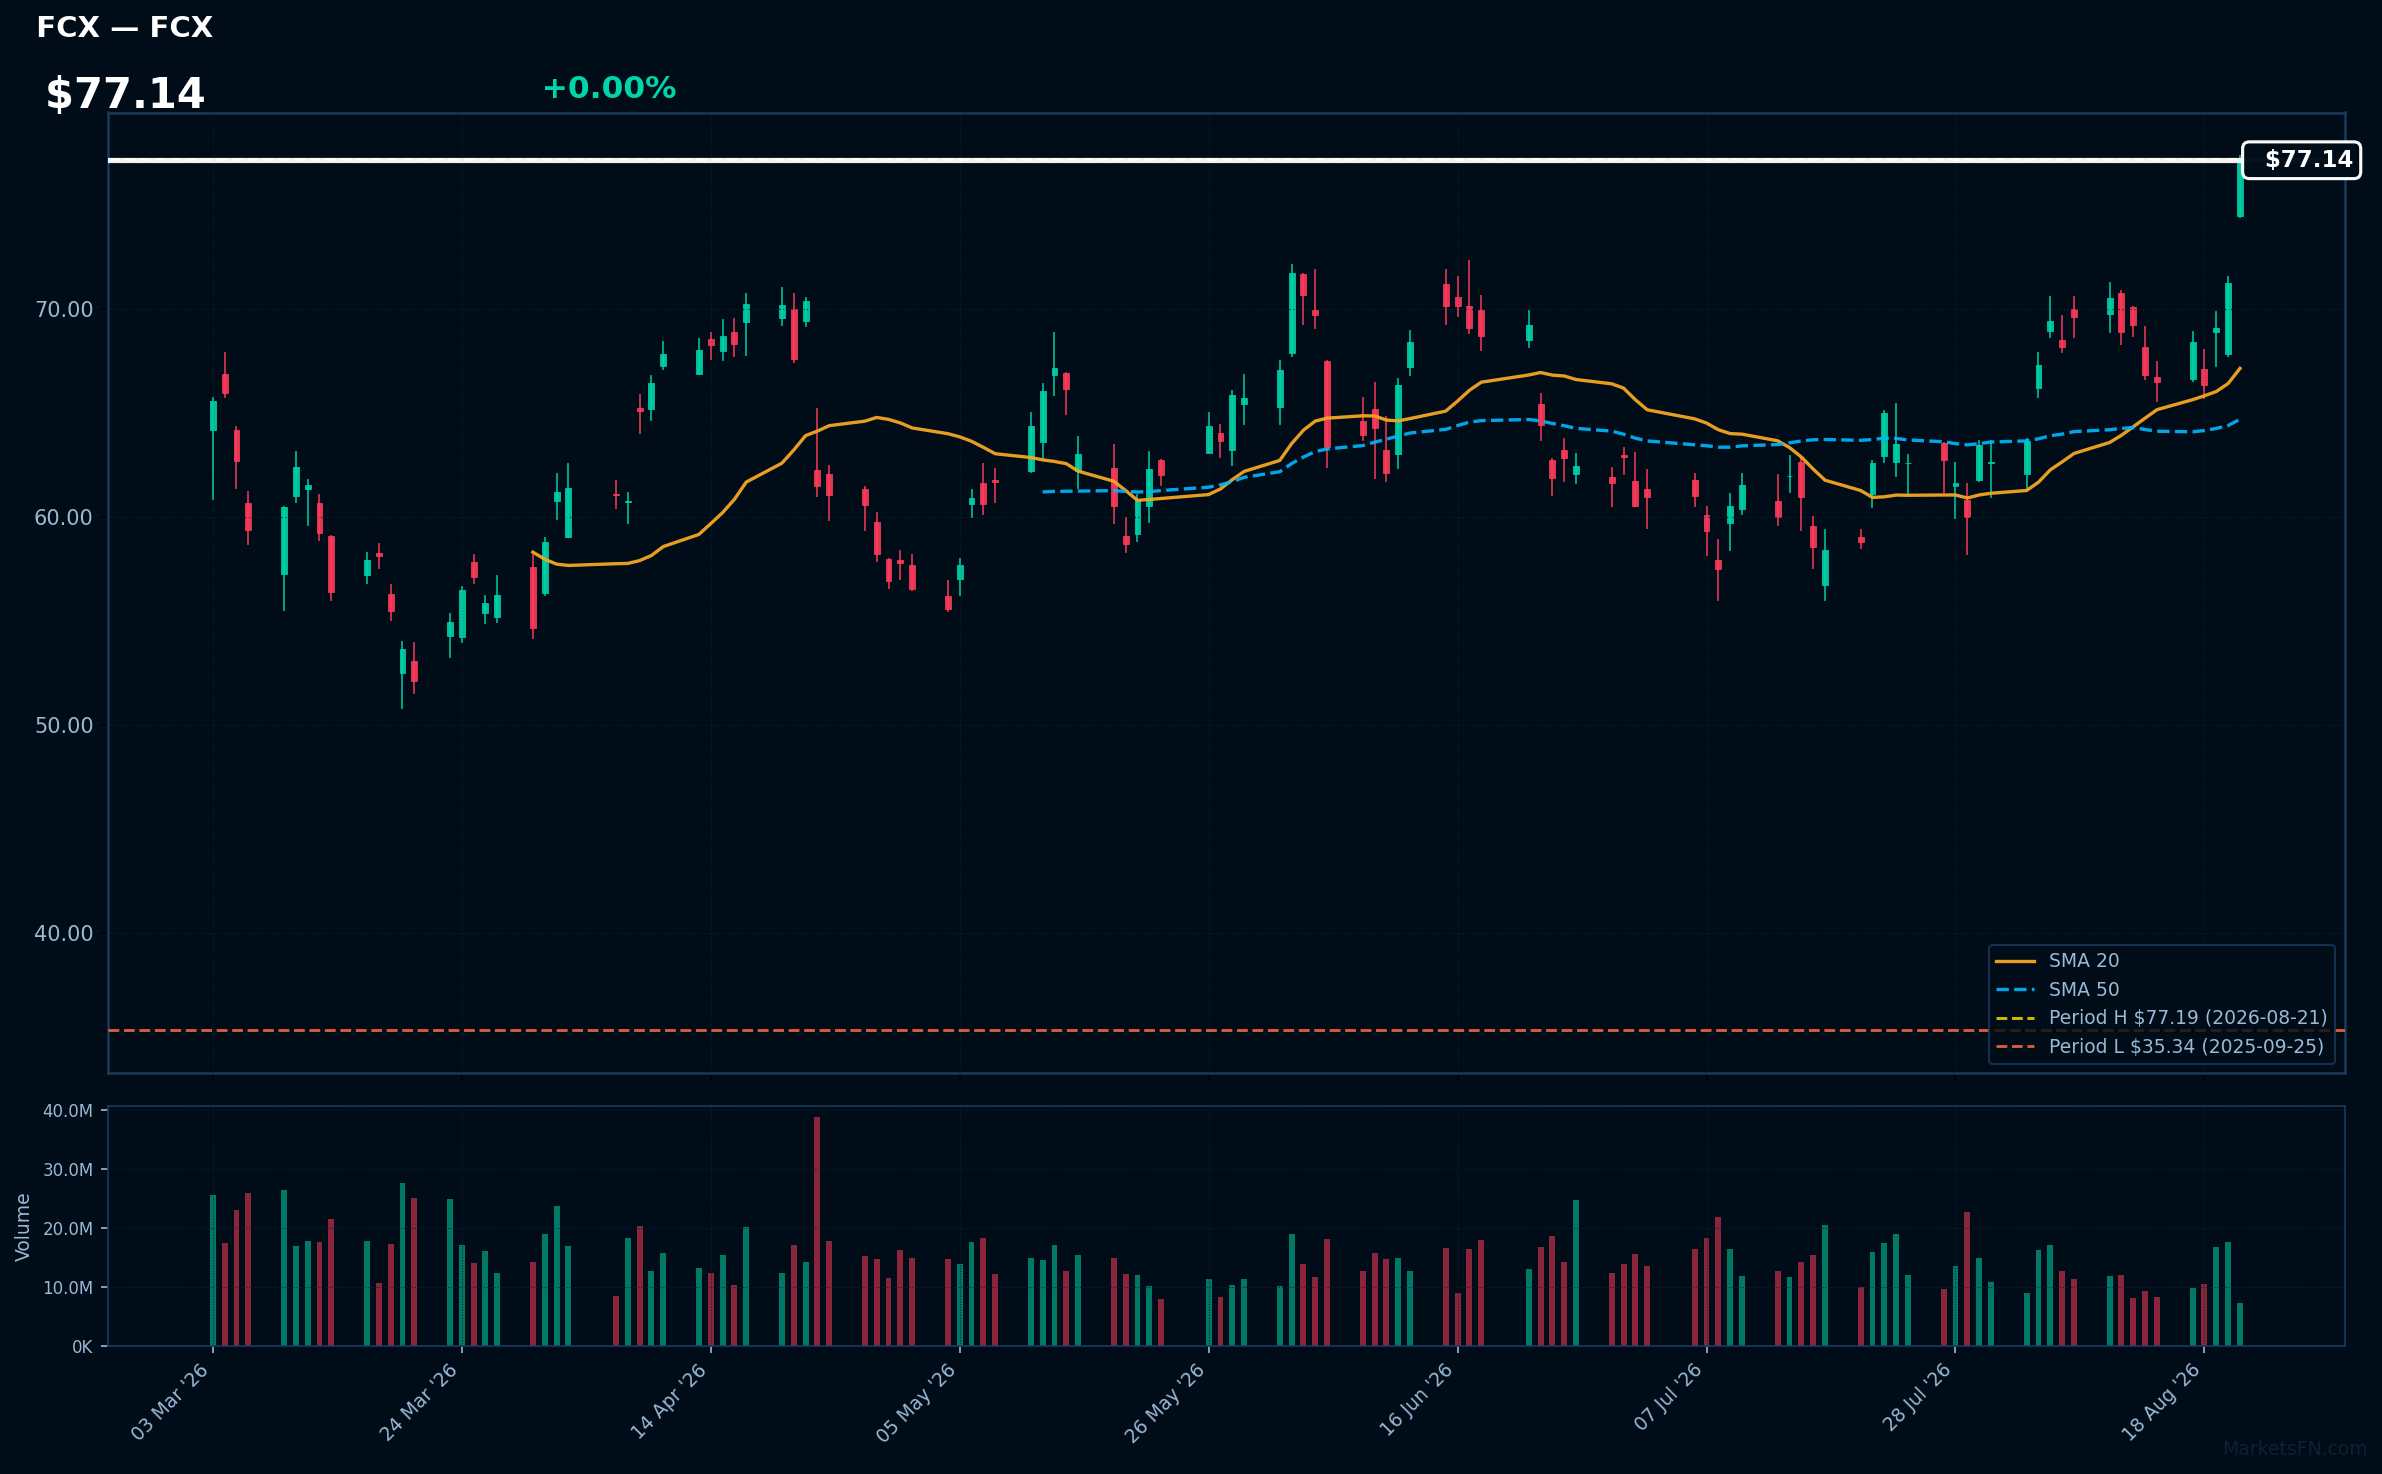
FCX | Freeport-McMoRan Inc | Basic Materials | Price Last: $77.19 | % Realized: +85.03% | RSI: 69.8 | % above MA200: +30.5% | Trend: Above MA20, MA50, MA200
Freeport-McMoRan Inc (FCX) is a leading international mining company, primarily engaged in the production of copper, gold, and molybdenum. Investors should care due to its significant role in the global metals market and its exposure to commodity price fluctuations, which can impact profitability.
The current technical situation indicates strong momentum, with an RSI(14) of 69.8 and a bullish MA alignment: price > MA20 > MA50 > MA200. The stock is also 0.0% below its 52-Week high, suggesting a potential breakout.
Related headlines
- Freeport-McMoRan Inc (FCX) Q2 2026 Earnings Call Highlights: Strong Income Growth and Strategic ...
- Freeport-McMoRan shares slip despite second quarter earnings beat as copper outlook softens
- FCX Stock Falls Amid Soft Q3 Outlook As Copper Price Slips
- Freeport-McMoRan Earnings Beat Estimates on Rising Copper Prices
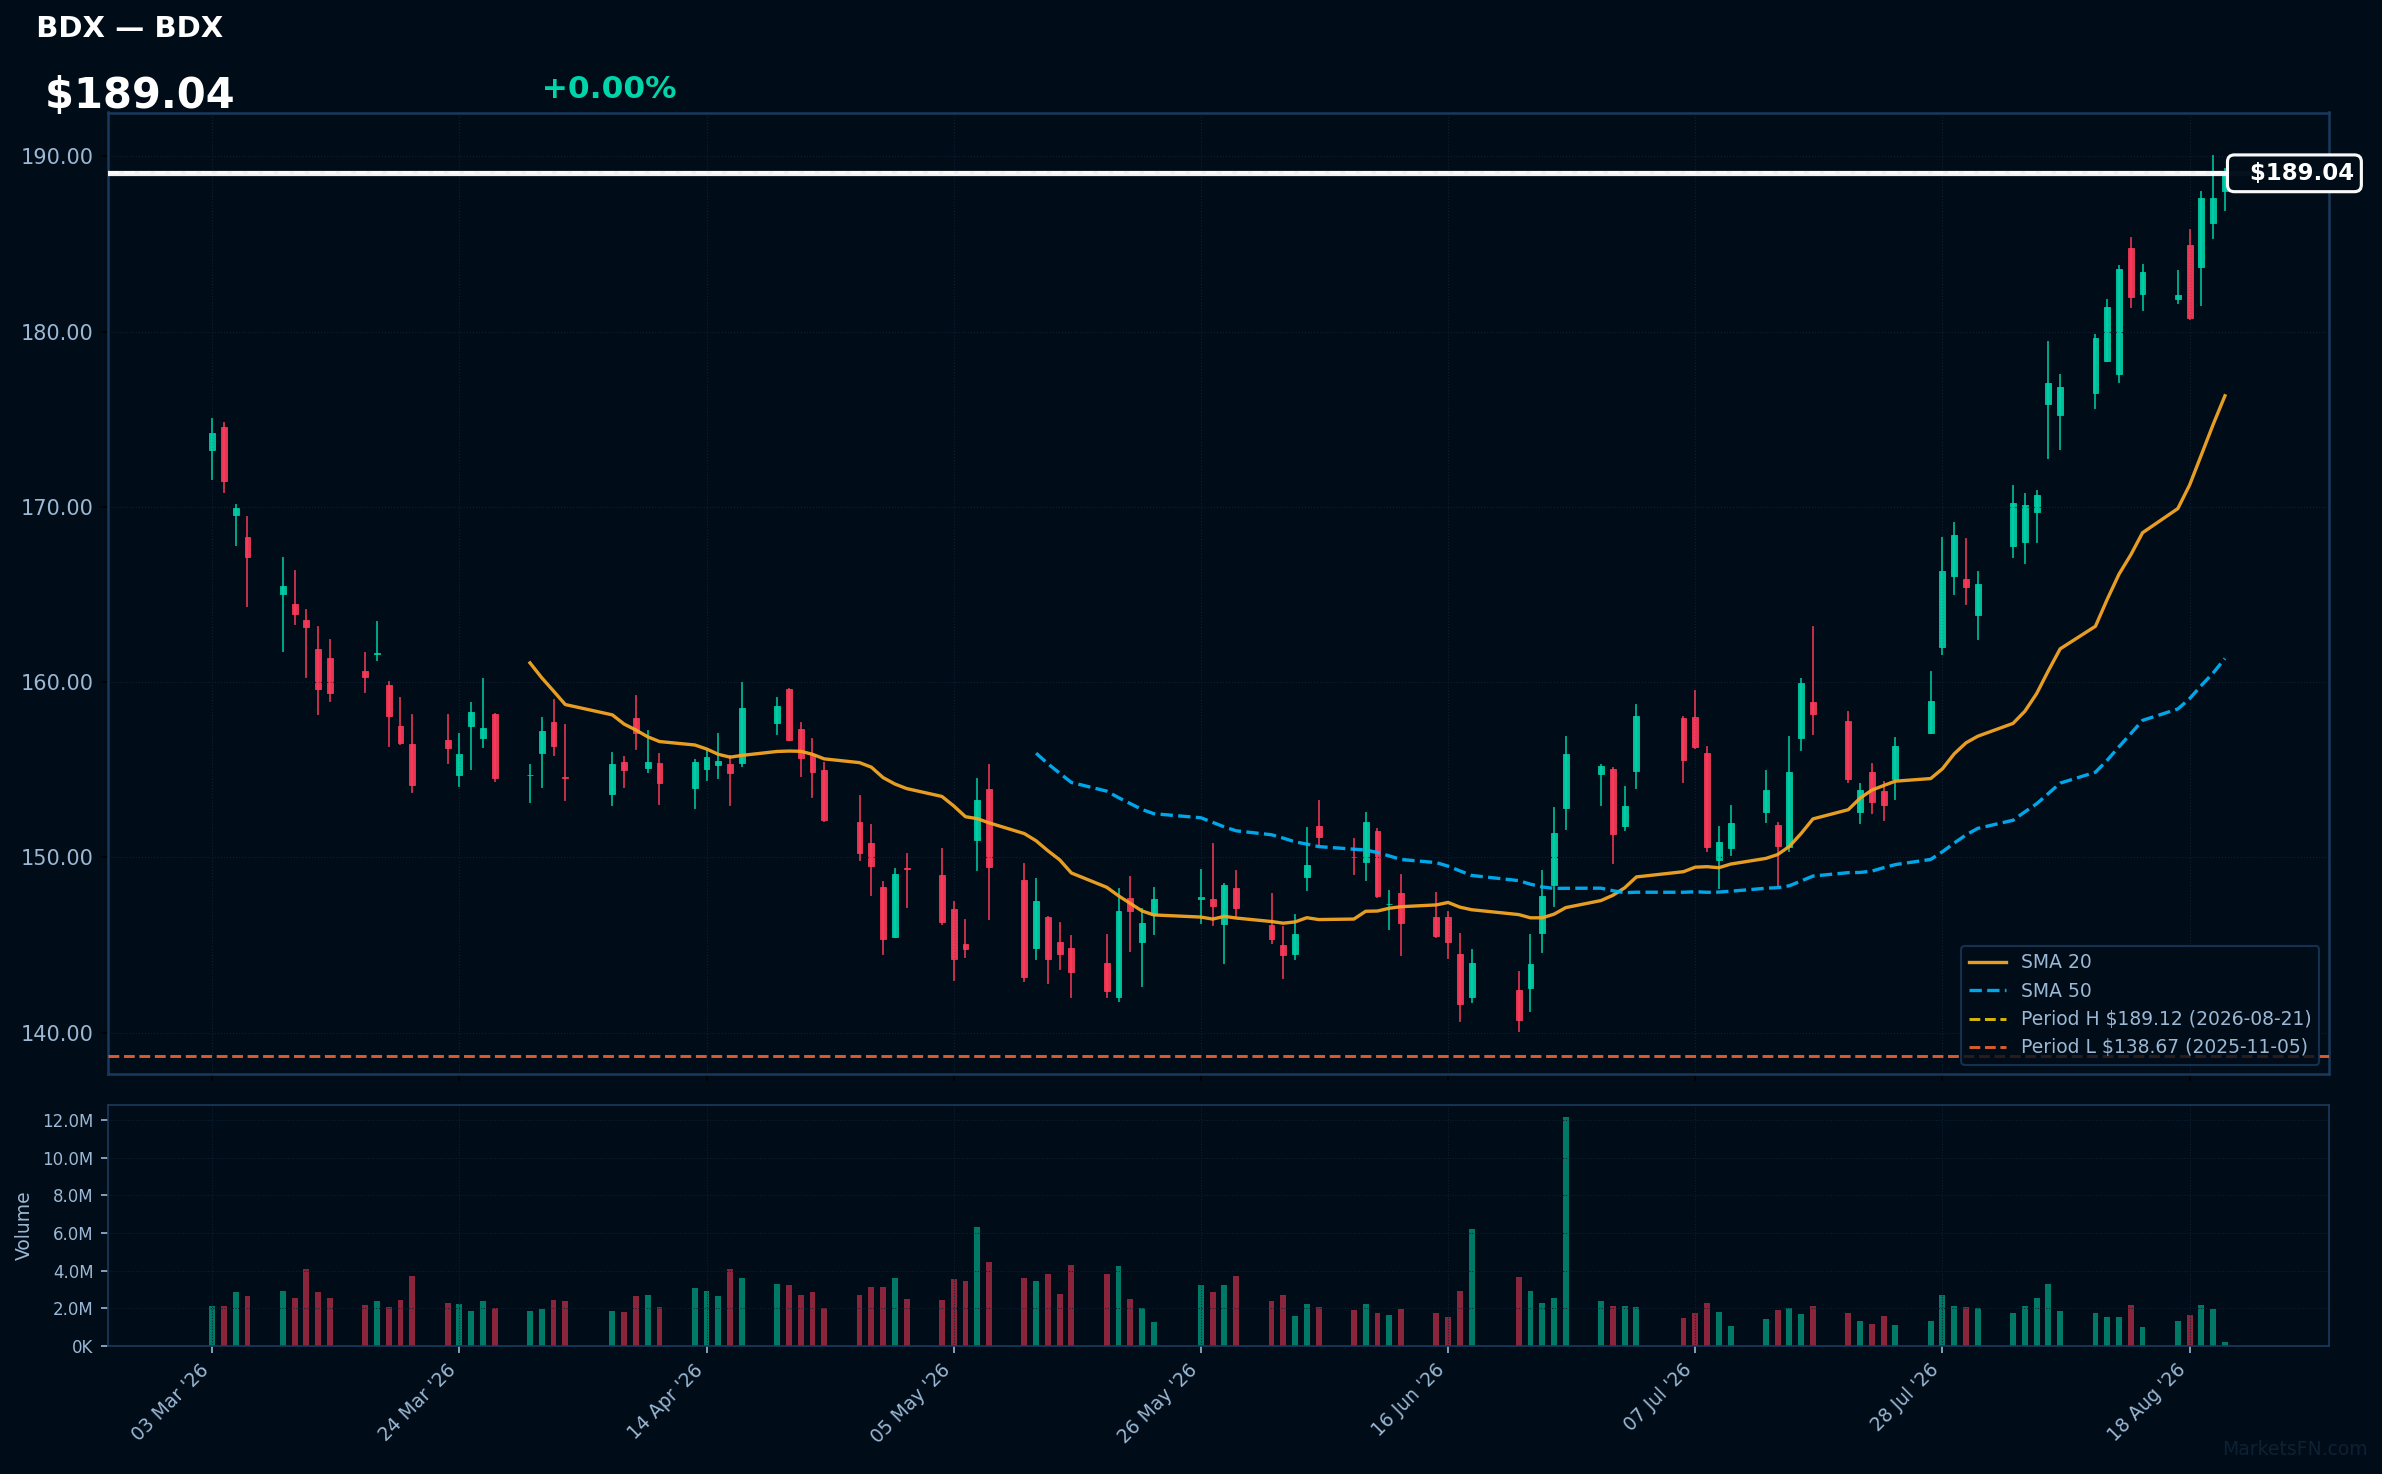
BDX | Becton Dickinson & Co | Healthcare | Price Last: $189.12 | % Realized: +22.35% | RSI: 76.5 | % above MA200: +20.0% | Trend: Above MA20, MA50, MA200
Becton Dickinson & Co (BDX) specializes in medical technology, providing products for drug delivery, diagnostics, and surgical procedures. Investors should care due to its critical role in healthcare innovation and the growing demand for medical devices, especially post-pandemic.
The current technical situation indicates strong momentum, with an RSI(14) of 76.5 and a bullish MA alignment: price > MA20 > MA50 > MA200. The stock is also 0.0% below its 52-Week high.
Related headlines
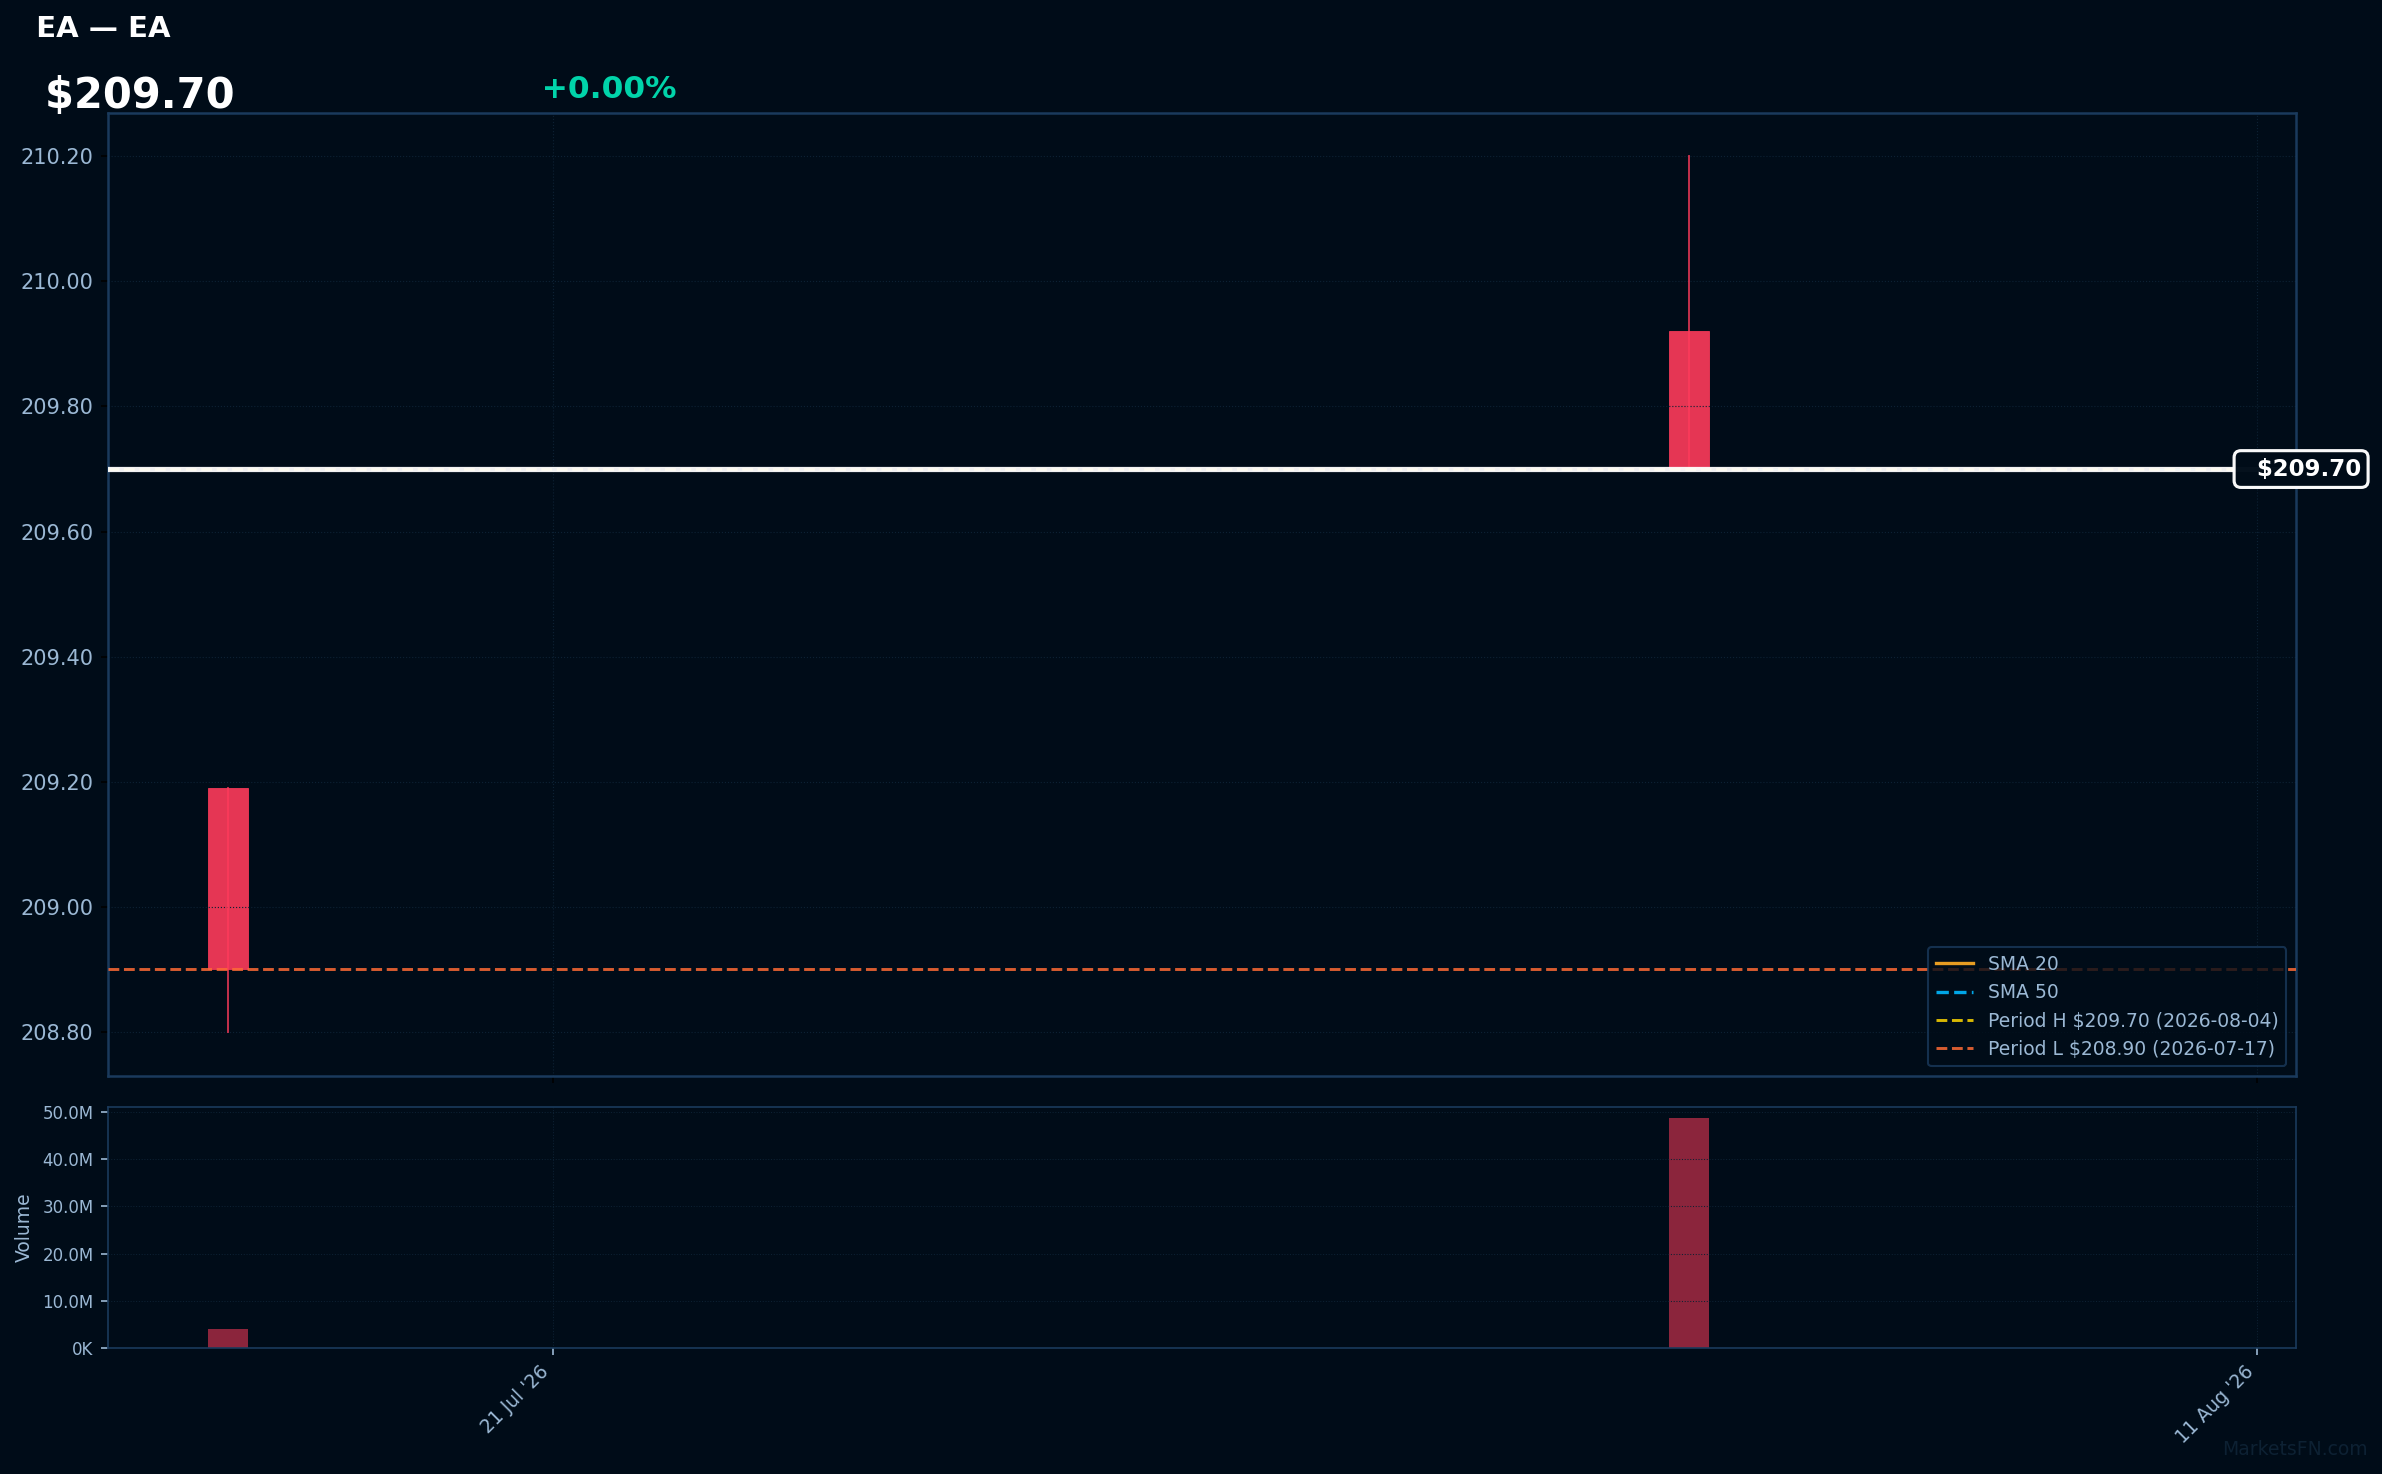
EA | Electronic Arts, Inc | Communication Services | Price Last: $209.70 | % Realized: +0.38% | RSI: — | % above MA200: — | Trend: —
Electronic Arts, Inc. develops and publishes interactive software, primarily in the gaming industry, with popular franchises like FIFA and The Sims. Investors should care due to its strong market position and potential for growth in the expanding gaming sector.
The stock is 0.0% below its 52-Week high, indicating a potential breakout level. RSI(14) data is N/A, and MA data is incomplete, limiting technical analysis.
📉 Nearest to 52-Week Low
Sectors represented: Industrials (2), Utilities (2), Communication Services (1)
| Ticker | Company | Sector | Price Last | % Realized | 52-Week Low Date | RSI | % above MA200 | Trend |
|---|---|---|---|---|---|---|---|---|
| LHX | L3Harris Technologies Inc | Industrials | $269.18 | -2.51% | 2026-08-21 | 36.6 | -14.7% | Below MA20, MA50, MA200 |
| PEG | Public Service Enterprise Group Inc | Utilities | $74.32 | -10.77% | 2026-08-21 | 32.3 | -7.6% | Below MA20, MA50, MA200 |
| NRG | NRG Energy Inc | Utilities | $114.65 | -21.41% | 2026-08-21 | 39.6 | -23.3% | Below MA20, MA50, MA200 |
| TTD | Trade Desk Inc | Communication Services | $13.30 | -74.58% | 2026-08-21 | 32.0 | -49.9% | Below MA20, MA50, MA200 |
| LII | Lennox International Inc | Industrials | $405.83 | -28.88% | 2026-08-21 | 31.0 | -19.3% | Below MA20, MA50, MA200 |
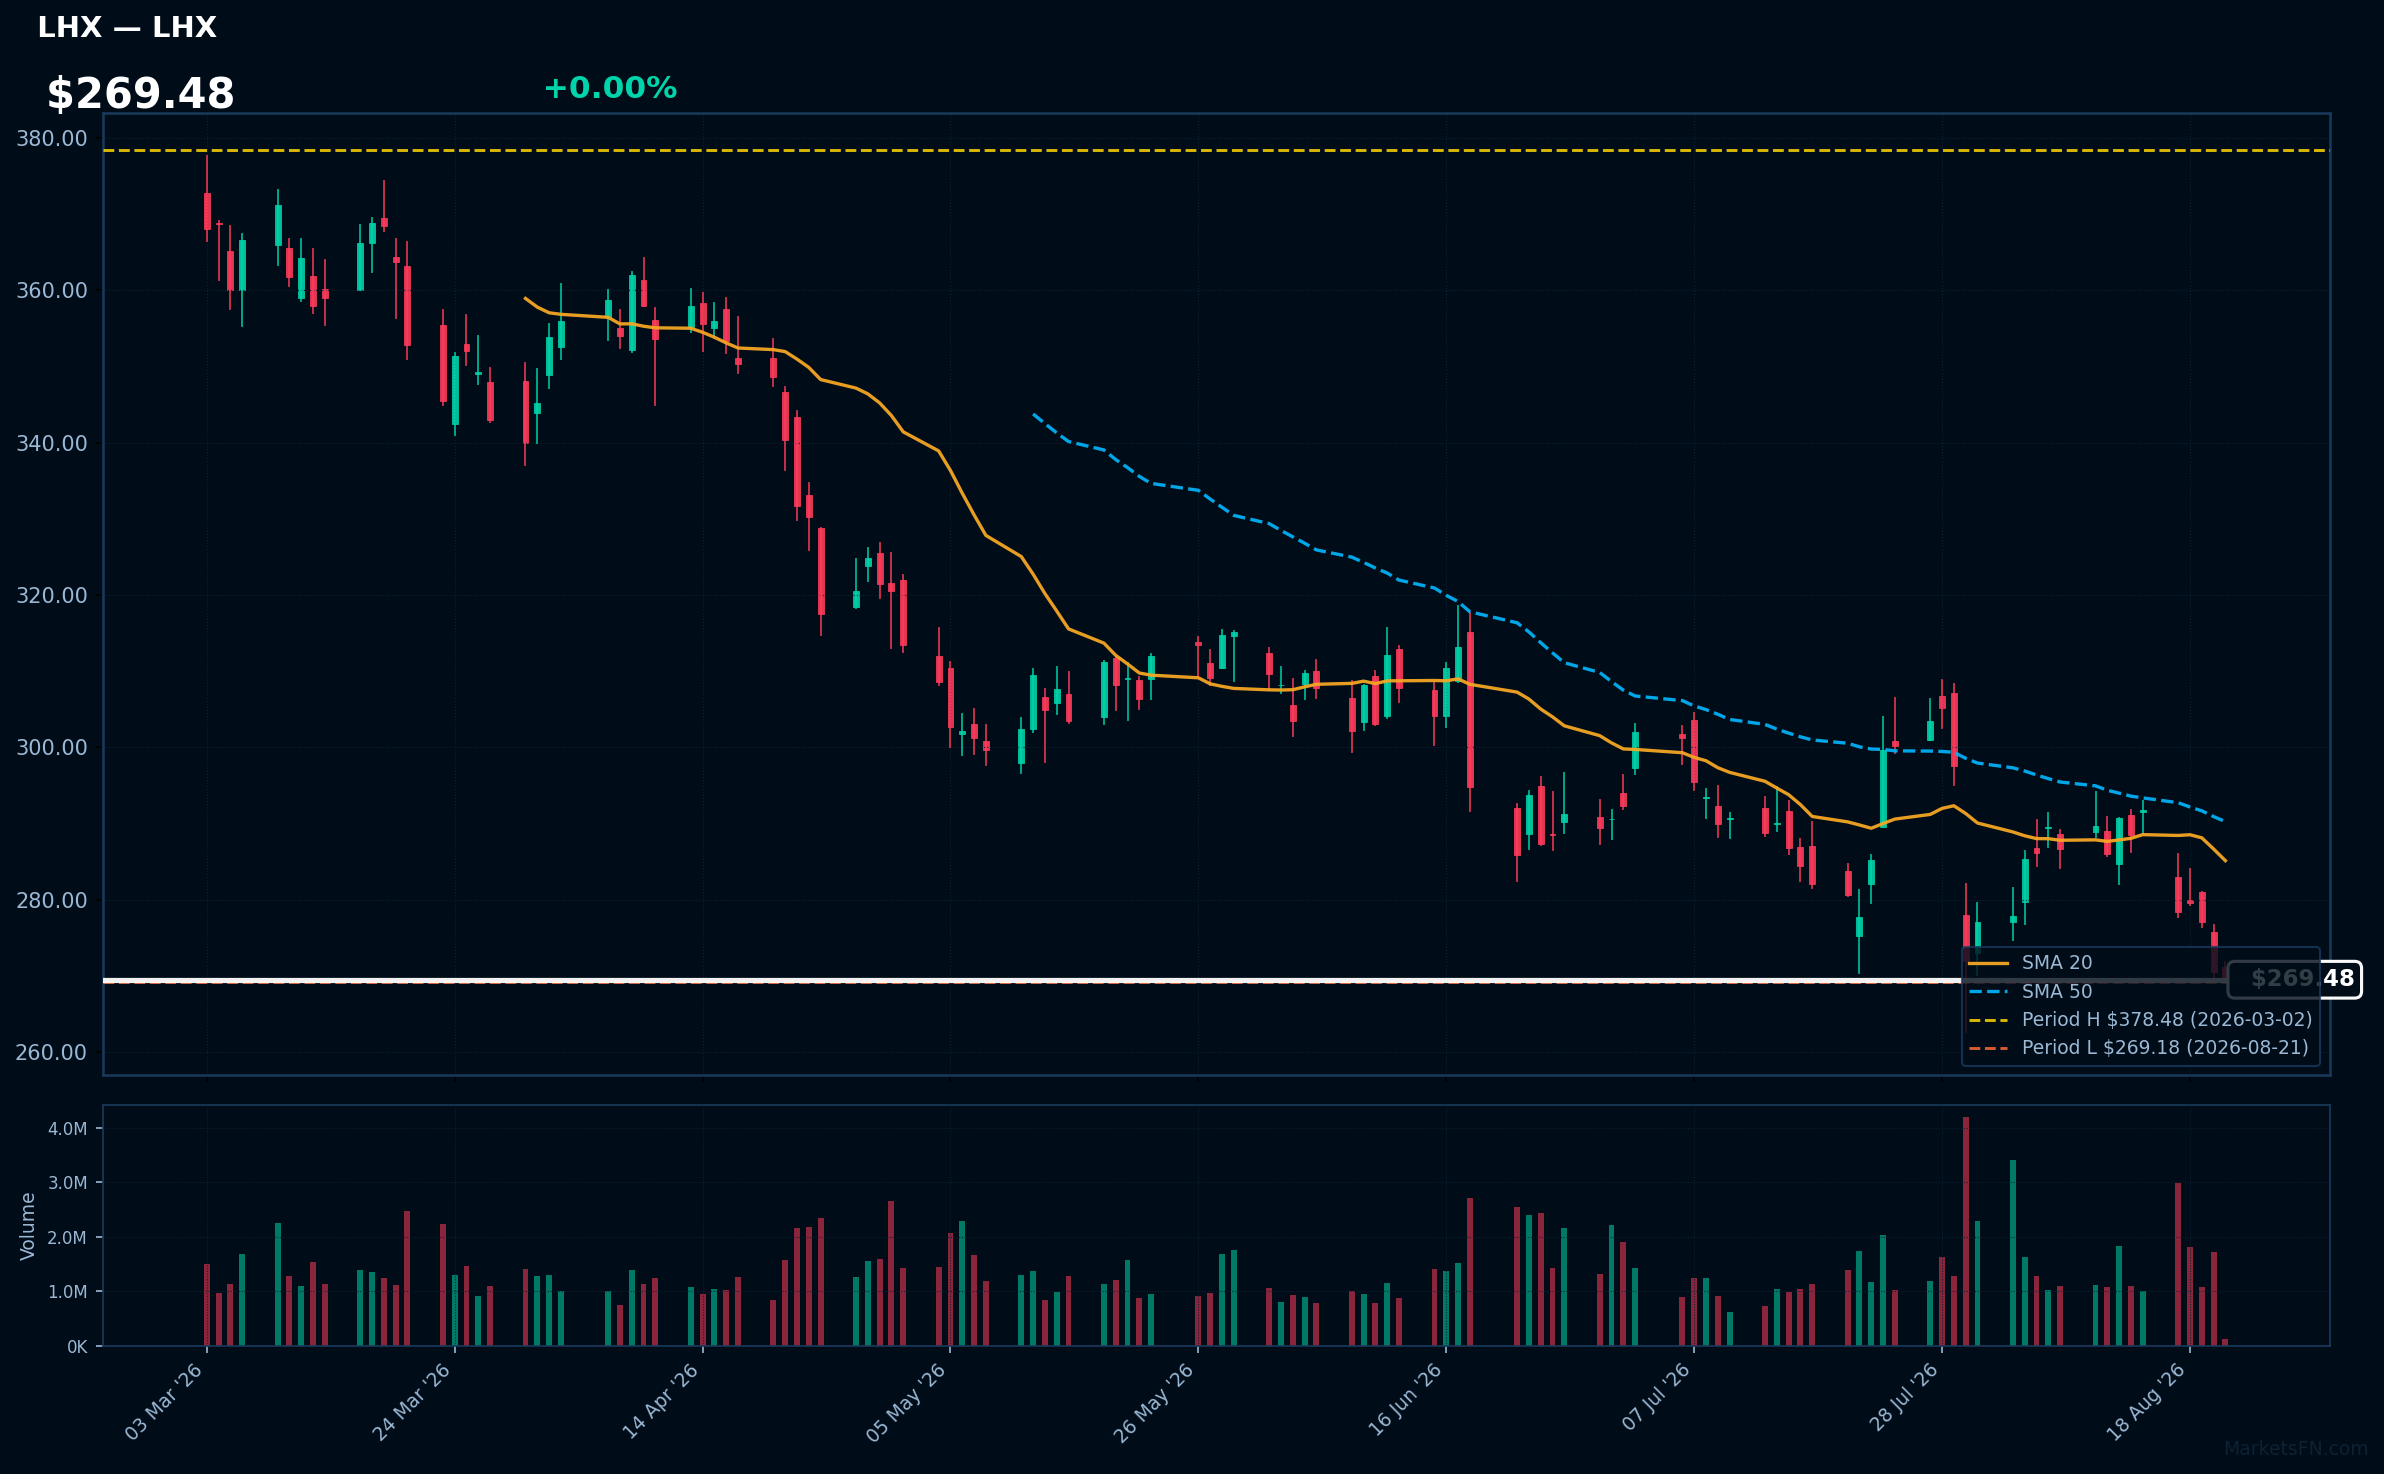
LHX | L3Harris Technologies Inc | Industrials | Price Last: $269.18 | % Realized: -2.51% | RSI: 36.6 | % above MA200: -14.7% | Trend: Below MA20, MA50, MA200
L3Harris Technologies Inc specializes in communication and electronic systems for government and commercial sectors, focusing on defense, aerospace, and public safety. Investors should care due to its critical role in national security and technological advancements, which can drive future growth.
The current technical situation indicates a bearish trend with an RSI(14) of 36.6 and a MA alignment of price < MA20 < MA50 < MA200, suggesting a sustained downtrend and potential warning signs for investors.
Related headlines
- Women at L3Harris Shared Concerns About CEO's Behavior Years Before Ouster
- L3Harris Demonstrates Multi-Domain Supremacy at Annual Project Convergence Exercise
- L3Harris fires CEO Chris Kubasik after conduct investigation
- Ousted L3Harris CEO Chris Kubasik forfeits $45 millionbut hell still walk away with $80 million in stock and options
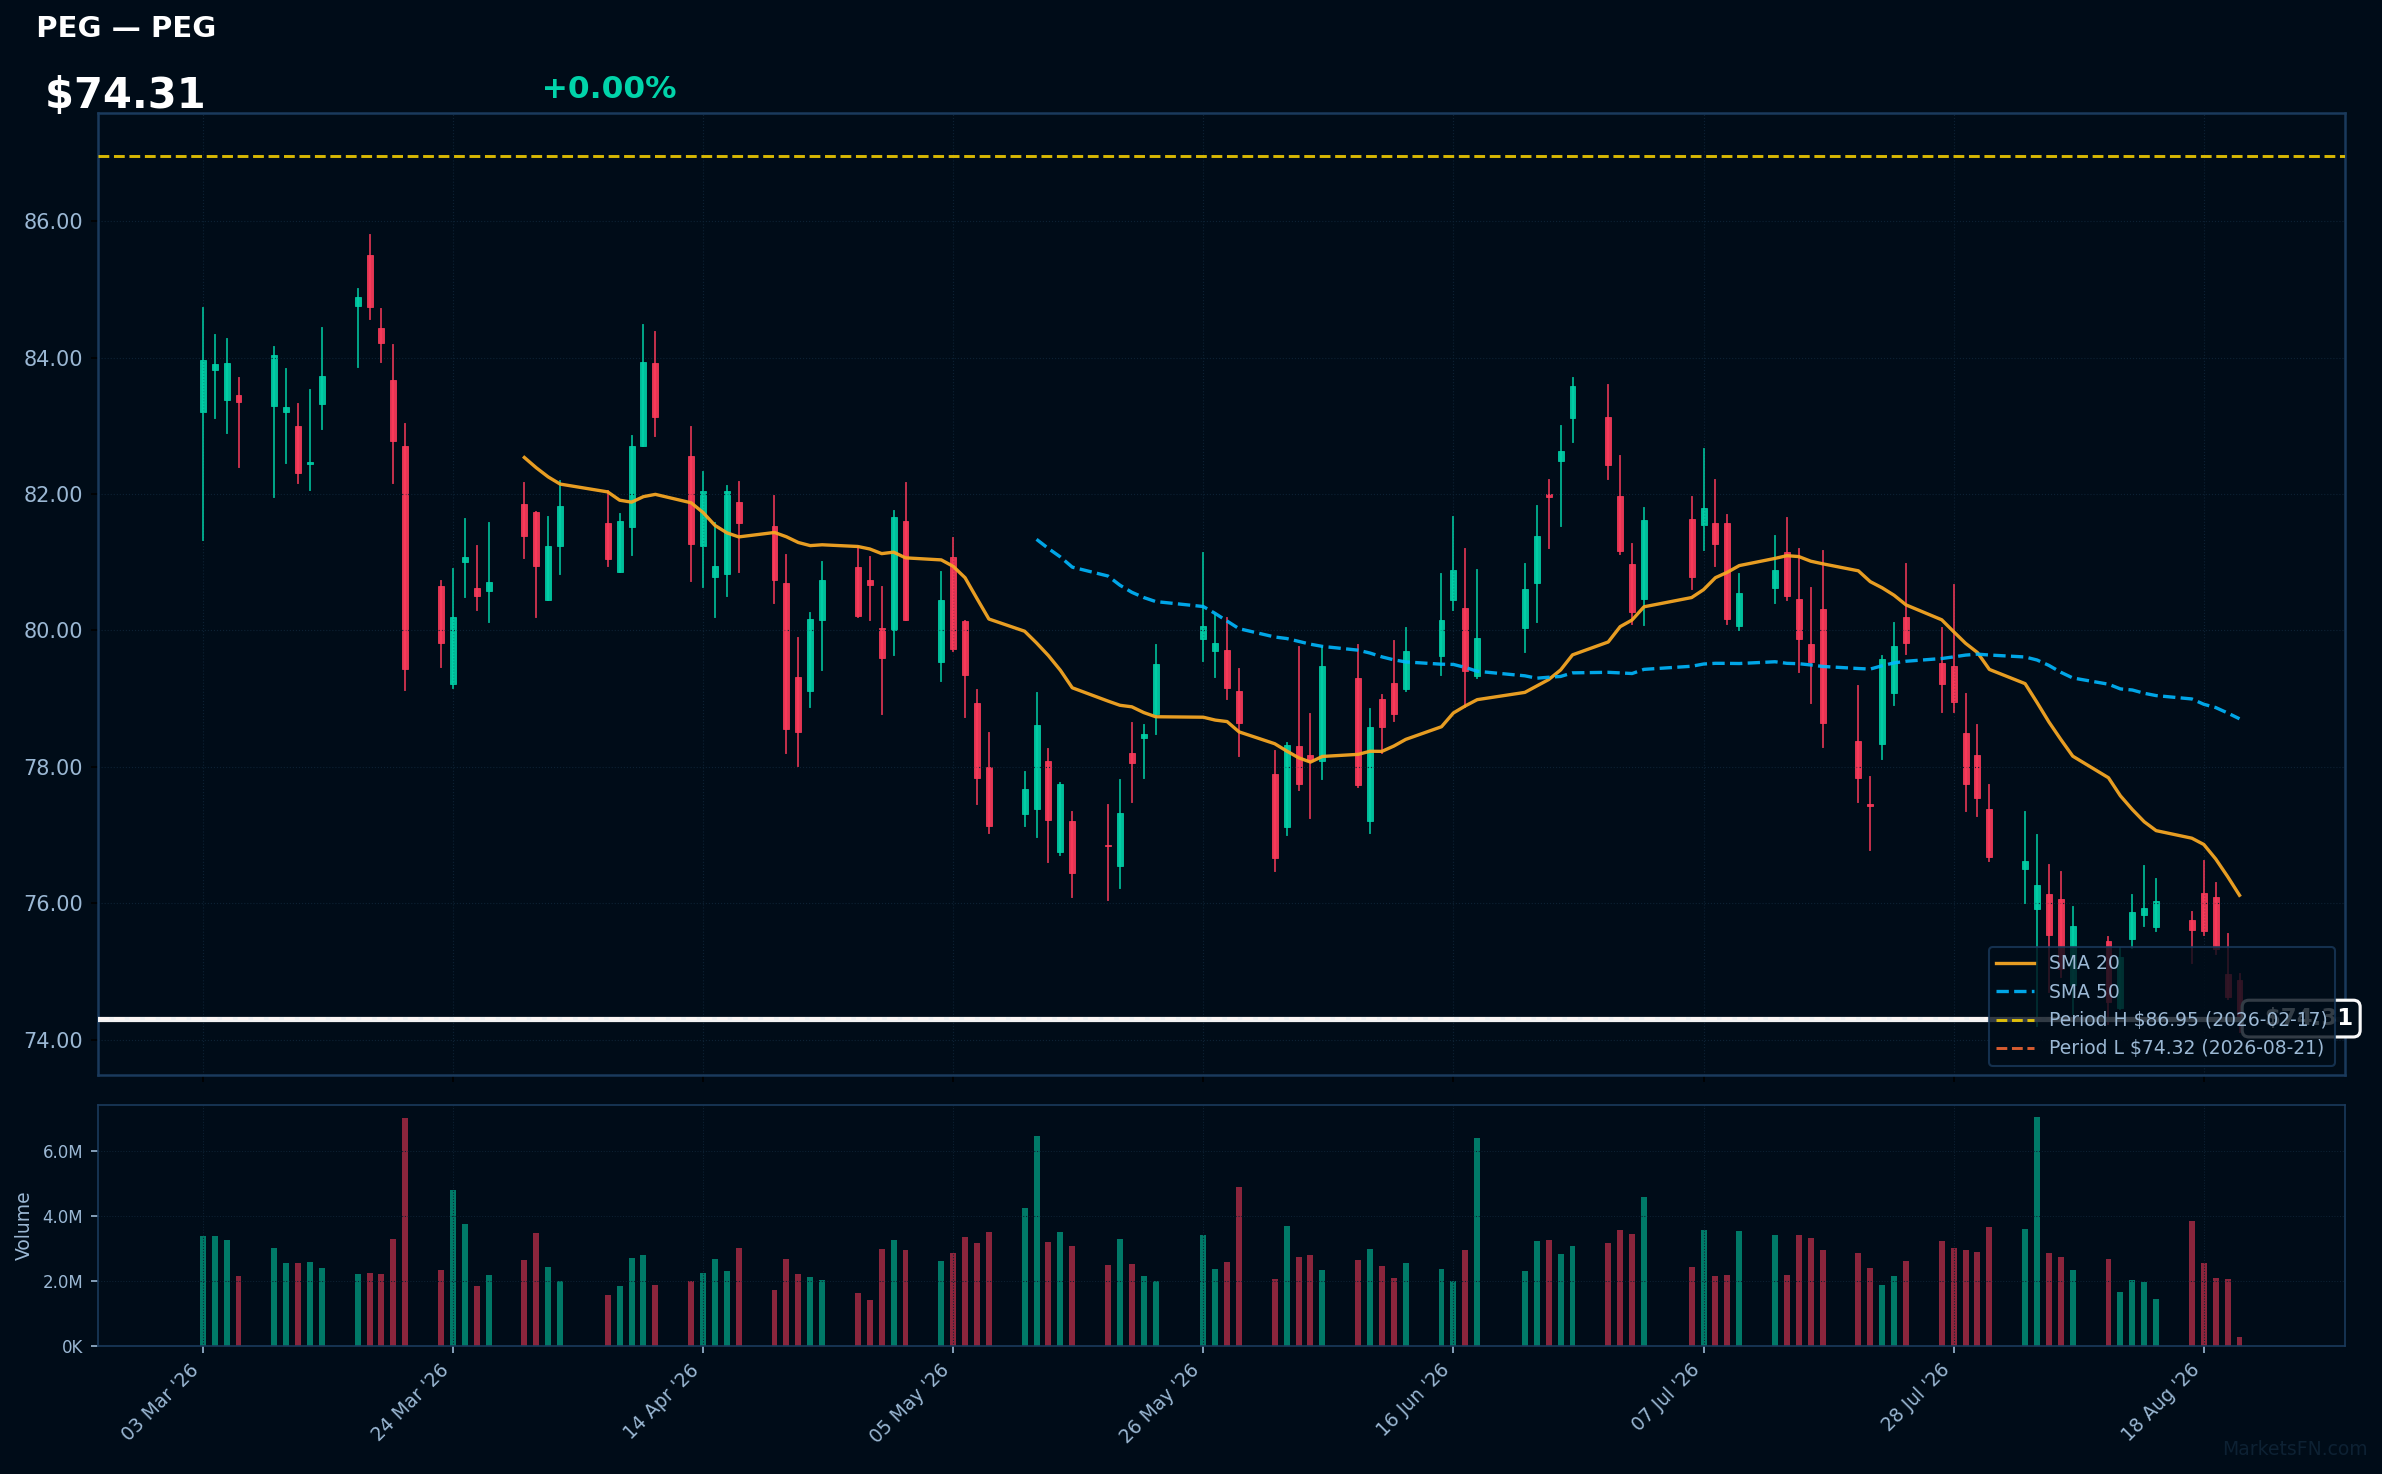
PEG | Public Service Enterprise Group Inc | Utilities | Price Last: $74.32 | % Realized: -10.77% | RSI: 32.3 | % above MA200: -7.6% | Trend: Below MA20, MA50, MA200
Public Service Enterprise Group Inc (PEG) is a utility holding company that provides electricity and natural gas services. Investors should care due to its critical role in energy infrastructure and the potential impact of regulatory changes on its operations and profitability.
The current technical situation indicates a bearish trend, with an RSI(14) of 32.3 and a MA alignment of price < MA20 < MA50 < MA200, suggesting sustained downtrend and testing major support, being only 0.0% above its 52-Week low.
Related headlines
- Public Service Enterprise Group Inc (PEG) (Q2 2026) Earnings Call Highlights: Reaffirms ...
- Public Service Enterprise Group Incorporated Q2 2026 Earnings Call Summary
- Public Service Enterprise Group Incorporated Q1 2026 Earnings Call Summary
- Is Public Service Enterprise Stock Underperforming the Nasdaq?
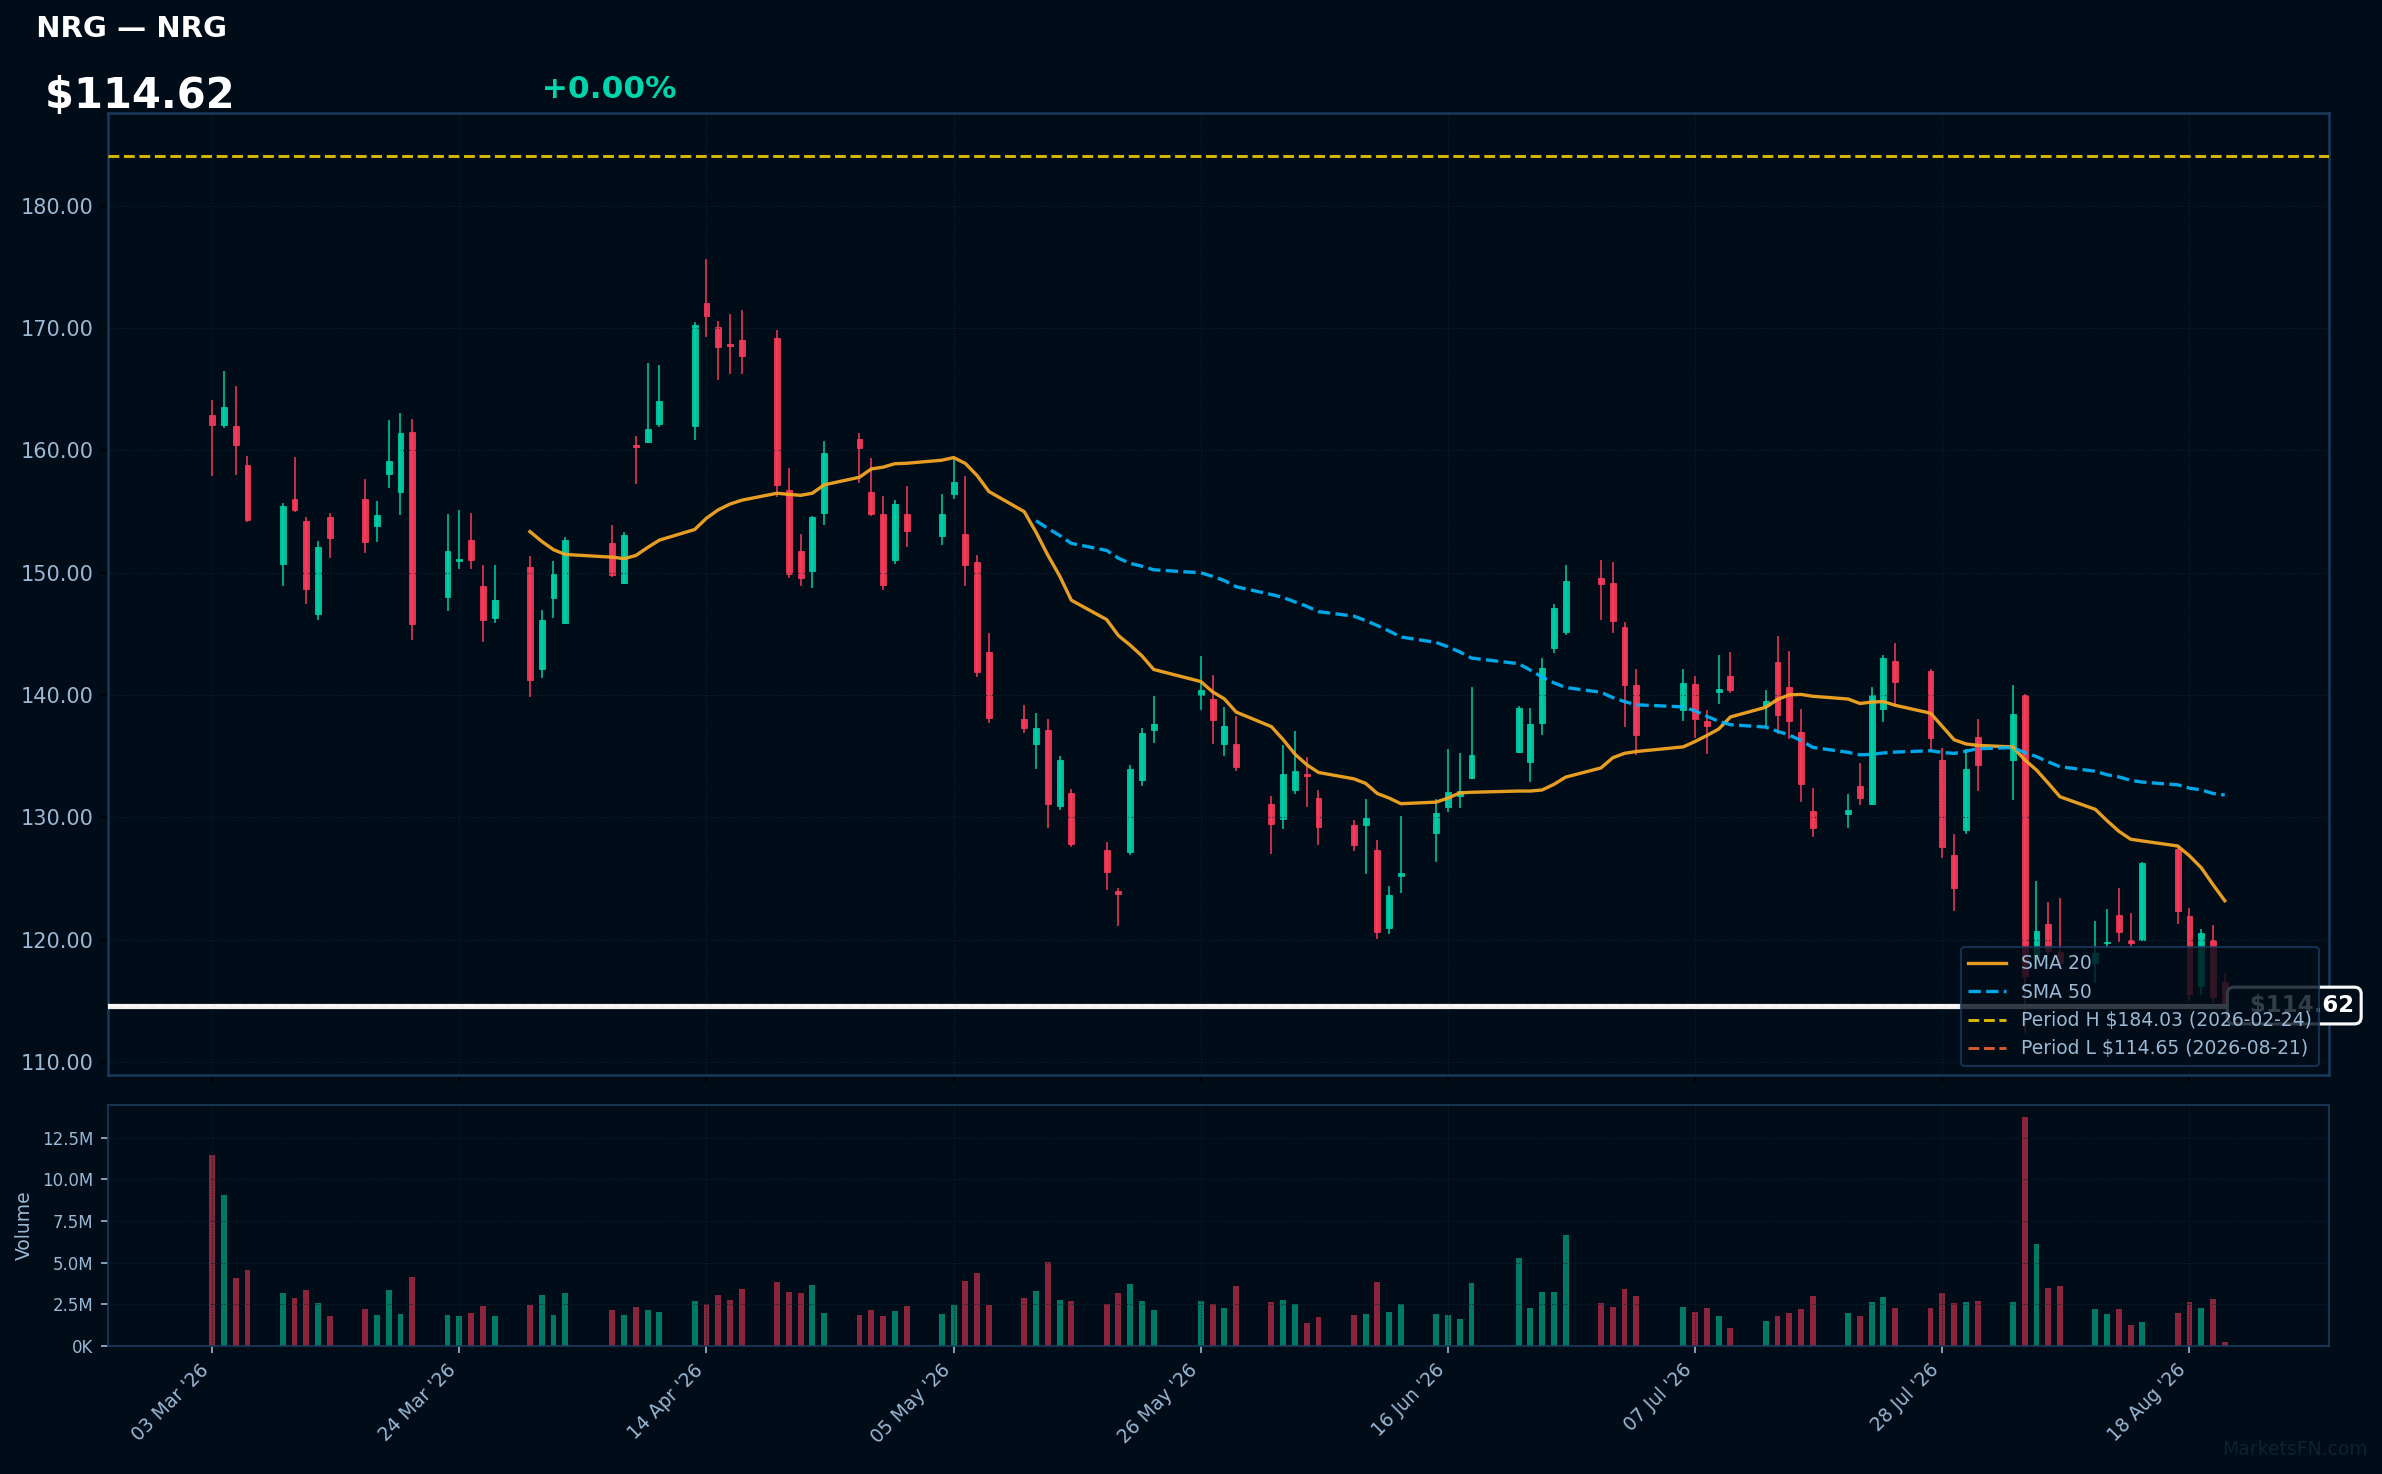
NRG | NRG Energy Inc | Utilities | Price Last: $114.65 | % Realized: -21.41% | RSI: 39.6 | % above MA200: -23.3% | Trend: Below MA20, MA50, MA200
NRG Energy Inc is a leading integrated power company that provides energy and related services to residential, commercial, and industrial customers. Investors should care due to its significant role in the energy market and potential impacts from regulatory changes and energy demand fluctuations.
The current technical situation indicates a bearish trend with an RSI(14) of 39.6 and a MA alignment of price < MA20 < MA50 < MA200, suggesting sustained downtrend and testing major support, as the stock is only 0.0% above its 52-Week low.
Related headlines
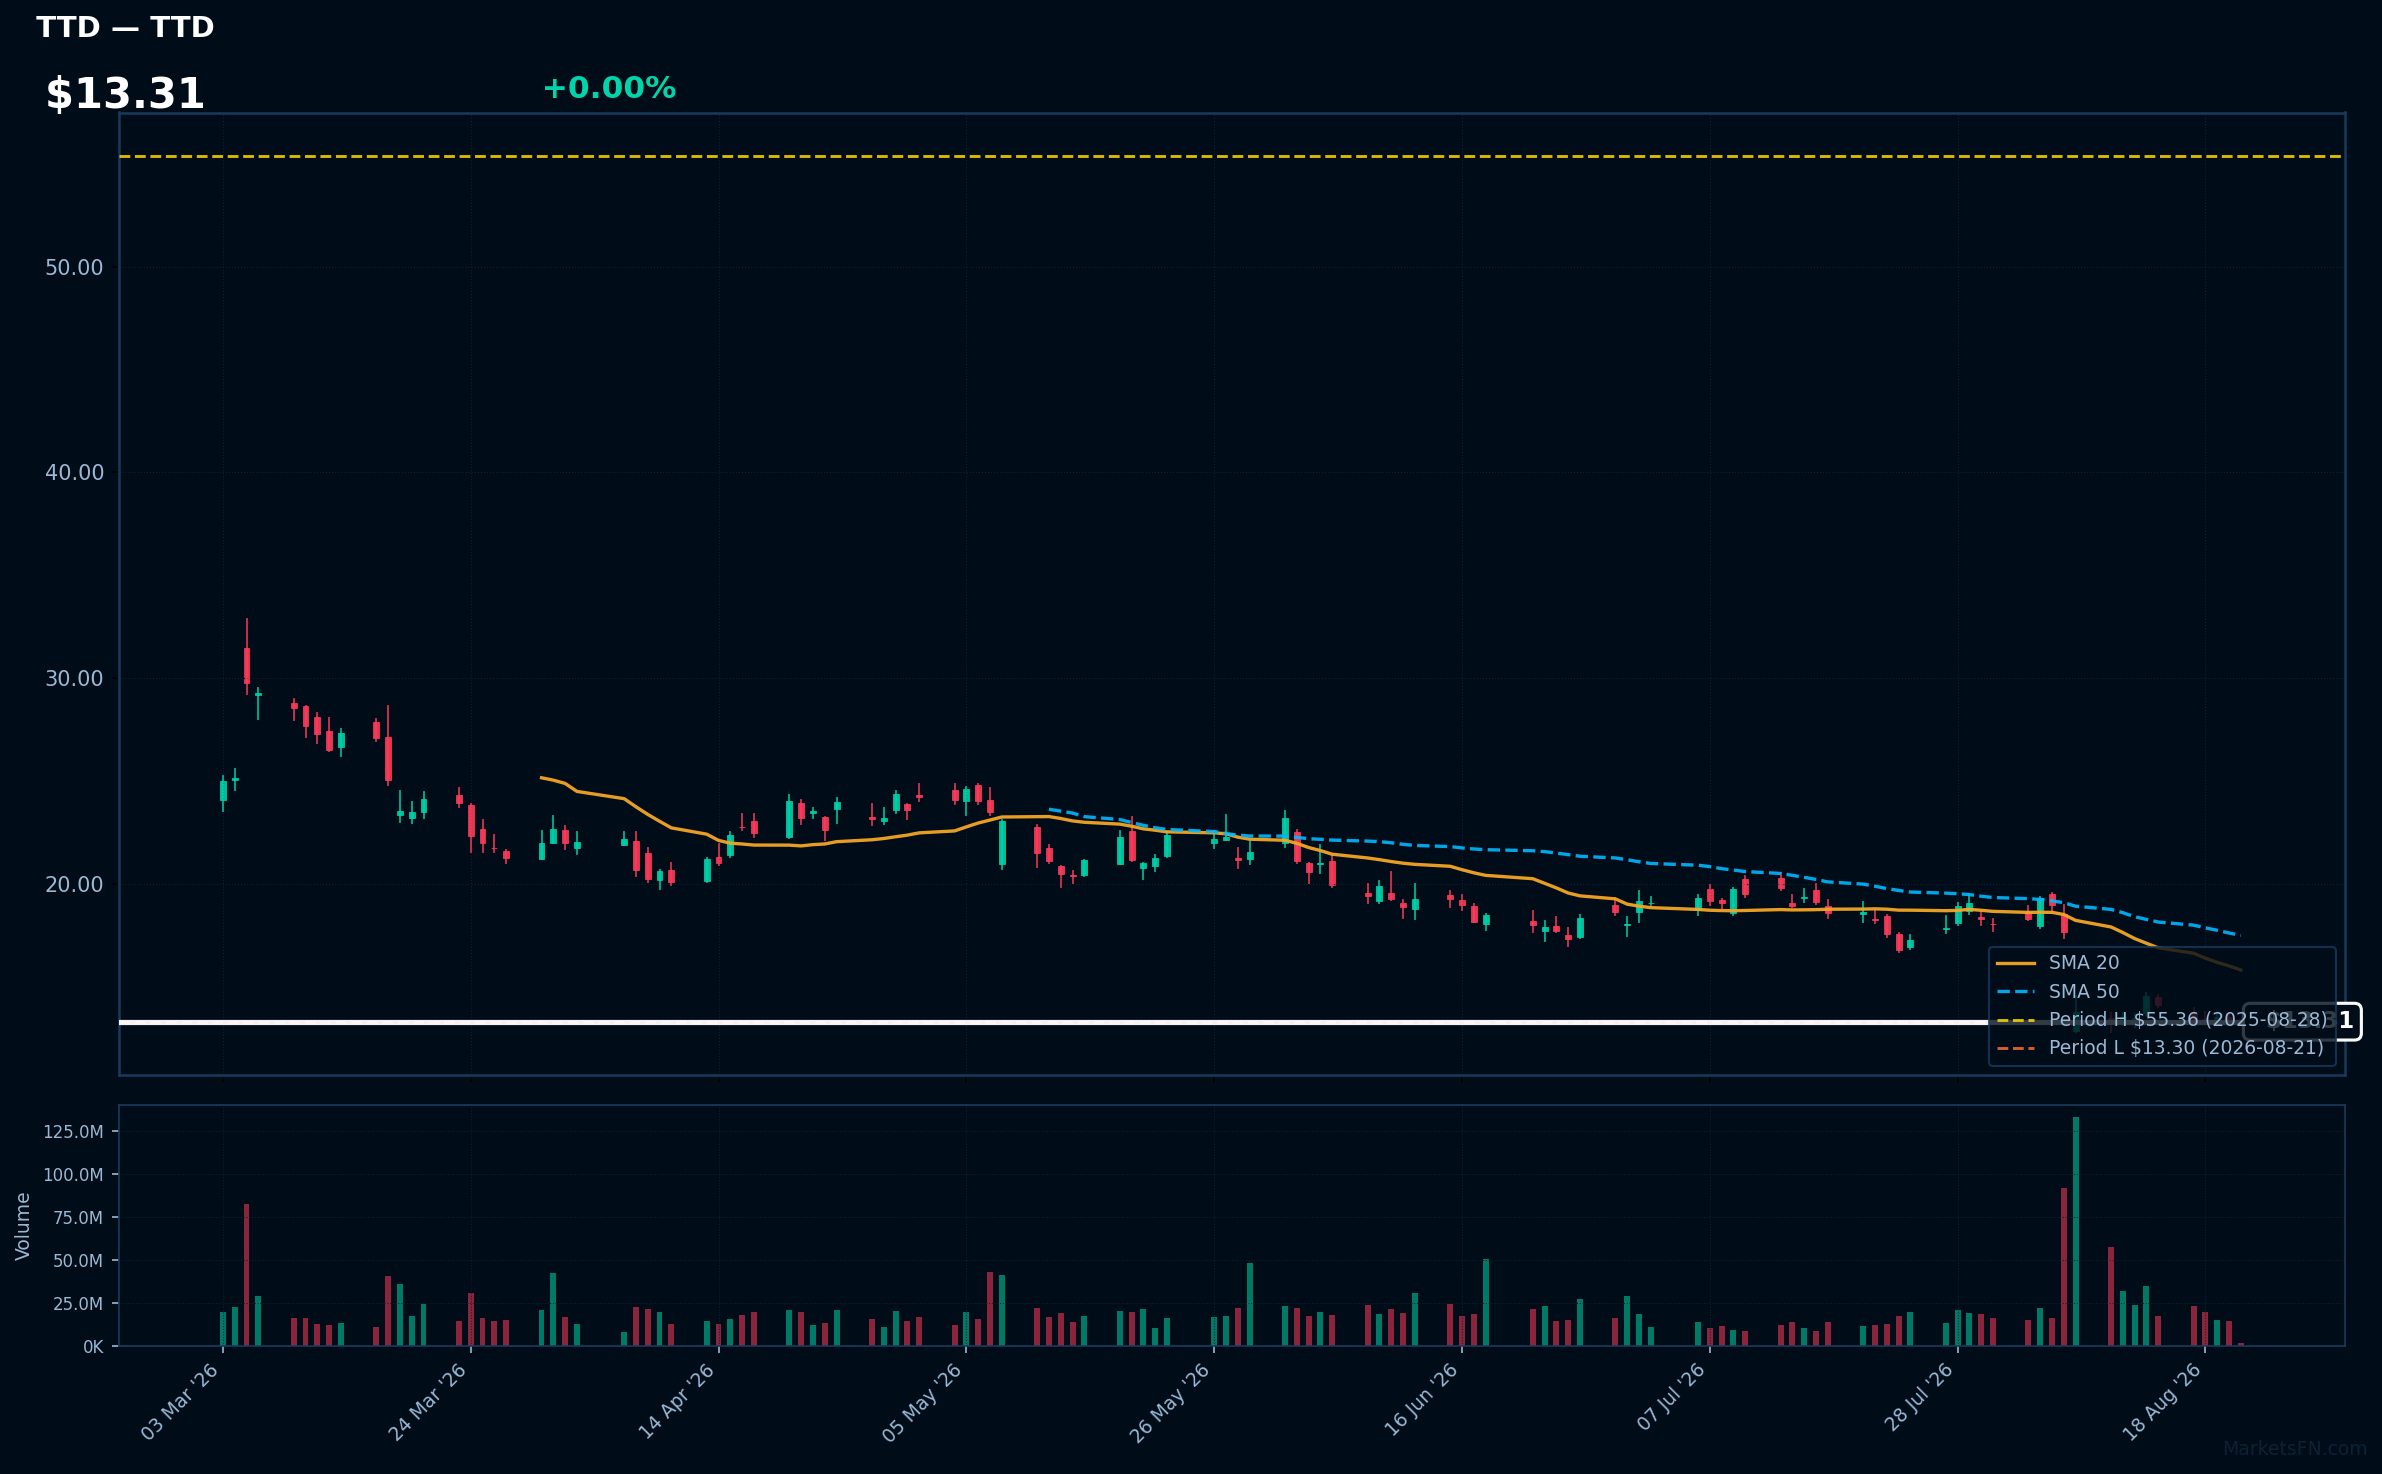
TTD | Trade Desk Inc | Communication Services | Price Last: $13.30 | % Realized: -74.58% | RSI: 32.0 | % above MA200: -49.9% | Trend: Below MA20, MA50, MA200
Trade Desk Inc (TTD) provides a technology platform for digital advertising, enabling advertisers to manage data-driven campaigns across various channels. Investors should care due to its significant market position and the potential for recovery in the digital ad space.
The current technical situation indicates a bearish trend, with an RSI of 32.0 and a MA alignment of price < MA20 < MA50 < MA200, suggesting sustained downtrend and testing major support just 0.0% above its 52-Week low.
Related headlines
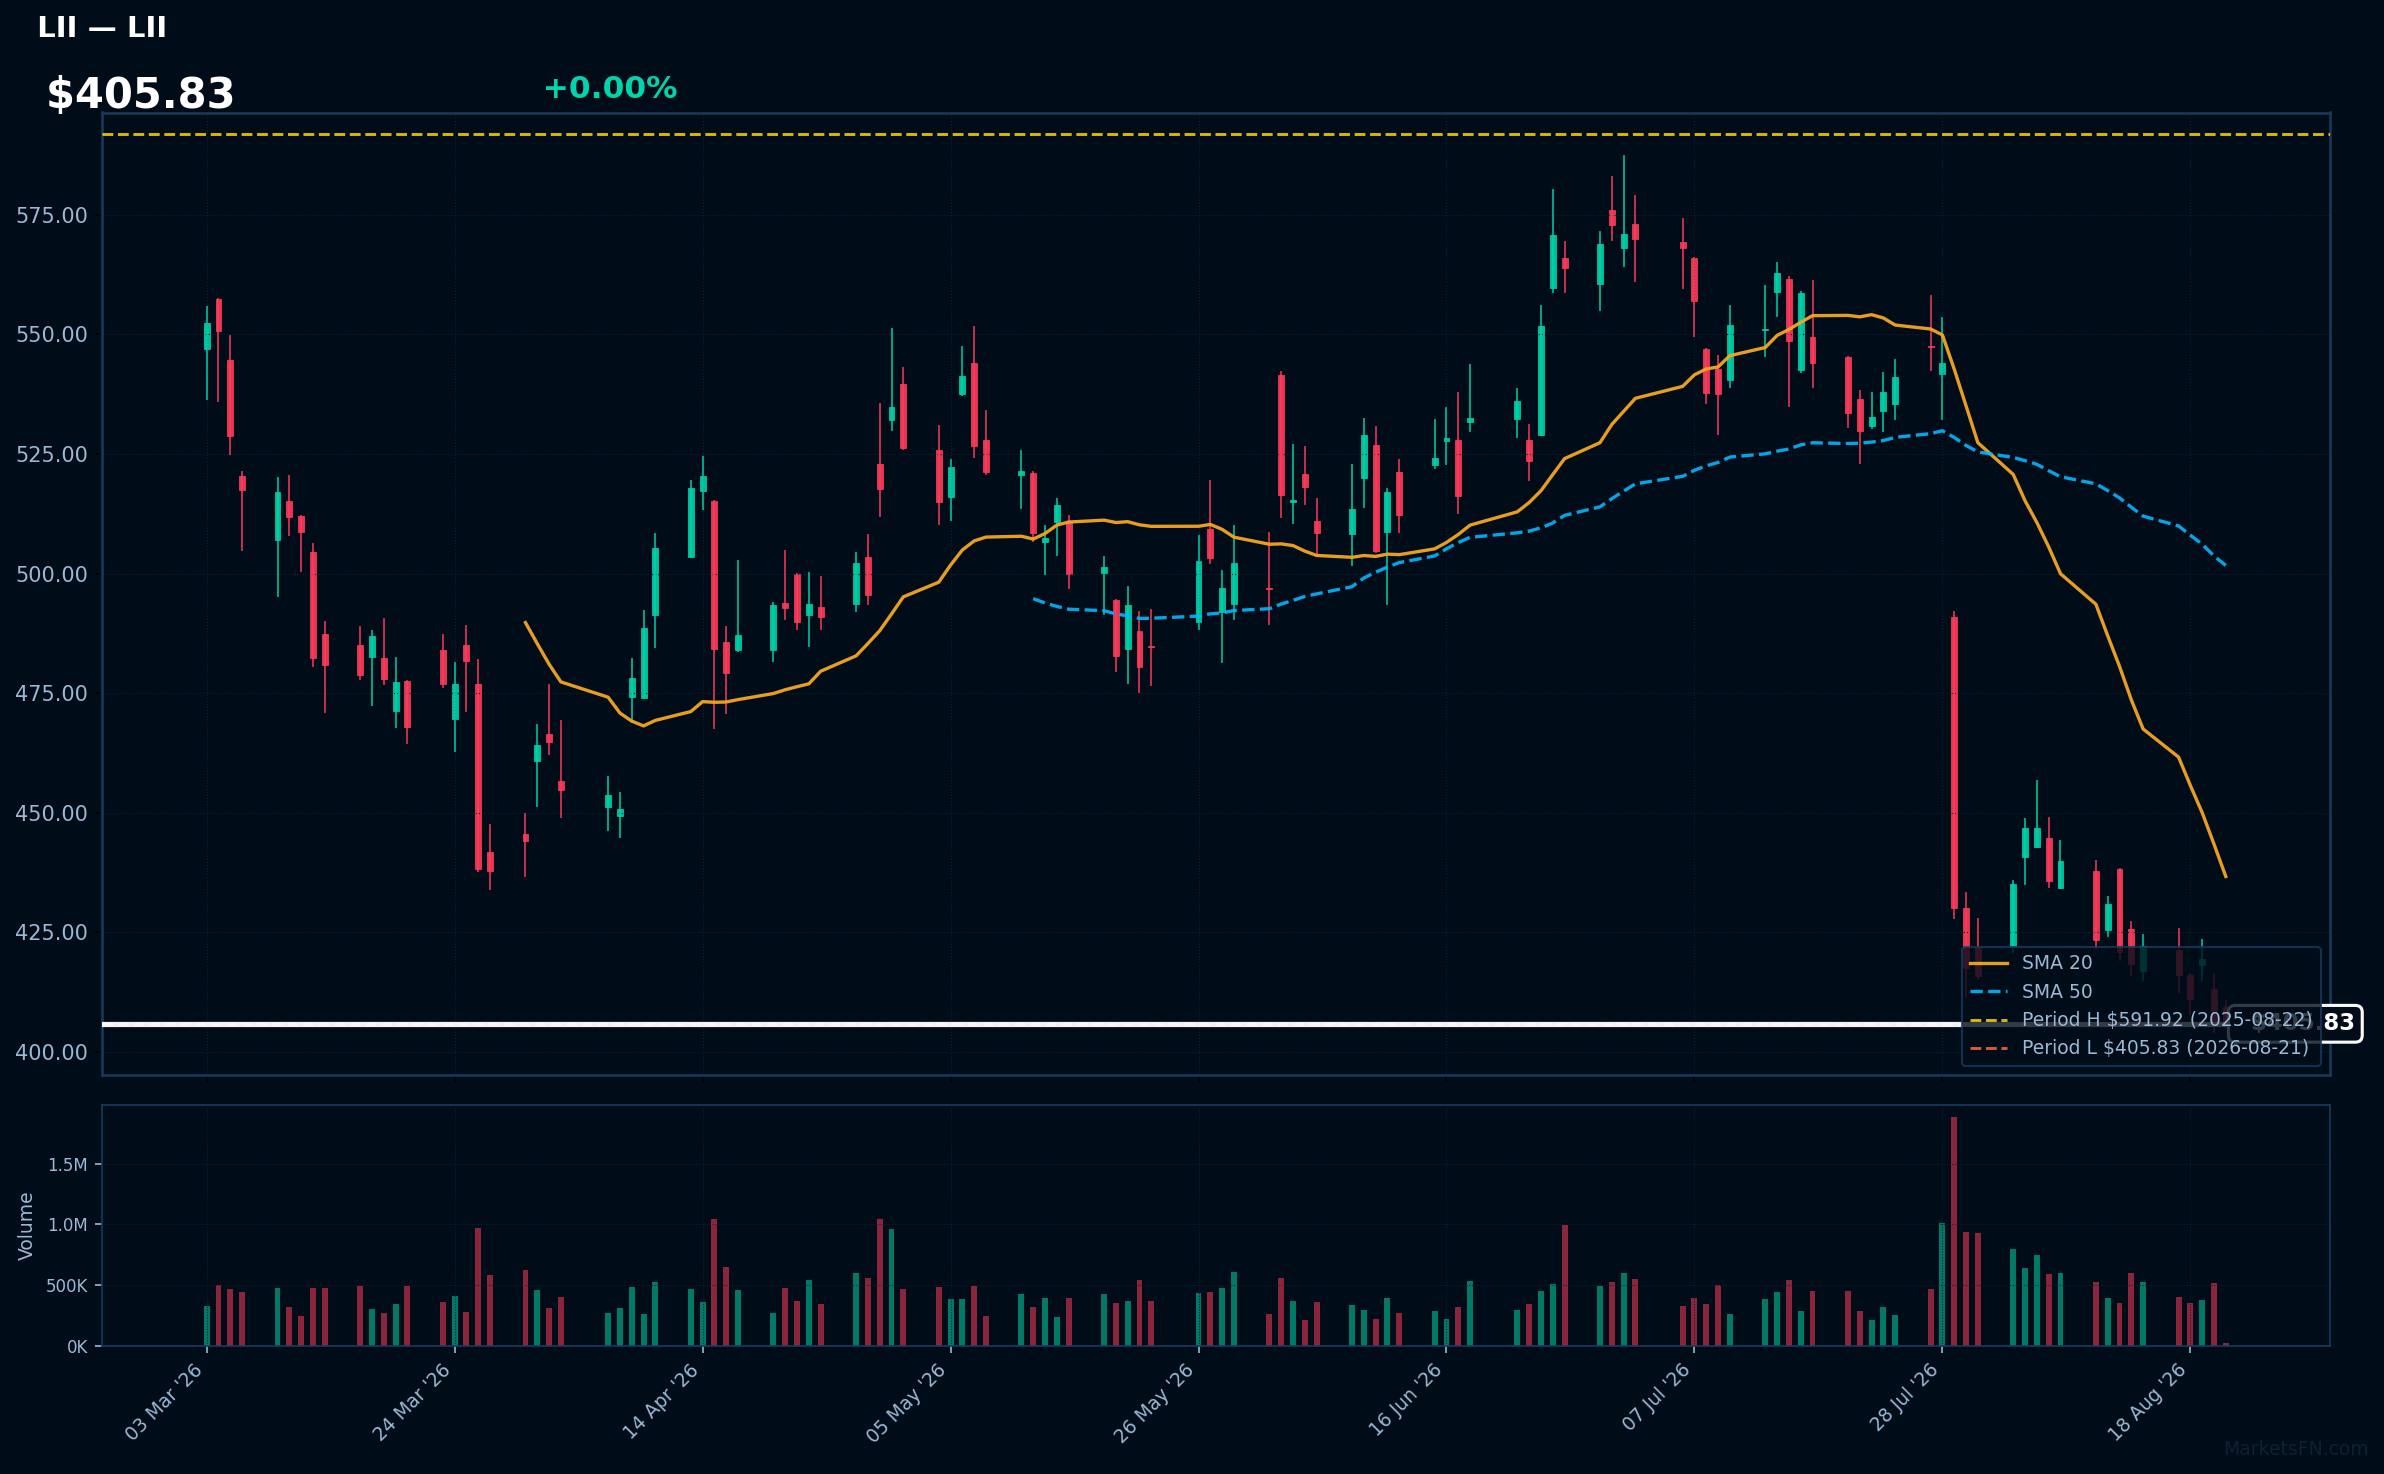
LII | Lennox International Inc | Industrials | Price Last: $405.83 | % Realized: -28.88% | RSI: 31.0 | % above MA200: -19.3% | Trend: Below MA20, MA50, MA200
Lennox International Inc (LII) designs and manufactures heating, ventilation, and air conditioning (HVAC) systems. Investors should care due to its significant role in the energy-efficient HVAC market, which is critical for residential and commercial climate control, especially amid rising energy costs and environmental concerns.
The current technical situation indicates a bearish trend with an RSI(14) of 31.0, suggesting oversold conditions. The price is below all moving averages (MA20, MA50, MA200), indicating a sustained downtrend and testing major support, being only 0.0% above its 52-Week low.
Related headlines
Market Commentary
The presence of S&P 500 stocks near 52-week extremes signals heightened investor sentiment and potential volatility in the market. Stocks such as Conoco Phillips, EOG Resources, Freeport-McMoRan, Becton Dickinson, and Electronic Arts are all at 0.0% from their 52-week highs, indicating strong performance and investor confidence. Conversely, companies like L3Harris Technologies, Public Service Enterprise Group, NRG Energy, Trade Desk, and Lennox International are positioned just above their 52-week lows, suggesting caution among investors in these sectors.
This divergence may reflect sector rotation, where investors shift capital towards energy and technology stocks that are performing well, while pulling back from utilities and industrials facing headwinds. Macro themes such as fluctuating energy prices, interest rate adjustments, and evolving consumer behavior are likely influencing these price levels, as investors react to economic indicators and corporate earnings reports.
Key levels to watch include the 52-week highs for the outperforming stocks, which could serve as resistance points if momentum falters. For those near their lows, any significant downward movement could trigger further selling pressure. Potential catalysts include upcoming earnings announcements, changes in economic policy, and shifts in global market conditions that could impact investor sentiment and sector performance.
Methodology: All 503 S&P 500 constituents screened. 52-week high = highest daily close over the past 252 trading days (approx. 1 year). 52-week low = lowest daily close over the same period. Distance = (current price / extreme − 1) × 100. Technical indicators computed on up to 1 year of daily OHLCV data.
Disclaimer: For informational purposes only. Not investment advice. Past performance is not indicative of future results.

