S&P 500 52-Week Highs & Lows Radar: Chevron (CVX), TJXmpanies, (TJX) and more
MarketsFN Team

S&P 500 52-Week Highs & Lows Radar: Chevron (CVX), TJXmpanies, (TJX) and more
Screening all 503 S&P 500 constituents for stocks nearest to their 52-week high and their 52-week low. Data as of September 15, 2026. % Realized = 52-week total return.
Legend: RSI > 70 = overbought · RSI < 30 = oversold · Green % Realized = positive 52W return · Red = negative.
📈 Nearest to 52-Week High
Sectors represented: Energy (4), Technology (1)
| Ticker | Company | Sector | Price Last | % Realized | 52-Week High Date | RSI | % above MA200 | Trend |
|---|---|---|---|---|---|---|---|---|
| CVX | Chevron Corp | Energy | $215.40 | +36.93% | 2026-09-15 | 68.3 | +17.7% | Above MA20, MA50, MA200 |
| COP | Conoco Phillips | Energy | $138.86 | +50.40% | 2026-09-15 | 68.9 | +21.6% | Above MA20, MA50, MA200 |
| CRWD | Crowdstrike Holdings Inc | Technology | $235.67 | +111.95% | 2026-09-15 | 62.3 | +62.3% | Above MA20, MA50, MA200 |
| MPC | Marathon Petroleum Corp | Energy | $402.98 | +123.95% | 2026-09-15 | 77.1 | +62.6% | Above MA20, MA50, MA200 |
| PSX | Phillips 66 | Energy | $262.21 | +99.89% | 2026-09-15 | 73.6 | +48.9% | Above MA20, MA50, MA200 |
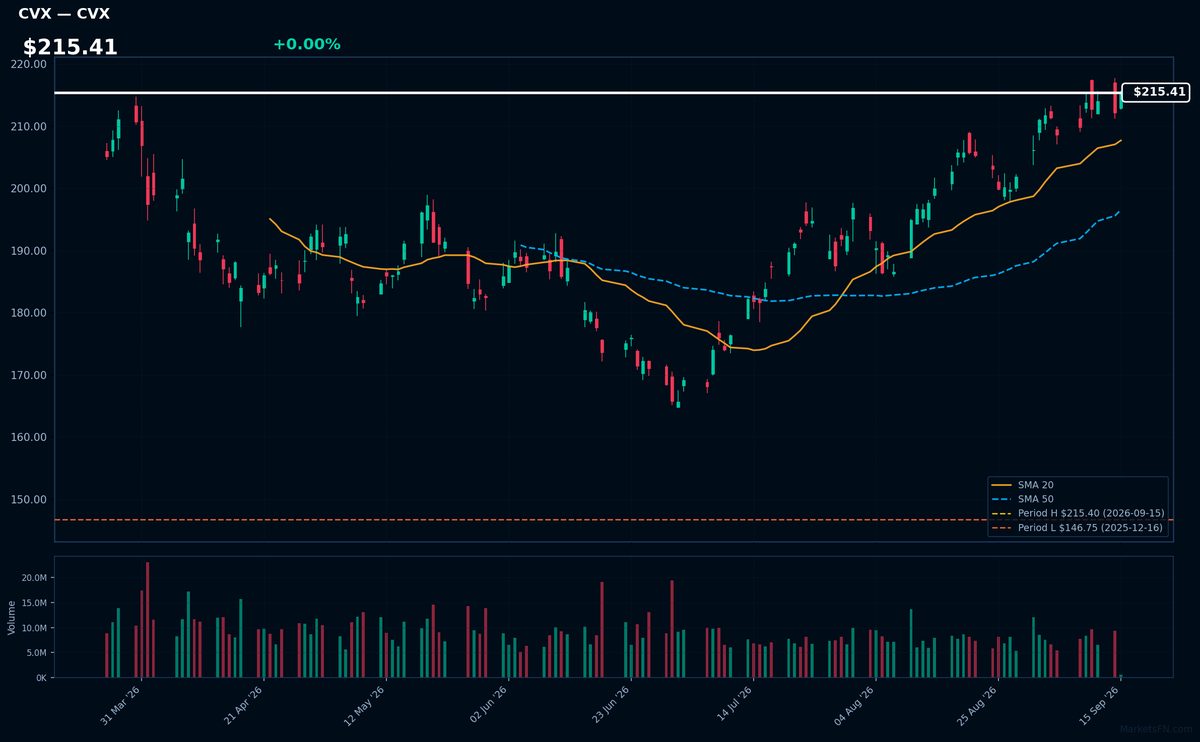
CVX | Chevron Corp | Energy | Price Last: $215.40 | % Realized: +36.93% | RSI: 68.3 | % above MA200: +17.7% | Trend: Above MA20, MA50, MA200
Chevron Corp is a multinational energy corporation that explores, produces, and transports oil and natural gas, refining and marketing petroleum products. Investors care about its energy production and pricing power amid global demand fluctuations.
Chevron Corp's RSI(14) is 68.3, indicating rising momentum. The MA alignment (price > MA20 > MA50 > MA200) suggests a sustained uptrend. With the stock 0.0% below its 52-Week high, it nears a potential breakout, reinforcing the bullish technical picture.
Related headlines
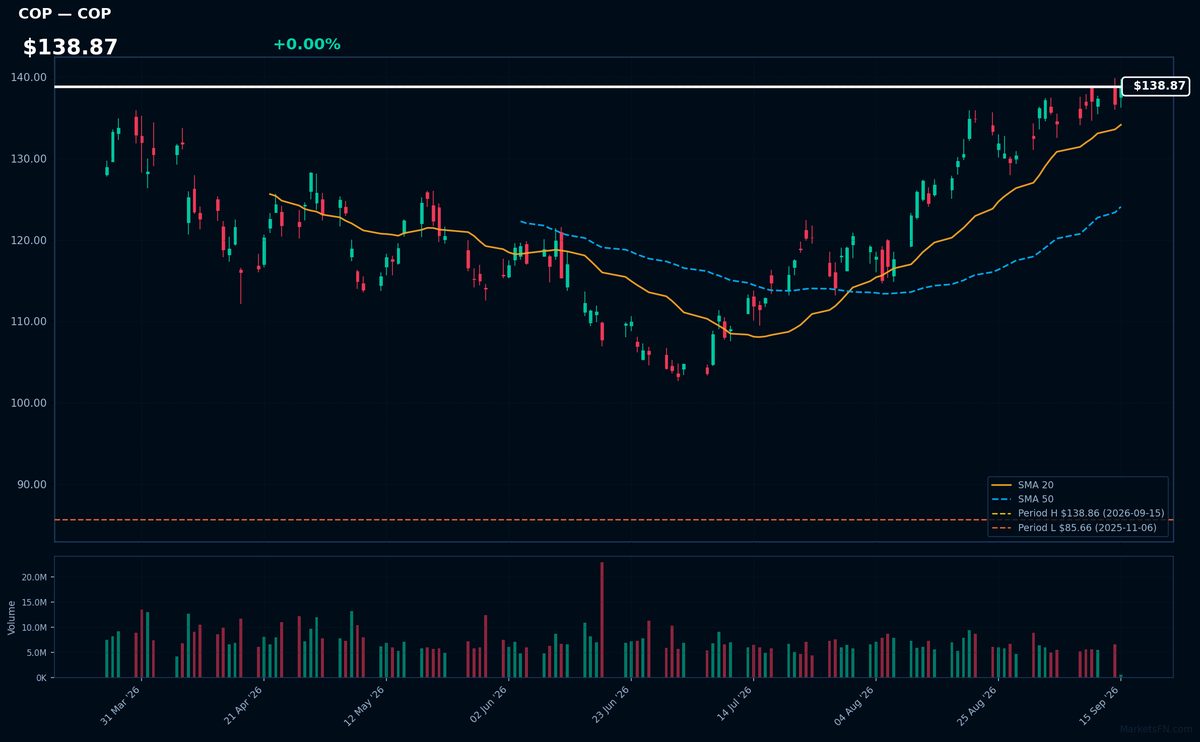
COP | Conoco Phillips | Energy | Price Last: $138.86 | % Realized: +50.40% | RSI: 68.9 | % above MA200: +21.6% | Trend: Above MA20, MA50, MA200
ConocoPhillips is an energy company focused on hydrocarbon exploration and production. Investors should care because its operational performance directly impacts energy prices and the company's profitability, influencing its stock performance.
ConocoPhillips is near a potential breakout at its 52-Week high, with RSI(14) at 68.9, indicating strong momentum. The MA alignment (price > MA20 > MA50 > MA200) confirms a sustained uptrend, suggesting continued bullishness.
Related headlines
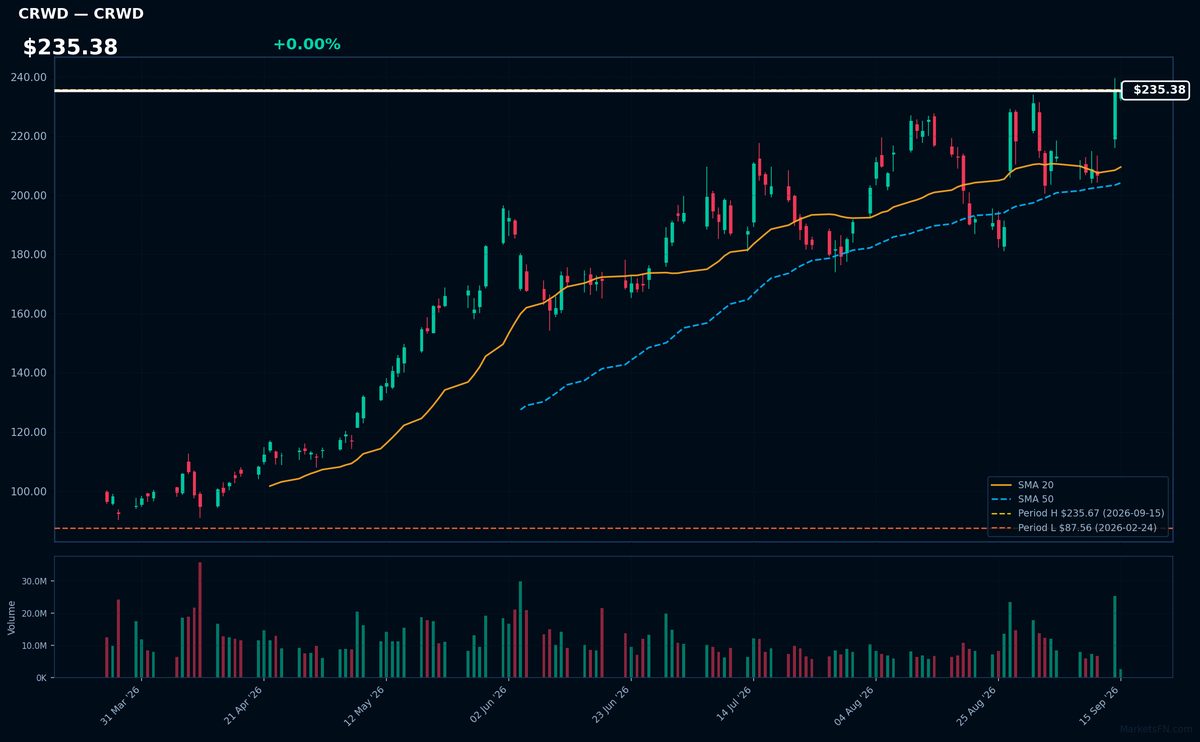
CRWD | Crowdstrike Holdings Inc | Technology | Price Last: $235.67 | % Realized: +111.95% | RSI: 62.3 | % above MA200: +62.3% | Trend: Above MA20, MA50, MA200
Crowdstrike Holdings Inc is a cybersecurity company providing cloud-delivered endpoint and cloud workload protection. Investors should care because its innovative solutions, like Falcon, have driven significant growth, making it a key player in the rapidly expanding cybersecurity market.
Crowdstrike's technicals indicate strong momentum: RSI(14) is 62.3, and the stock is in a sustained uptrend with price > MA20 > MA50 > MA200. It's 0.0% below its 52-Week high, suggesting a potential breakout.
Related headlines
- AI Safety Fears Drive Investors to J&J, Costco, and CrowdStrike for Cybersecurity
- Why Did CRWD, ELMT, OKTA Stocks Surge To 52-Week Highs Today?
- S&P 500, Nasdaq, Dow Drop On Chipmaker Weakness, Treasury Yield Pressure MSFT, NFLX, ORCL, CRWD, RBLX In Focus
- CrowdStrike and Palo Alto Networks are leading software stocks toward a never-before-seen feat
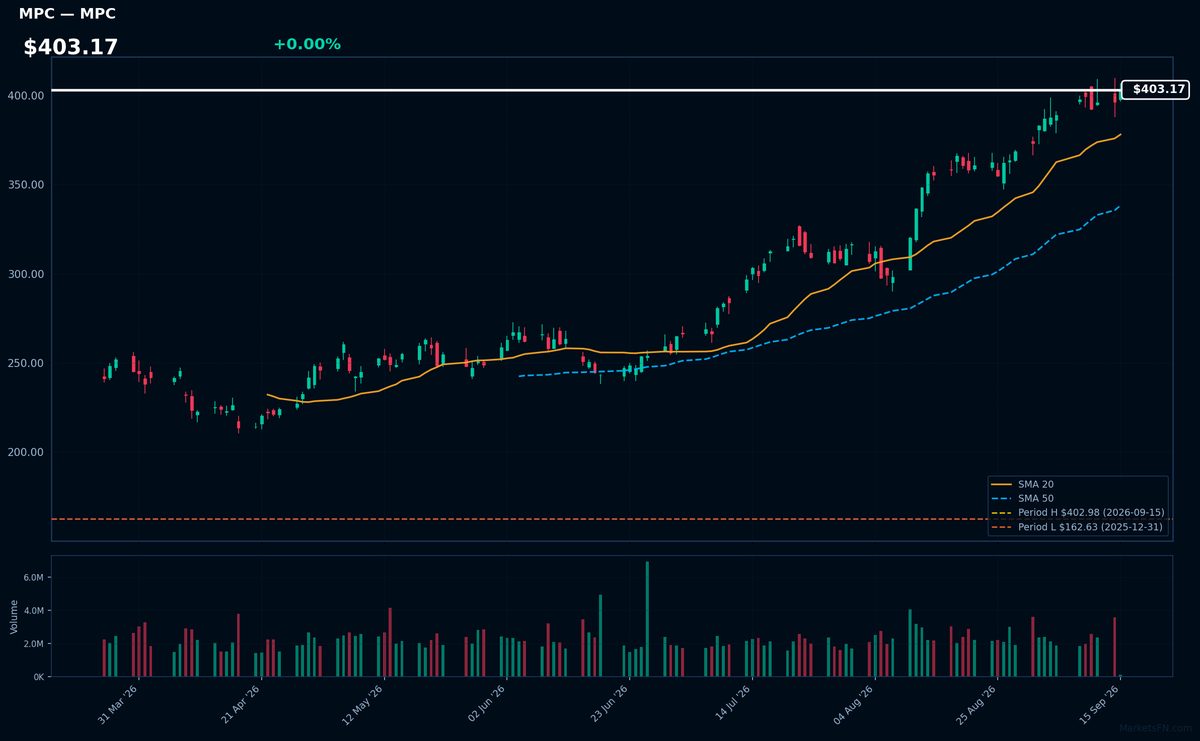
MPC | Marathon Petroleum Corp | Energy | Price Last: $402.98 | % Realized: +123.95% | RSI: 77.1 | % above MA200: +62.6% | Trend: Above MA20, MA50, MA200
Marathon Petroleum Corp is a refining, marketing, and transportation company. Investors should care because its refining operations are influenced by crude oil prices and refining margins, impacting profitability. Its retail marketing and logistics segments also contribute to revenue.
MPC's RSI(14) is 77.1, indicating strong momentum. The bullish MA alignment (price > MA20 > MA50 > MA200) and 0.0% proximity to its 52-Week high suggest a potential breakout, reinforcing the uptrend signal.
Related headlines
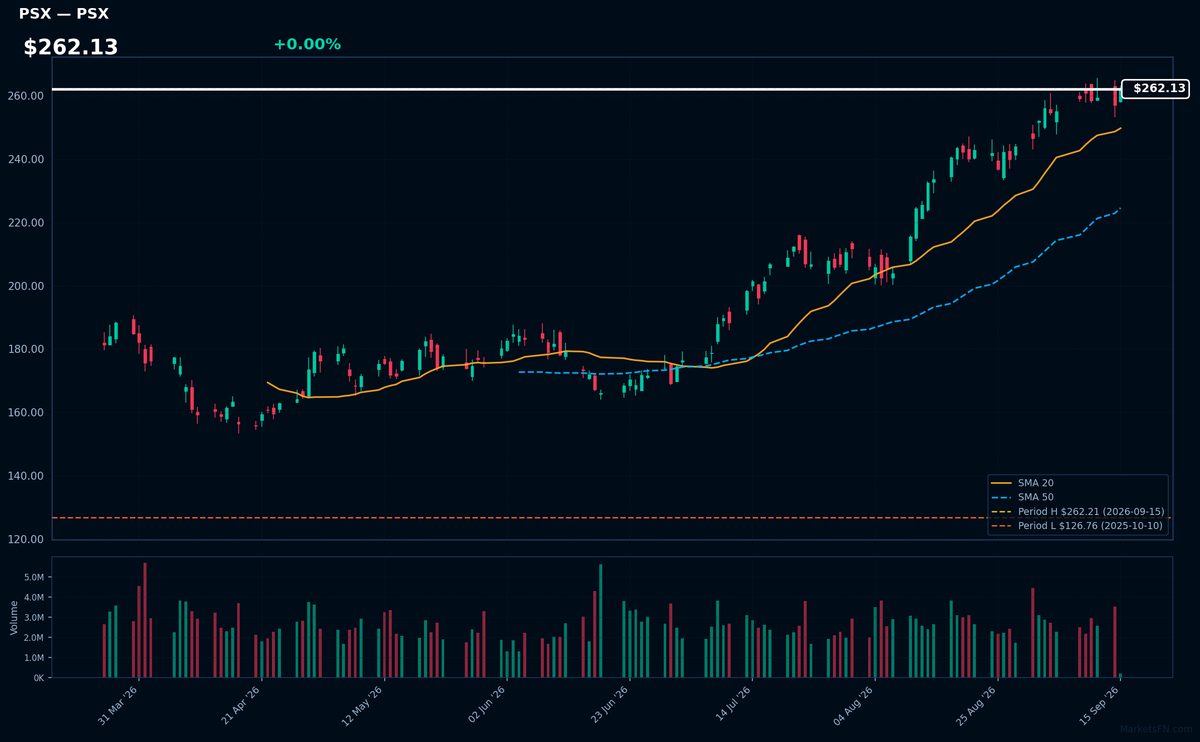
PSX | Phillips 66 | Energy | Price Last: $262.21 | % Realized: +99.89% | RSI: 73.6 | % above MA200: +48.9% | Trend: Above MA20, MA50, MA200
Phillips 66 is a diversified energy company with midstream, chemicals, refining, and marketing segments. Investors should care about its refining margins, midstream volumes, and chemicals demand, as these drive cash flow and dividend sustainability.
PSX is near a breakout at its 52-Week high, with RSI(14) at 73.6, indicating strong momentum. The bullish MA alignment (price > MA20 > MA50 > MA200) confirms a sustained uptrend, suggesting continued strength.
Related headlines
📉 Nearest to 52-Week Low
Sectors represented: Consumer Cyclical (3), Industrials (1), Healthcare (1)
| Ticker | Company | Sector | Price Last | % Realized | 52-Week Low Date | RSI | % above MA200 | Trend |
|---|---|---|---|---|---|---|---|---|
| TJX | TJX Companies, Inc | Consumer Cyclical | $125.47 | -11.12% | 2026-09-15 | 17.1 | -18.6% | Below MA20, MA50, MA200 |
| LOW | Lowe's Cos., Inc | Consumer Cyclical | $194.99 | -28.33% | 2026-09-15 | 33.1 | -17.1% | Below MA20, MA50, MA200 |
| NKE | Nike, Inc | Consumer Cyclical | $36.46 | -50.08% | 2026-09-15 | 33.6 | -28.0% | Below MA20, MA50, MA200 |
| TDG | Transdigm Group Incorporated | Industrials | $1102.49 | -14.41% | 2026-09-15 | 29.0 | -12.7% | Below MA20, MA50, MA200 |
| IDXX | Idexx Laboratories, Inc | Healthcare | $503.61 | -21.80% | 2026-09-15 | 32.7 | -16.2% | Below MA20, MA50, MA200 |
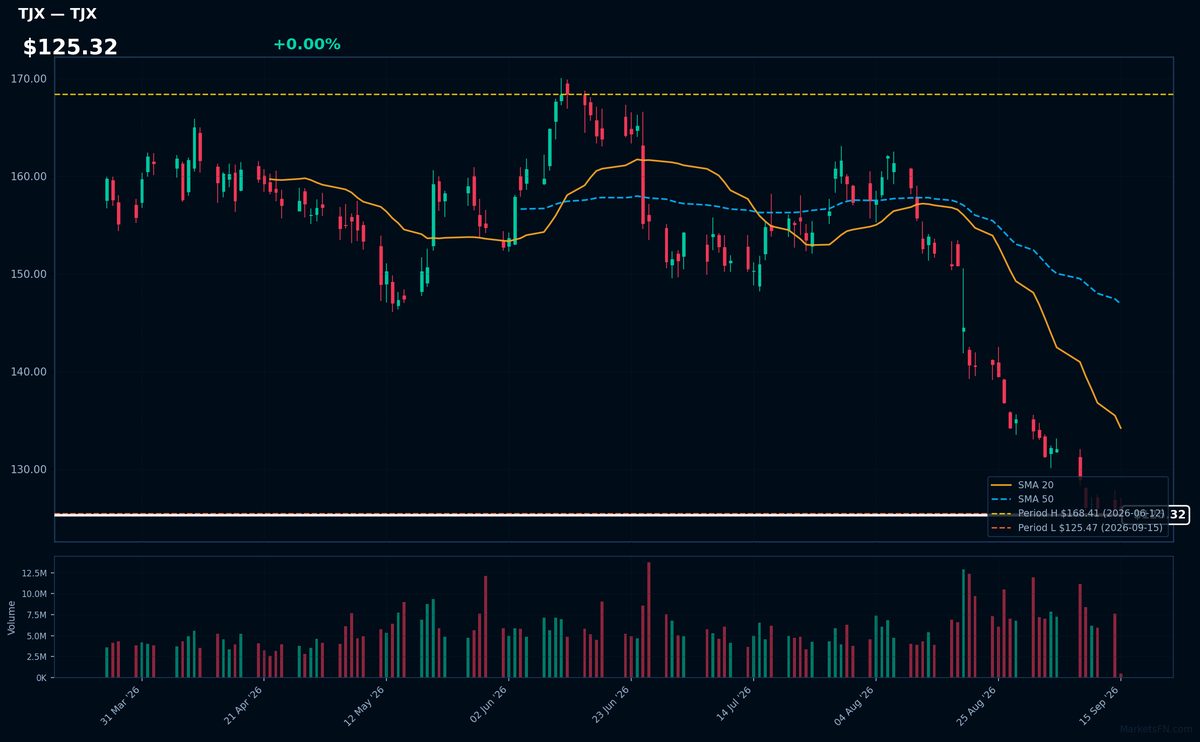
TJX | TJX Companies, Inc | Consumer Cyclical | Price Last: $125.47 | % Realized: -11.12% | RSI: 17.1 | % above MA200: -18.6% | Trend: Below MA20, MA50, MA200
TJX Companies, Inc operates off-price retail stores, offering brand-name merchandise at discounted prices. Investors should care about its ability to maintain margins and sales growth amidst competitive pressures, indicating its resilience in the retail sector.
TJX is in a sustained downtrend with price ($125.32) below MA20, MA50, and MA200. The RSI(14) is 17.1, nearing oversold territory, and the stock is 0.0% above its 52-Week low, testing major support, potentially a warning sign.
Related headlines
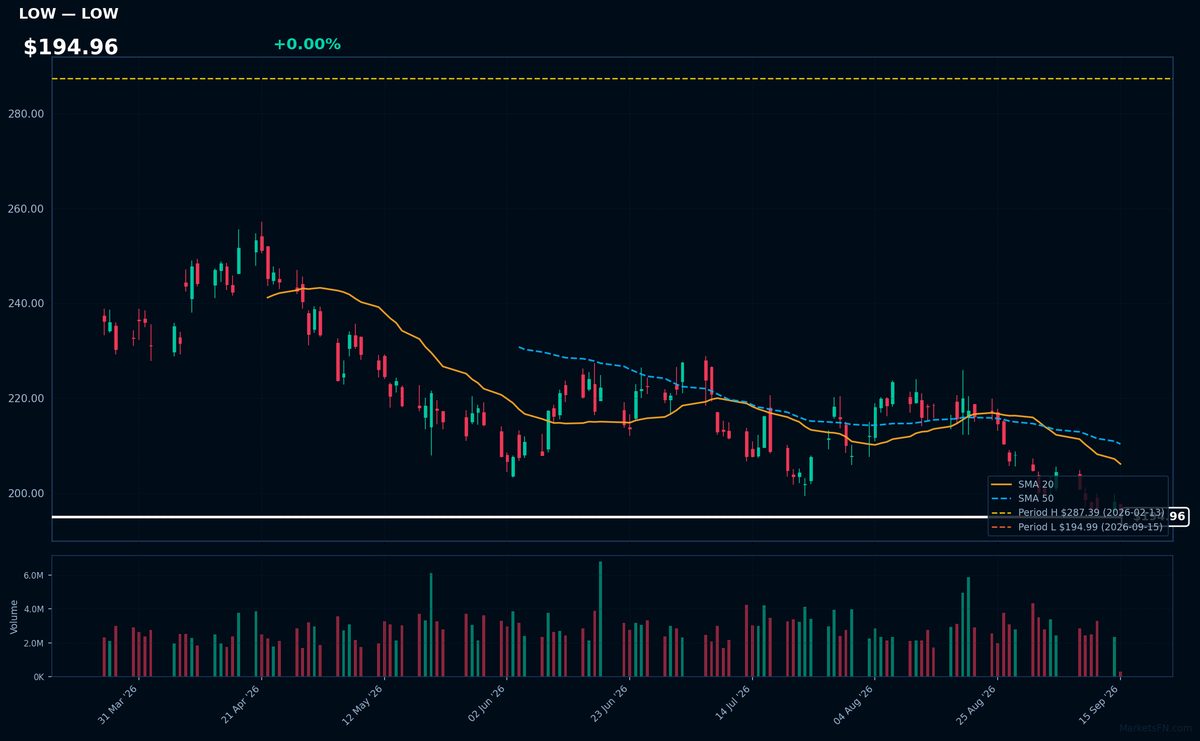
LOW | Lowe's Cos., Inc | Consumer Cyclical | Price Last: $194.99 | % Realized: -28.33% | RSI: 33.1 | % above MA200: -17.1% | Trend: Below MA20, MA50, MA200
Lowe's Cos., Inc operates as a home improvement retailer, selling products such as building materials, tools, and appliances. Investors care about its performance as it reflects housing market trends and consumer spending habits.
Lowe's is in a sustained downtrend with price ($194.96) < MA20 < MA50 < MA200. RSI(14) is 33.1, near oversold territory, and the stock is at its 52-Week low, indicating potential support testing, a warning sign for investors.
Related headlines
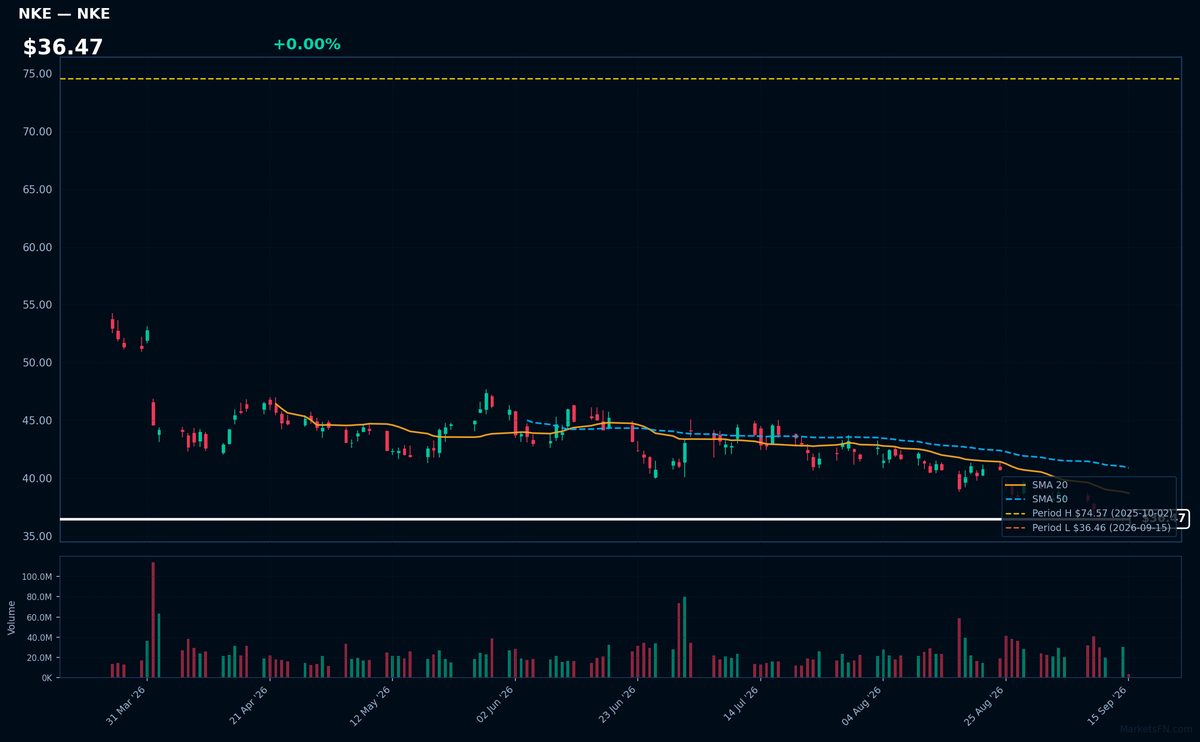
NKE | Nike, Inc | Consumer Cyclical | Price Last: $36.46 | % Realized: -50.08% | RSI: 33.6 | % above MA200: -28.0% | Trend: Below MA20, MA50, MA200
Nike, Inc designs and sells athletic footwear, apparel, and equipment. Investors should care about its brand strength, product innovation, and global distribution network, which drive revenue growth and profitability.
Nike's technical situation is bearish, with RSI(14) at 33.6, indicating oversold conditions, and a sustained downtrend as price ($36.47) remains below MA20, MA50, and MA200, with the stock testing its 52-Week low.
Related headlines
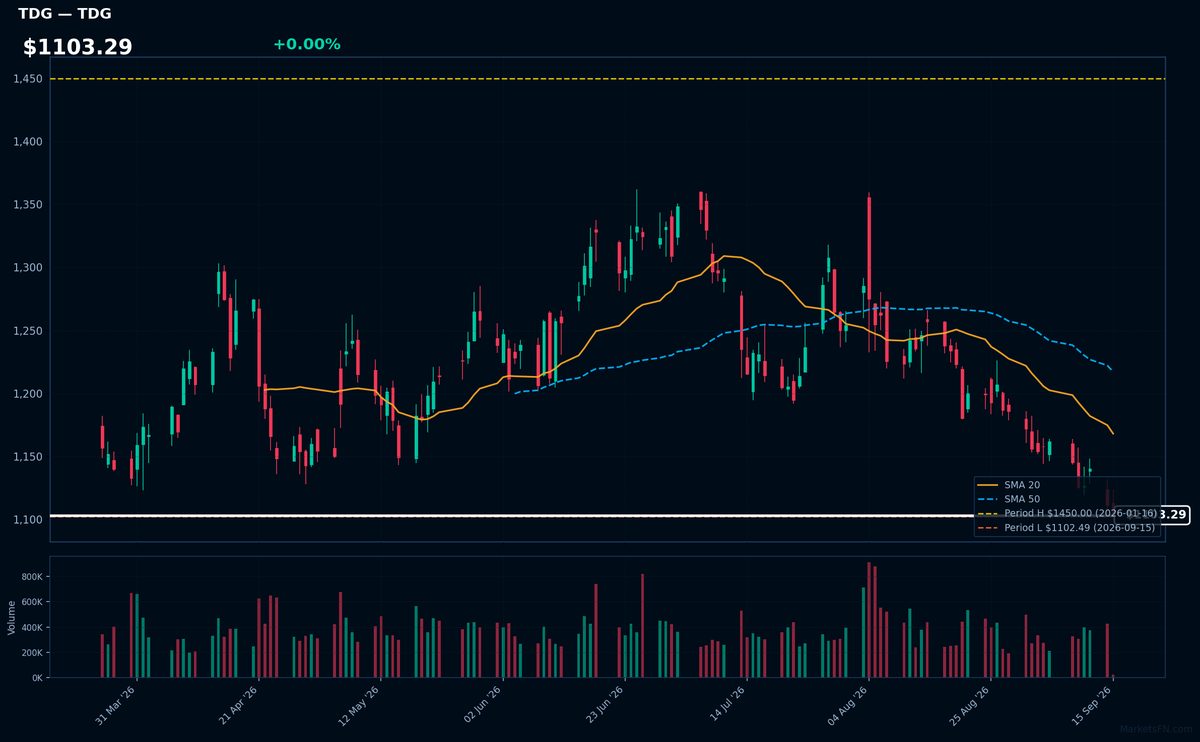
TDG | Transdigm Group Incorporated | Industrials | Price Last: $1102.49 | % Realized: -14.41% | RSI: 29.0 | % above MA200: -12.7% | Trend: Below MA20, MA50, MA200
Transdigm Group Incorporated is a leading aerospace components manufacturer, producing proprietary, highly-engineered products for commercial and defense aircraft. Investors should care due to its significant market share and potential for long-term growth driven by increasing demand for air travel and defense spending.
TDG's technical situation indicates a warning sign with an RSI(14) of 29.0, suggesting oversold conditions, and a bearish MA alignment (price < MA20 < MA50 < MA200), indicating a sustained downtrend. The stock is 0.0% above its 52-Week low, testing major support.
Related headlines
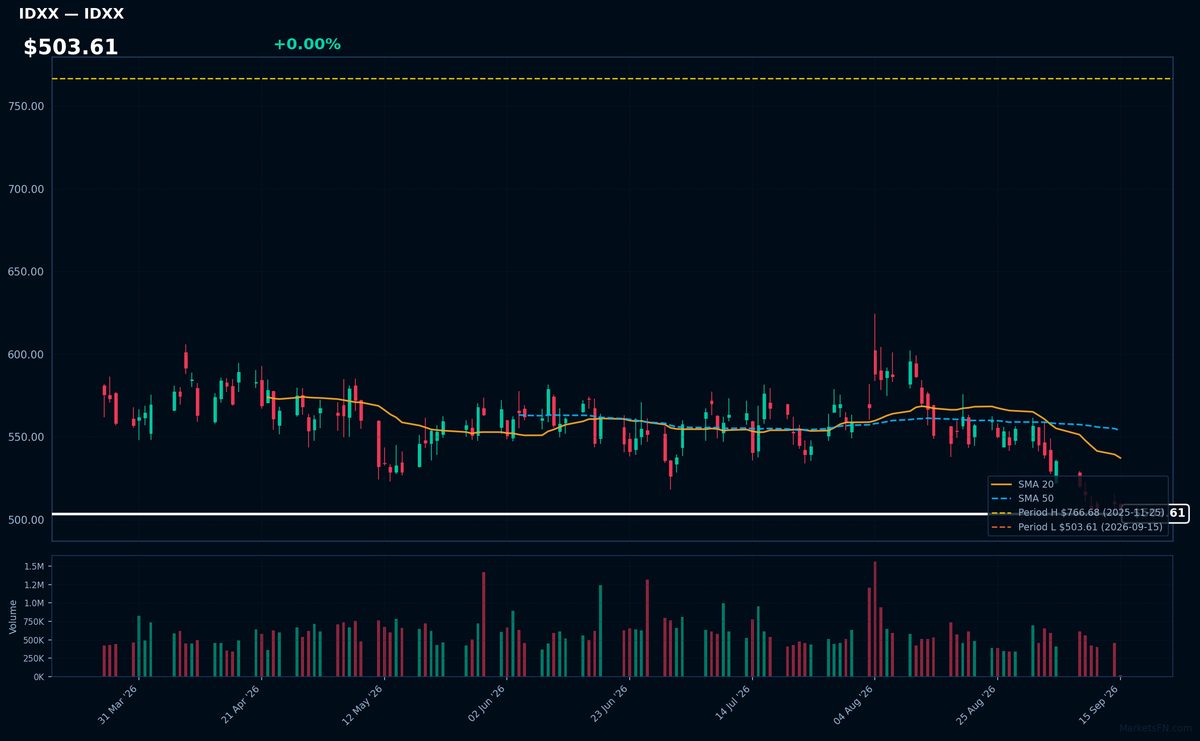
IDXX | Idexx Laboratories, Inc | Healthcare | Price Last: $503.61 | % Realized: -21.80% | RSI: 32.7 | % above MA200: -16.2% | Trend: Below MA20, MA50, MA200
Idexx Laboratories, Inc develops veterinary diagnostic products and services. Investors should care because its innovative solutions, like companion animal diagnostic tests, drive revenue growth. Its market leadership and expanding product lines are key to understanding its financial performance.
IDXX's technicals indicate a sustained downtrend with price ($503.61) below MA20, MA50, and MA200. The RSI(14) at 32.7 suggests oversold conditions, and being 0.0% above its 52-Week low signals testing of major support, potentially a warning sign for further decline.
Related headlines
- IDEXX Laboratories to Participate in Morgan Stanley 24th Annual Global Healthcare Conference
- IDEXX Expands Catalyst Platform into Cardiac Disease with First and Only Dual-Species Point-of-Care NT-proBNP Test
- IDEXX Laboratories, Inc. Q2 2026 Earnings Call Summary
- IDEXX Laboratories Inc (IDXX) (Q2 2026) Earnings Call Highlights: Strong Revenue Growth and ...
Market Commentary
The S&P 500 stocks listed are currently trading near their 52-week extremes, with some at new highs and others at new lows. Stocks like CVX, COP, and MPC are at their 52-week highs, indicating strong performance in the energy sector. Conversely, TJX, LOW, and NKE are at their 52-week lows, suggesting potential challenges in the retail and consumer staples sectors.
The concentration of energy stocks near 52-week highs may signal a rotation into sectors benefiting from current macroeconomic conditions, such as high energy prices. On the other hand, the presence of retail and consumer staples stocks near 52-week lows could indicate concerns about consumer spending and economic growth. Macro themes such as inflation, interest rates, and global demand are likely driving these price levels.
Key levels to watch include the continued performance of these stocks relative to their 52-week extremes. Potential catalysts could include earnings reports from these companies, as well as broader economic indicators that influence sector rotation and market sentiment. Monitoring these factors will be crucial in understanding the sustainability of current price levels and identifying potential future trends.
Methodology: All 503 S&P 500 constituents screened. 52-week high = highest daily close over the past 252 trading days (approx. 1 year). 52-week low = lowest daily close over the same period. Distance = (current price / extreme − 1) × 100. Technical indicators computed on up to 1 year of daily OHLCV data.
Disclaimer: For informational purposes only. Not investment advice. Past performance is not indicative of future results.

