S&P 500 52-Week Highs & Lows Radar: Berkshire Hathaway (BRK-B), Netflix (NFLX) and more
MarketsFN Team

Screening all 503 S&P 500 constituents for stocks nearest to their 52-week high and their 52-week low. Data as of October 21, 2026. % Realized = 52-week total return.
Legend: RSI > 70 = overbought · RSI < 30 = oversold · Green % Realized = positive 52W return · Red = negative.
📈 Nearest to 52-Week High
Sectors represented: Financial (3), Technology (1), Consumer Cyclical (1)
| Ticker | Company | Sector | Price Last | % Realized | 52-Week High Date | RSI | % above MA200 | Trend |
|---|---|---|---|---|---|---|---|---|
| BRK-B | Berkshire Hathaway Inc | Financial | $543.02 | +10.53% | 2026-10-21 | 80.7 | +9.9% | Above MA20, MA50, MA200 |
| V | Visa Inc | Financial | $406.67 | +17.12% | 2026-10-21 | 75.6 | +19.6% | Above MA20, MA50, MA200 |
| MA | Mastercard Incorporated | Financial | $621.67 | +8.68% | 2026-10-21 | 76.0 | +16.5% | Above MA20, MA50, MA200 |
| ADP | Automatic Data Processing Inc | Technology | $292.88 | +3.13% | 2026-10-21 | 72.4 | +22.5% | Above MA20, MA50, MA200 |
| HLT | Hilton Worldwide Holdings Inc | Consumer Cyclical | $359.43 | +35.14% | 2026-10-21 | 79.4 | +12.7% | Above MA20, MA50, MA200 |
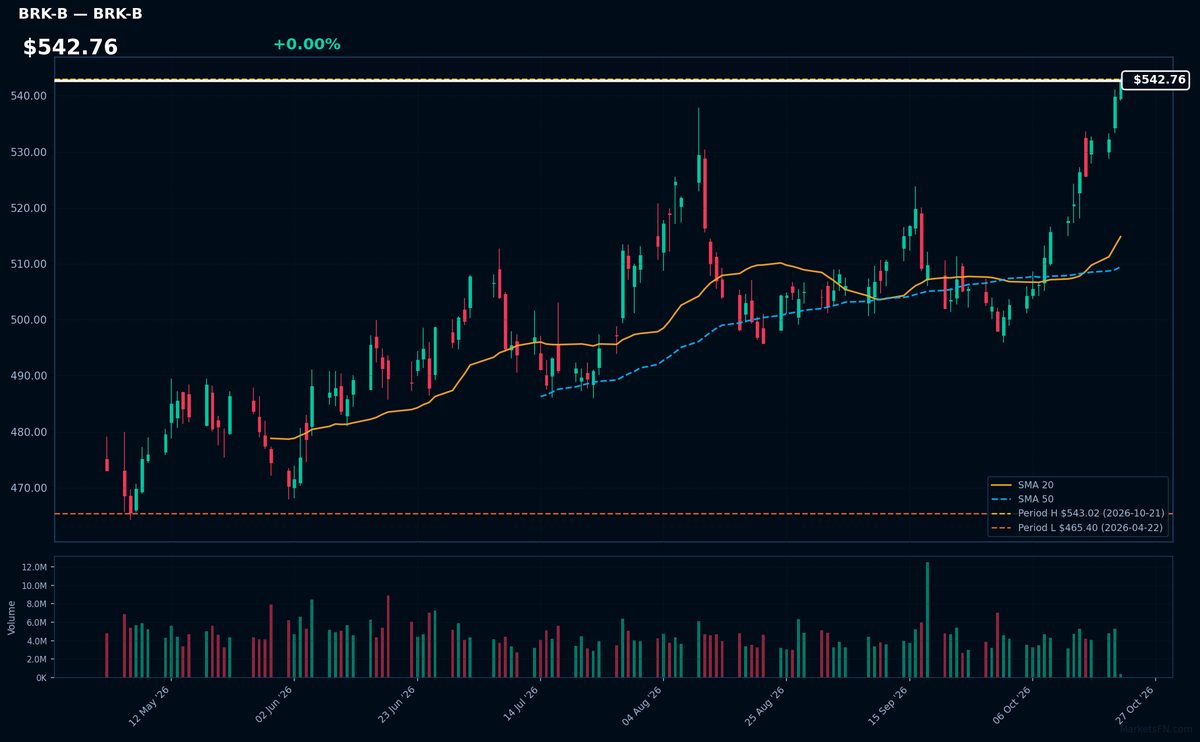
BRK-B | Berkshire Hathaway Inc | Financial | Price Last: $543.02 | % Realized: +10.53% | RSI: 80.7 | % above MA200: +9.9% | Trend: Above MA20, MA50, MA200
Berkshire Hathaway is a diversified holding company with major insurance operations (GEICO), railroads (BNSF), utilities, and stakes in Apple, Coca-Cola, and others. Investors care for its unique value-investing approach under Warren Buffett and exposure to both defensive and growth sectors through wholly-owned businesses and equity investments.
Technically, BRK-B shows strong momentum with an RSI(14) of 80.7 (overbought) and bullish MA alignment (price > MA20 > MA50 > MA200). At 0.0% below its 52-week high, the stock tests breakout levels after gaining 10.5% over the past year — a sign of sustained demand but extended near-term.
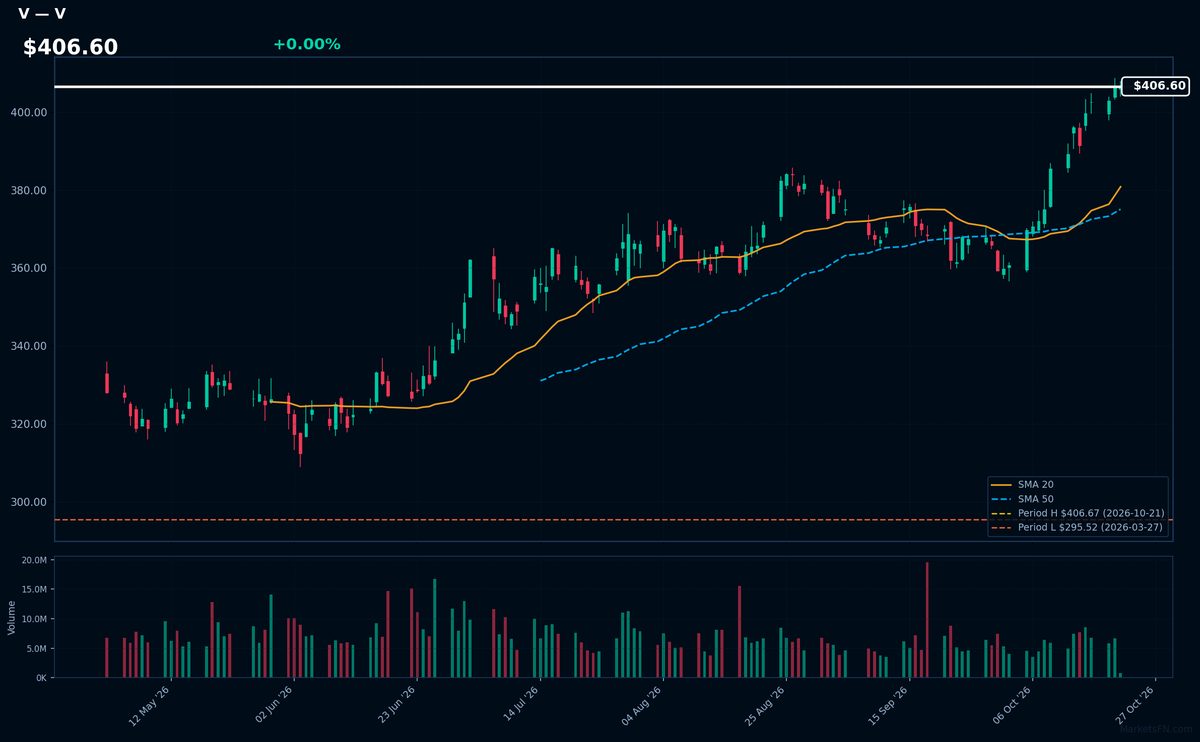
V | Visa Inc | Financial | Price Last: $406.67 | % Realized: +17.12% | RSI: 75.6 | % above MA200: +19.6% | Trend: Above MA20, MA50, MA200
Visa operates the world's largest electronic payments network, processing over $14 trillion annually. Investors care because its asset-light model generates 60%+ operating margins as global cashless adoption grows, with pricing power from its entrenched duopoly position alongside Mastercard.
Technically overbought (RSI 75.6) but bullish MA alignment (price > MA20 > MA50 > MA200) suggests sustained momentum. At 52-week highs (+17.1% YTD), watch for breakout confirmation or RSI reversal.
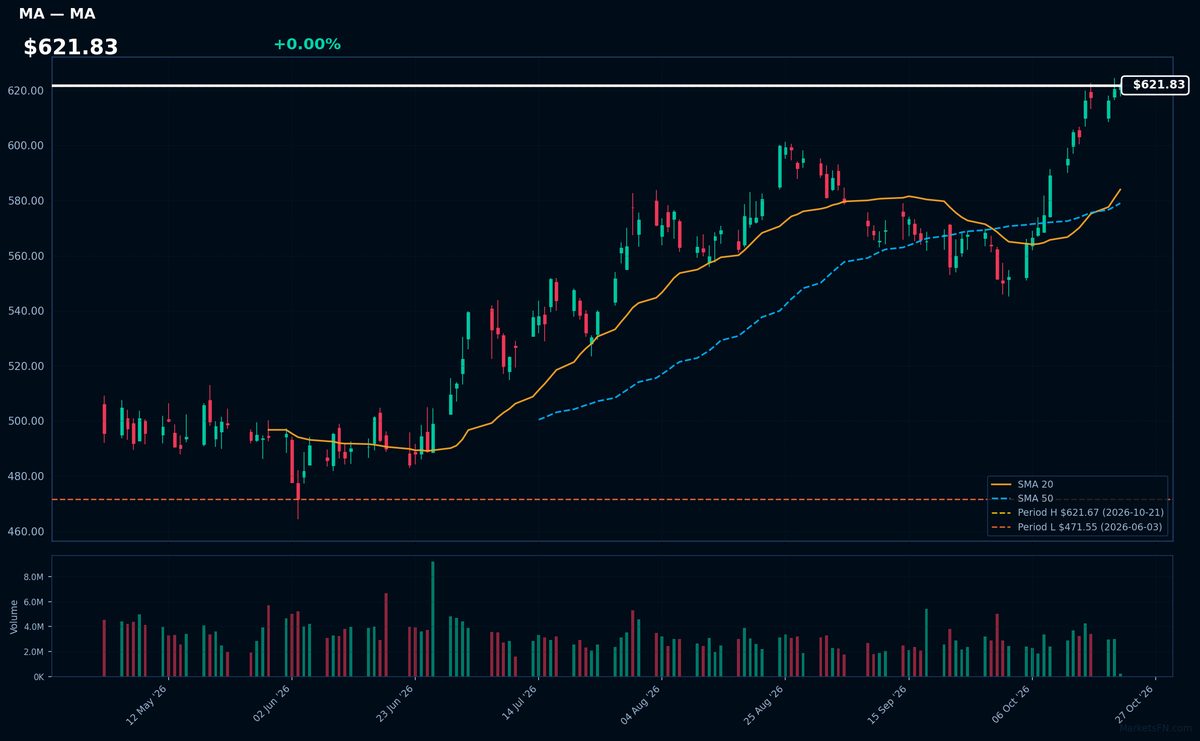
MA | Mastercard Incorporated | Financial | Price Last: $621.67 | % Realized: +8.68% | RSI: 76.0 | % above MA200: +16.5% | Trend: Above MA20, MA50, MA200
Mastercard operates the world's second-largest payment network, processing $9.9 trillion in annual volume. Investors care because its asset-light model extracts fees from global commerce growth with minimal capital expenditure, yielding 40%+ operating margins — a structural advantage as cashless adoption accelerates in emerging markets.
Technically bullish at $621.83 (RSI 76 shows overbought conditions, but price > MA20 > MA50 > MA200 confirms uptrend). The 0% distance from 52-week high and 8.7% annual return suggest momentum, though RSI warns of potential near-term consolidation after this sustained move.
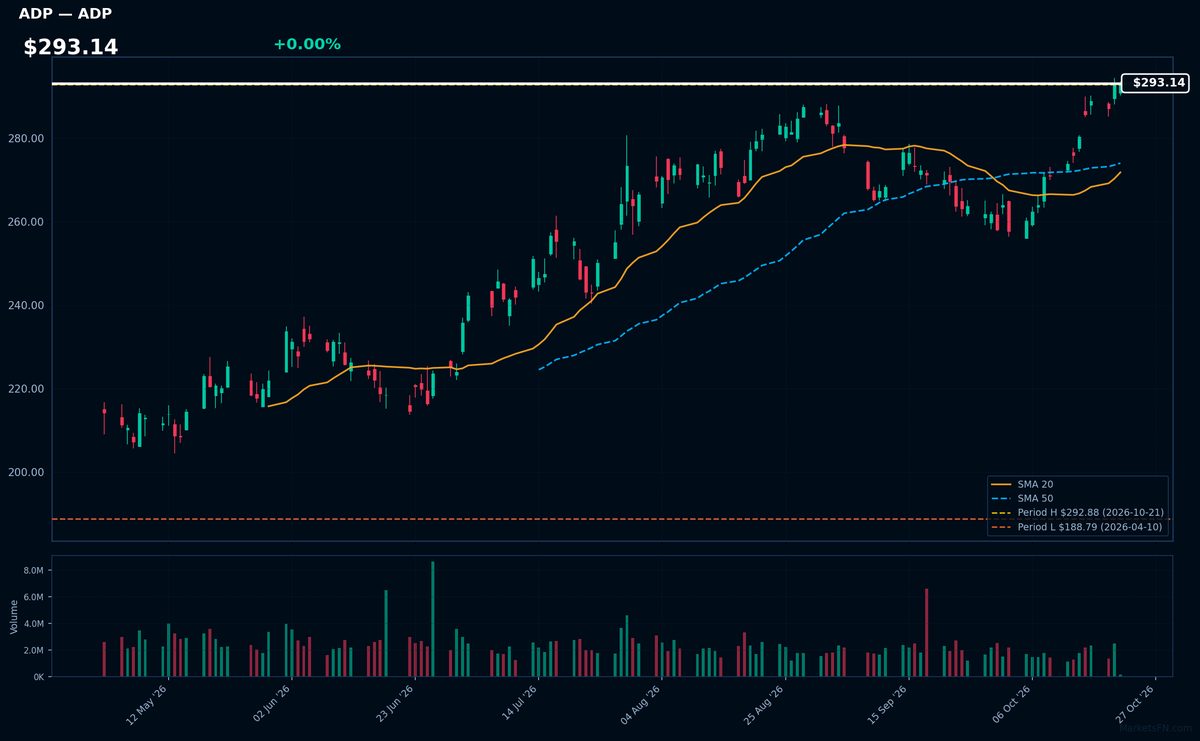
ADP | Automatic Data Processing Inc | Technology | Price Last: $292.88 | % Realized: +3.13% | RSI: 72.4 | % above MA200: +22.5% | Trend: Above MA20, MA50, MA200
ADP provides payroll processing and HR solutions to businesses globally, with recurring revenue from essential back-office services. Investors value its stable cash flows in economic cycles and growth potential from workforce digitization trends.
At $293.14, ADP trades 0.0% below its 52-week high with an overbought RSI(14) of 72.4. Mixed MA alignment (above MA20/MA50/MA200) suggests consolidation after a 3.1% yearly gain — monitor for breakout confirmation or pullback.
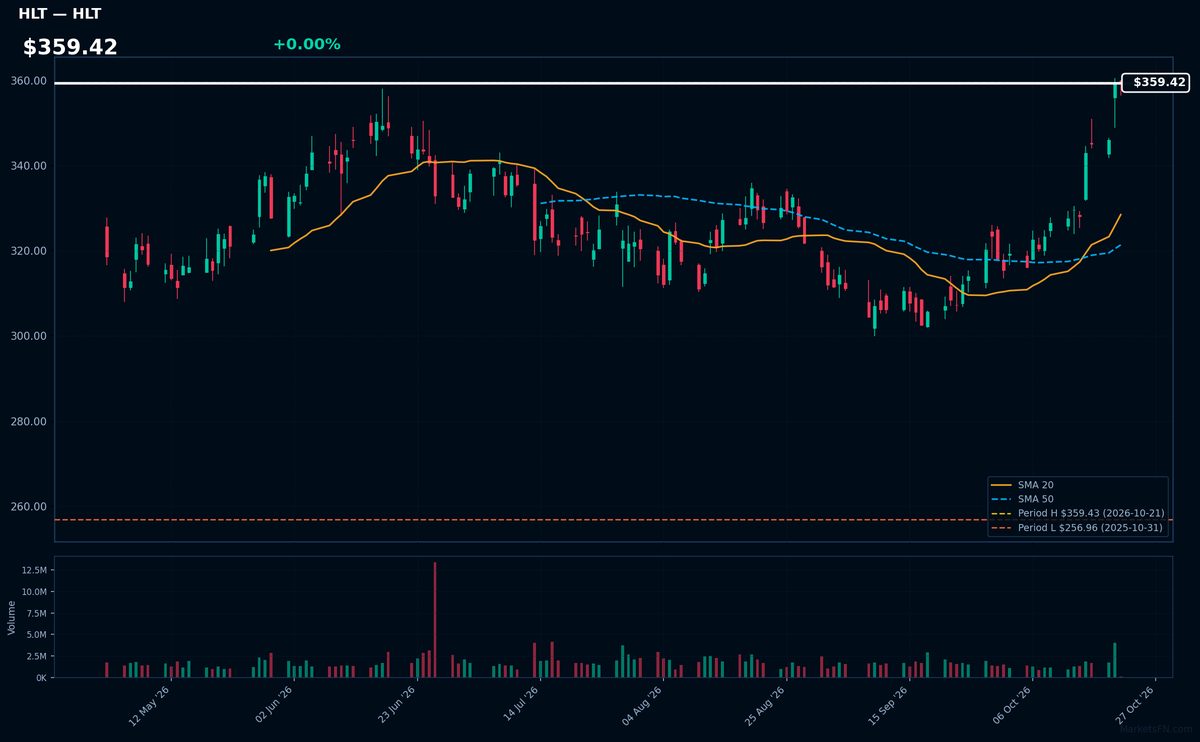
HLT | Hilton Worldwide Holdings Inc | Consumer Cyclical | Price Last: $359.43 | % Realized: +35.14% | RSI: 79.4 | % above MA200: +12.7% | Trend: Above MA20, MA50, MA200
Hilton Worldwide operates a global portfolio of hotel brands across luxury, full-service, and limited-service segments, including Waldorf Astoria, Conrad, and Hampton. Investors care for its asset-light franchise model generating high-margin recurring fees and exposure to resilient global travel demand.
HLT shows extreme bullish momentum (RSI 79.4, price > MA20 > MA50 > MA200) but nears overbought territory after a 35.1% 52-week rally. The 0.0% gap to 52-week highs suggests either breakout potential or exhaustion.
📉 Nearest to 52-Week Low
Sectors represented: Consumer Cyclical (3), Communication Services (2)
| Ticker | Company | Sector | Price Last | % Realized | 52-Week Low Date | RSI | % above MA200 | Trend |
|---|---|---|---|---|---|---|---|---|
| NFLX | Netflix Inc | Communication Services | $66.83 | -46.16% | 2026-10-21 | 36.2 | -19.0% | Below MA20, MA50, MA200 |
| PSKY | Paramount Skydance Corp | Communication Services | $6.91 | -13.08% | 2026-10-16 | 34.7 | — | — |
| LKQ | LKQ Corp | Consumer Cyclical | $21.53 | -29.59% | 2026-10-19 | 33.8 | -22.2% | Below MA20, MA50, MA200 |
| CMG | Chipotle Mexican Grill | Consumer Cyclical | $28.26 | -33.28% | 2026-06-04 | 27.3 | -17.9% | Below MA20, MA50, MA200 |
| MGM | MGM Resorts International | Consumer Cyclical | $28.83 | -12.37% | 2026-10-19 | 22.1 | -26.6% | Below MA20, MA50, MA200 |
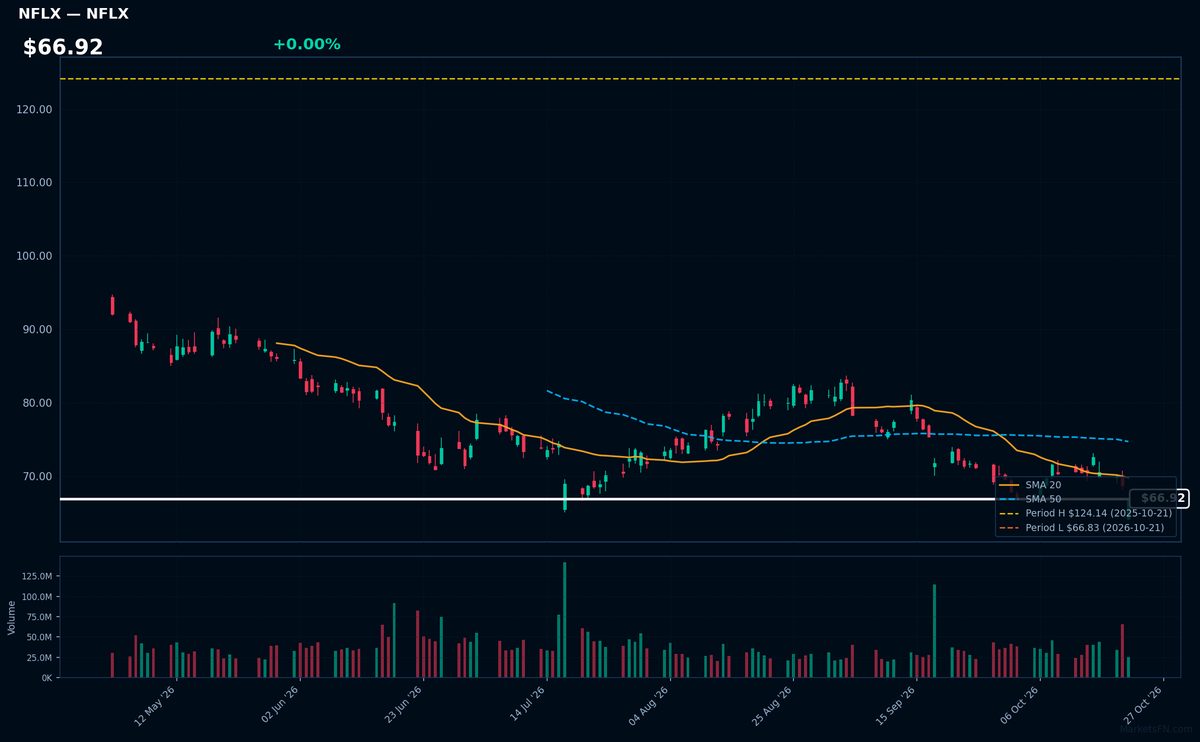
NFLX | Netflix Inc | Communication Services | Price Last: $66.83 | % Realized: -46.16% | RSI: 36.2 | % above MA200: -19.0% | Trend: Below MA20, MA50, MA200
Netflix Inc dominates global streaming with 220M+ subscribers, pioneering original content while facing intensifying competition. Investors care due to its first-mover advantage, pricing power, and international growth potential despite maturing US penetration and content cost pressures.
Netflix shows extreme technical weakness: RSI(14) at 36.2 (nearing oversold) with bearish MA alignment (price < MA20 < MA50 < MA200) and -46.2% 52-week return. Testing 52-week lows signals breakdown risk unless fundamentals reverse.
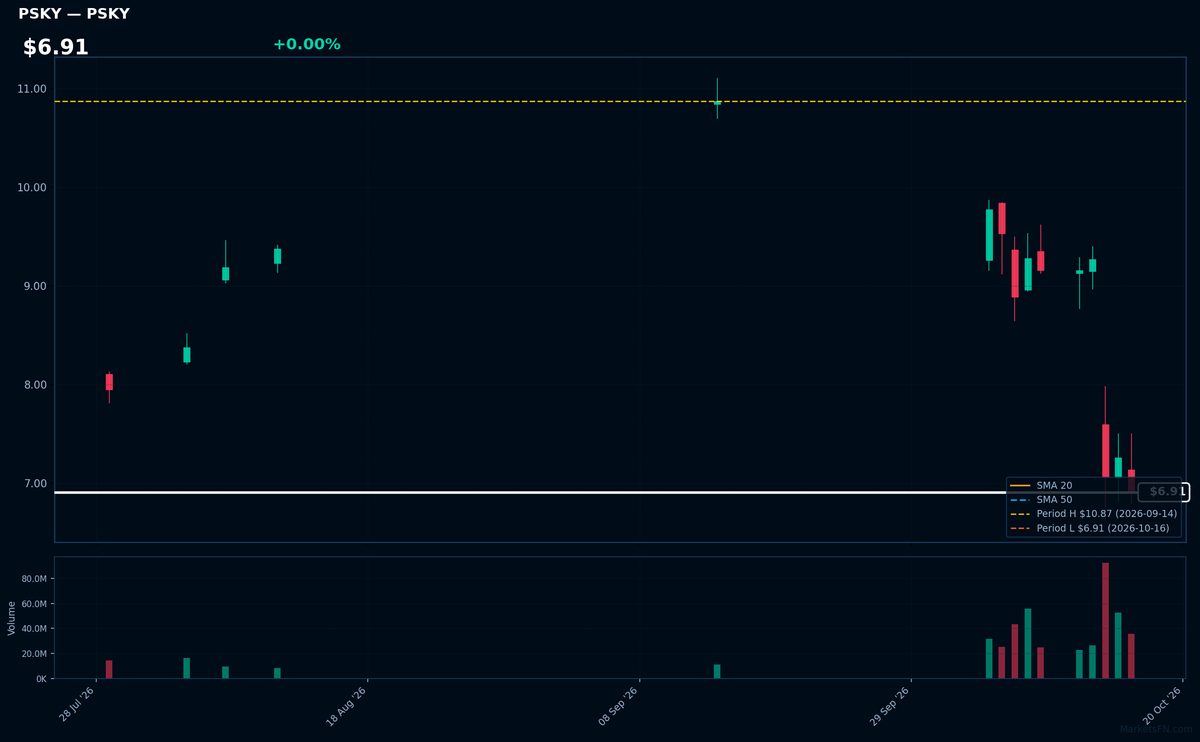
PSKY | Paramount Skydance Corp | Communication Services | Price Last: $6.91 | % Realized: -13.08% | RSI: 34.7 | % above MA200: — | Trend: —
Paramount Skydance Corp operates in the entertainment sector, specializing in film/TV production and streaming content. Investors watch PSKY for its IP portfolio and merger potential in a consolidating media landscape, though streaming profitability challenges persist.
Technically concerning — PSKY trades just 0.0% above 52-week lows with oversold RSI(14) at 34.7. The -13.1% annual return reflects sustained selling pressure, though incomplete MA data limits trend confirmation. Extreme proximity to support warrants caution.
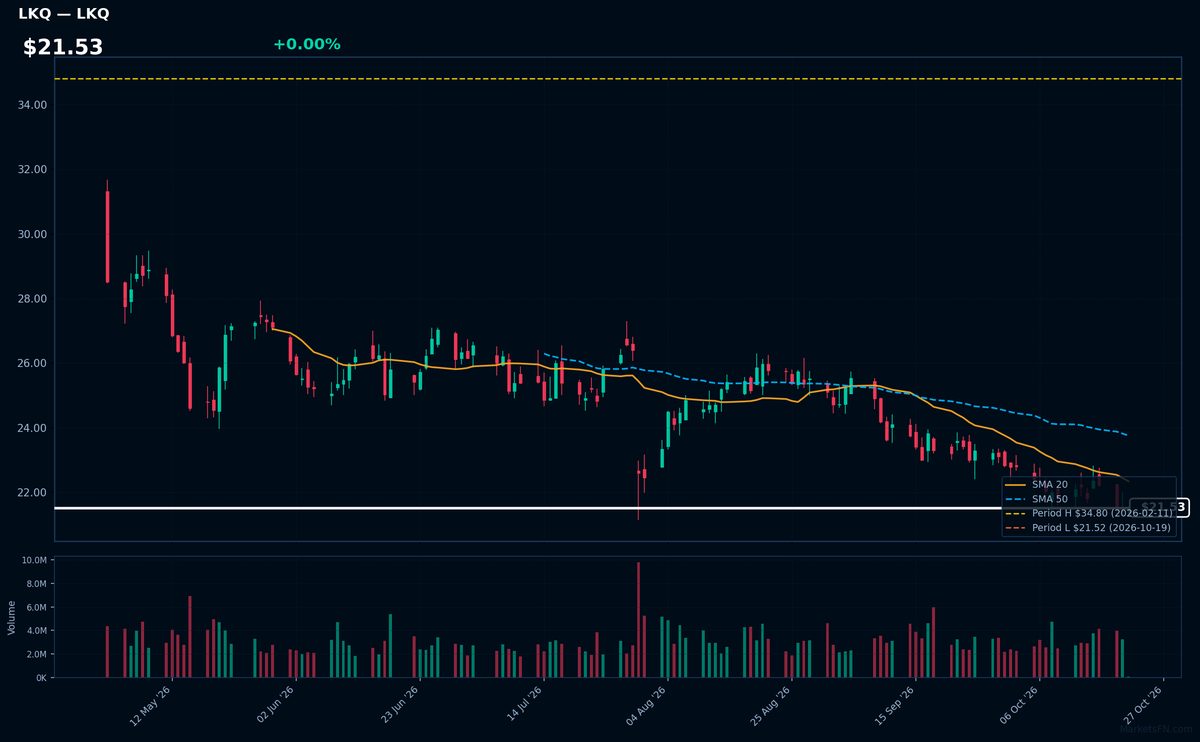
LKQ | LKQ Corp | Consumer Cyclical | Price Last: $21.53 | % Realized: -29.59% | RSI: 33.8 | % above MA200: -22.2% | Trend: Below MA20, MA50, MA200
LKQ Corp supplies replacement parts for vehicles, focusing on aftermarket and recycled components. Investors should note its essential role in cost-conscious auto repairs, serving both consumers and insurers in a fragmented $50B+ North American market.
LKQ shows severe technical weakness: RSI(14) at 33.8 signals near-oversold conditions, while bearish MA alignment (price < MA20 < MA50 < MA200) confirms sustained downtrend. The stock tests 52-week lows after a 29.6% annual decline—a clear warning sign.
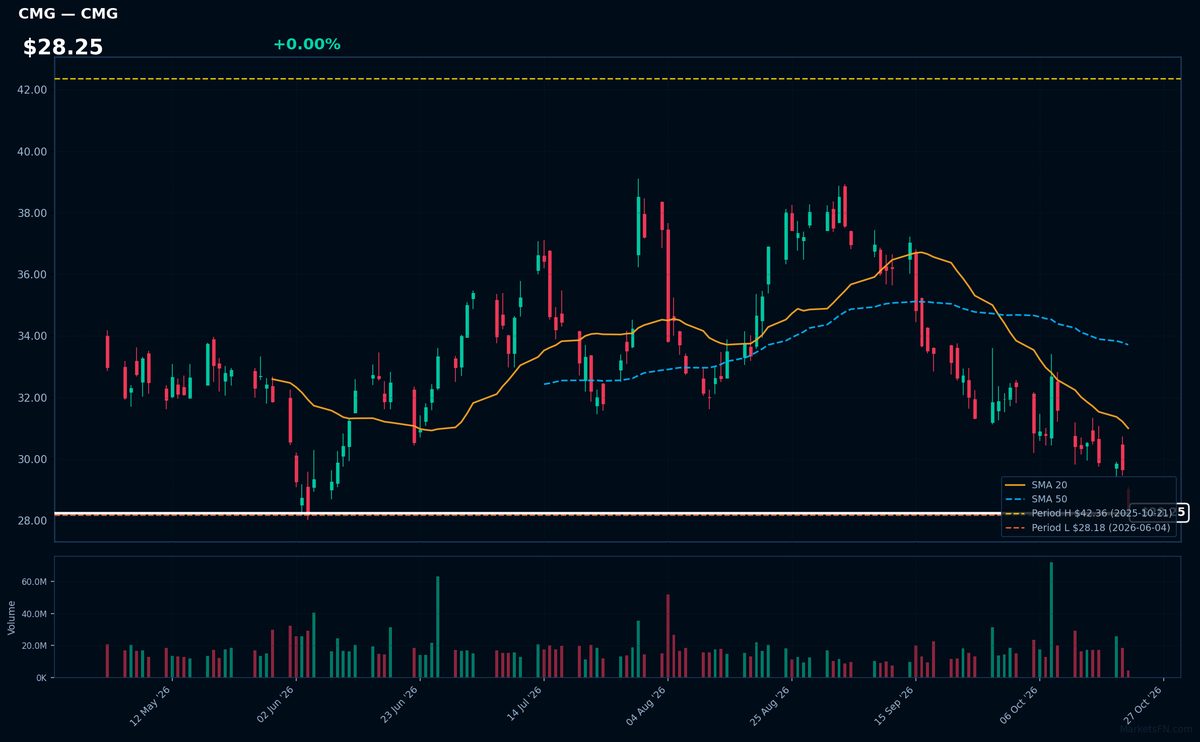
CMG | Chipotle Mexican Grill | Consumer Cyclical | Price Last: $28.26 | % Realized: -33.28% | RSI: 27.3 | % above MA200: -17.9% | Trend: Below MA20, MA50, MA200
Chipotle Mexican Grill operates fast-casual Mexican restaurants emphasizing fresh ingredients and customizable meals. Investors watch CMG for its premium brand positioning, direct exposure to consumer discretionary spending, and industry-leading unit economics in the high-growth fast-casual segment.
CMG shows extreme technical weakness: RSI(14) at 27.3 (oversold), bearish MA alignment (price < MA20 < MA50 < MA200), and hovering just 0.3% above 52-week lows after a 33.3% annual decline. This signals severe downside momentum, not fundamental strength.
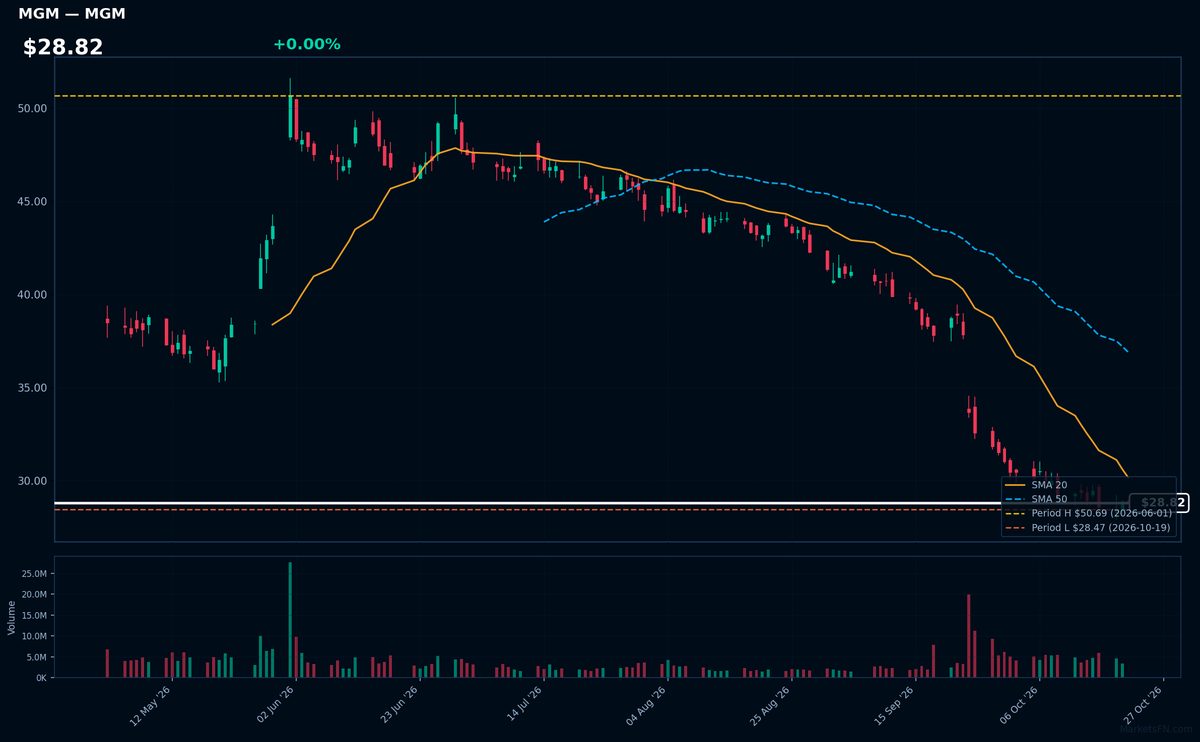
MGM | MGM Resorts International | Consumer Cyclical | Price Last: $28.83 | % Realized: -12.37% | RSI: 22.1 | % above MA200: -26.6% | Trend: Below MA20, MA50, MA200
MGM Resorts International operates luxury casinos, hotels, and entertainment venues in Las Vegas and regional US markets. Investors watch MGM for exposure to discretionary consumer spending, gaming demand cycles, and high-margin resort operations in key tourism hubs.
MGM shows extreme technical weakness: RSI(14) at 22.1 (oversold) with bearish MA alignment (price < MA20 < MA50 < MA200). Trading just 1.3% above 52-week lows after a 12.4% annual decline signals sustained downtrend pressure. Critical support test underway.
Market Commentary
The concentration of blue-chip financial and consumer discretionary names like BRK-B, V, MA, ADP, and HLT at 52-week highs signals persistent institutional demand for quality compounders with pricing power and recession-resistant cash flows. Conversely, NFLX, PSKY, and MGM hovering near 52-week lows reflect growth-to-value rotation and streaming/content oversaturation concerns. These extremes highlight bifurcated market leadership favoring companies with durable economic moats.
Sector rotation reveals defensive positioning, with payment processors (V, MA) and payroll services (ADP) benefiting from sticky transactional revenues, while leisure (HLT) capitalizes on travel demand. The lows cohort shows streaming (NFLX, PSKY) grappling with subscriber fatigue and casinos (MGM) facing Macau headwinds. Chipotle's (CMG) proximity to lows suggests consumer trade-down risks, contrasting with its typical premium positioning.
Key levels to monitor include BRK-B's $420 resistance (near current levels) as a proxy for broad market risk appetite, while NFLX breaking below $380 could trigger algorithmic selling. Catalysts for highs group include Fed policy clarity supporting financials; for lows, PSKY's merger completion and CMG's margin resilience on menu pricing may offer relief. These technical extremes warrant caution against mean-reversion setups until fundamental confirmations emerge.
Methodology: All 503 S&P 500 constituents screened. 52-week high = highest daily close over the past 252 trading days (approx. 1 year). 52-week low = lowest daily close over the same period. Distance = (current price / extreme − 1) × 100. Technical indicators computed on up to 1 year of daily OHLCV data.
Disclaimer: For informational purposes only. Not investment advice. Past performance is not indicative of future results.