S&P 500 52-Week Highs & Lows Radar: Arista Networks (ANET), Comcast (CMCSA) and more
MarketsFN Team

S&P 500 52-Week Highs & Lows Radar: Arista Networks (ANET), Comcast (CMCSA) and more
Screening all 503 S&P 500 constituents for stocks nearest to their 52-week high and their 52-week low. Data as of October 08, 2026. % Realized = 52-week total return.
Legend: RSI > 70 = overbought · RSI < 30 = oversold · Green % Realized = positive 52W return · Red = negative.
📈 Nearest to 52-Week High
Sectors represented: Energy (3), Technology (1), Healthcare (1)
| Ticker | Company | Sector | Price Last | % Realized | 52-Week High Date | RSI | % above MA200 | Trend |
|---|---|---|---|---|---|---|---|---|
| ANET | Arista Networks Inc | Technology | $216.36 | +37.49% | 2026-10-08 | 67.6 | +34.7% | Above MA20, MA50, MA200 |
| MPC | Marathon Petroleum Corp | Energy | $456.34 | +141.82% | 2026-10-08 | 78.3 | +70.8% | Above MA20, MA50, MA200 |
| PSX | Phillips 66 | Energy | $276.50 | +110.59% | 2026-10-08 | 71.9 | +48.0% | Above MA20, MA50, MA200 |
| VLO | Valero Energy Corp | Energy | $434.78 | +167.66% | 2026-10-08 | 74.9 | +63.7% | Above MA20, MA50, MA200 |
| TECH | Bio-Techne Corp | Healthcare | $72.54 | +19.78% | 2026-09-25 | 58.3 | +16.4% | Above MA20, MA50, MA200 |
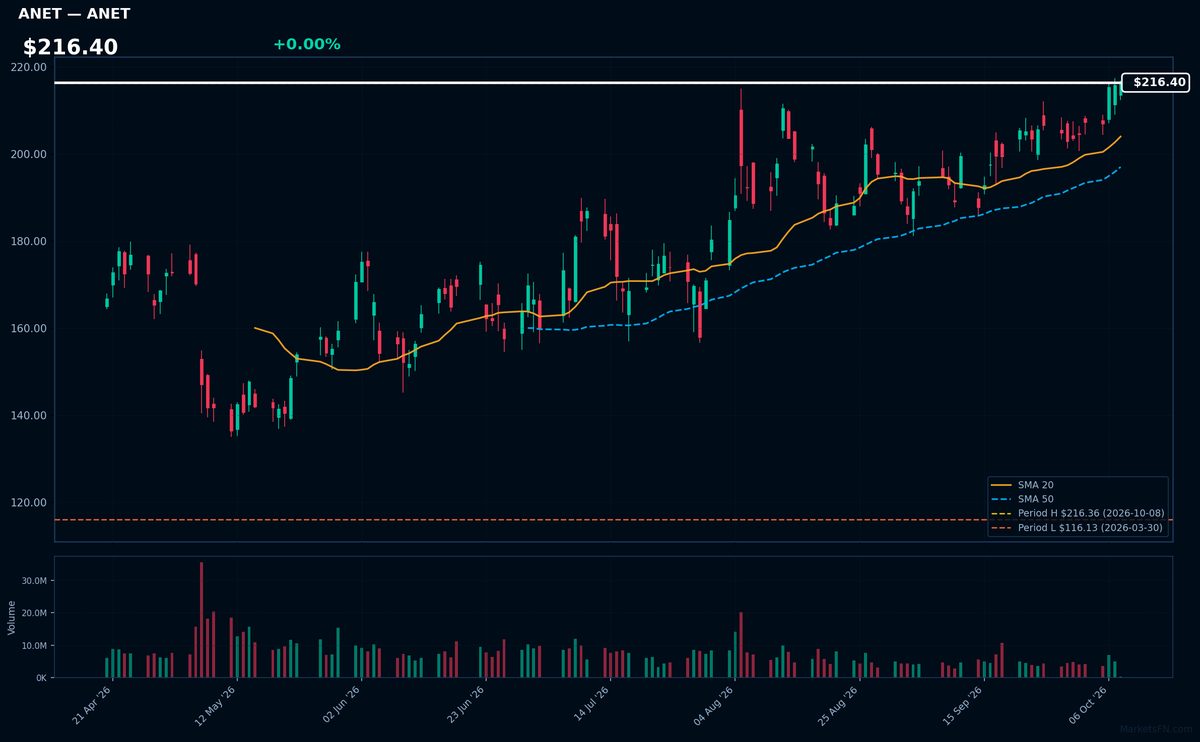
ANET | Arista Networks Inc | Technology | Price Last: $216.36 | % Realized: +37.49% | RSI: 67.6 | % above MA200: +34.7% | Trend: Above MA20, MA50, MA200
Arista Networks provides cloud networking solutions for data centers and campus environments, specializing in high-performance switches and software. Investors should care because its products are critical for AI/ML workloads and hyperscale cloud infrastructure, positioning it for sustained growth in the data-driven economy.
ANET shows strong bullish momentum with RSI(14) at 67.6 and price > MA20 > MA50 > MA200. Trading at its 52-week high (0.0% below) after a 37.5% yearly gain, the technical setup suggests continuation potential, though RSI nears overbought territory. MA alignment confirms the sustained uptrend.
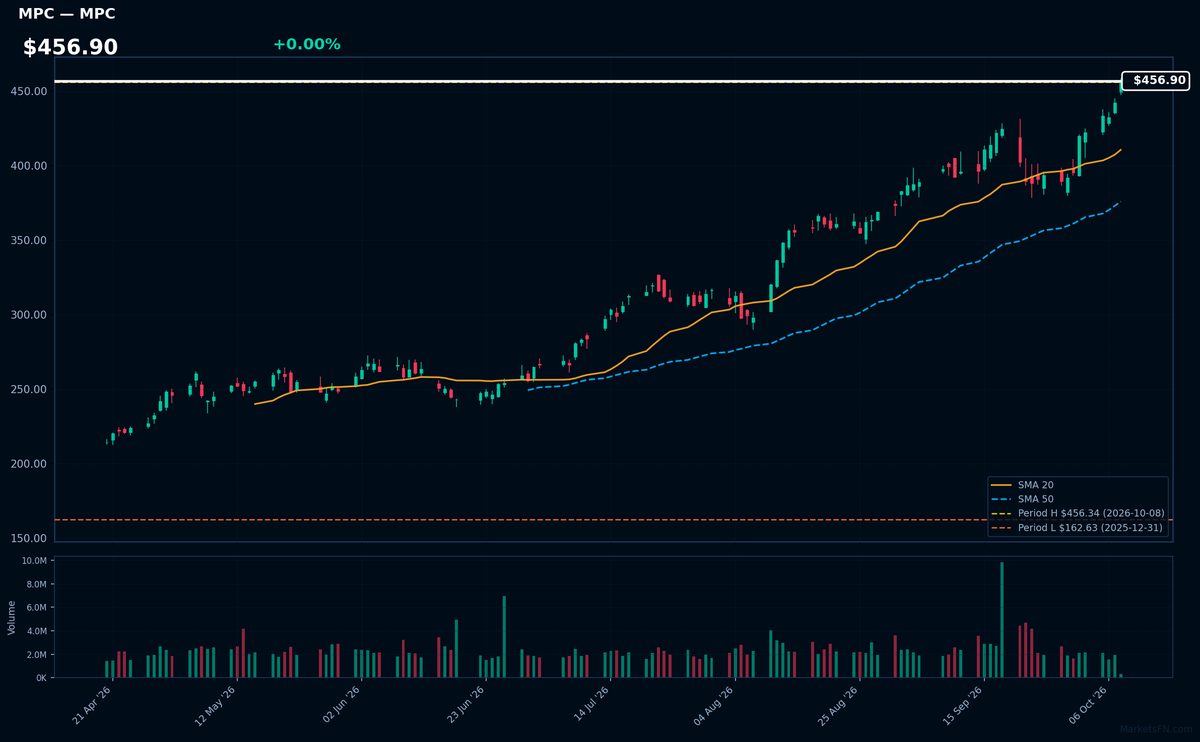
MPC | Marathon Petroleum Corp | Energy | Price Last: $456.34 | % Realized: +141.82% | RSI: 78.3 | % above MA200: +70.8% | Trend: Above MA20, MA50, MA200
Marathon Petroleum operates refineries, pipelines, and retail stations, processing crude into fuels and petrochemicals. Investors watch its refining margins and crack spreads - key profit drivers in volatile energy markets where supply disruptions create pricing power.
MPC shows extreme bullish momentum (RSI 78.3) with a sustained uptrend (price > MA20 > MA50 > MA200) and sits 0.0% below its 52-week high after gaining 141.8% annually. This reflects energy sector strength but RSI warns of overbought conditions.
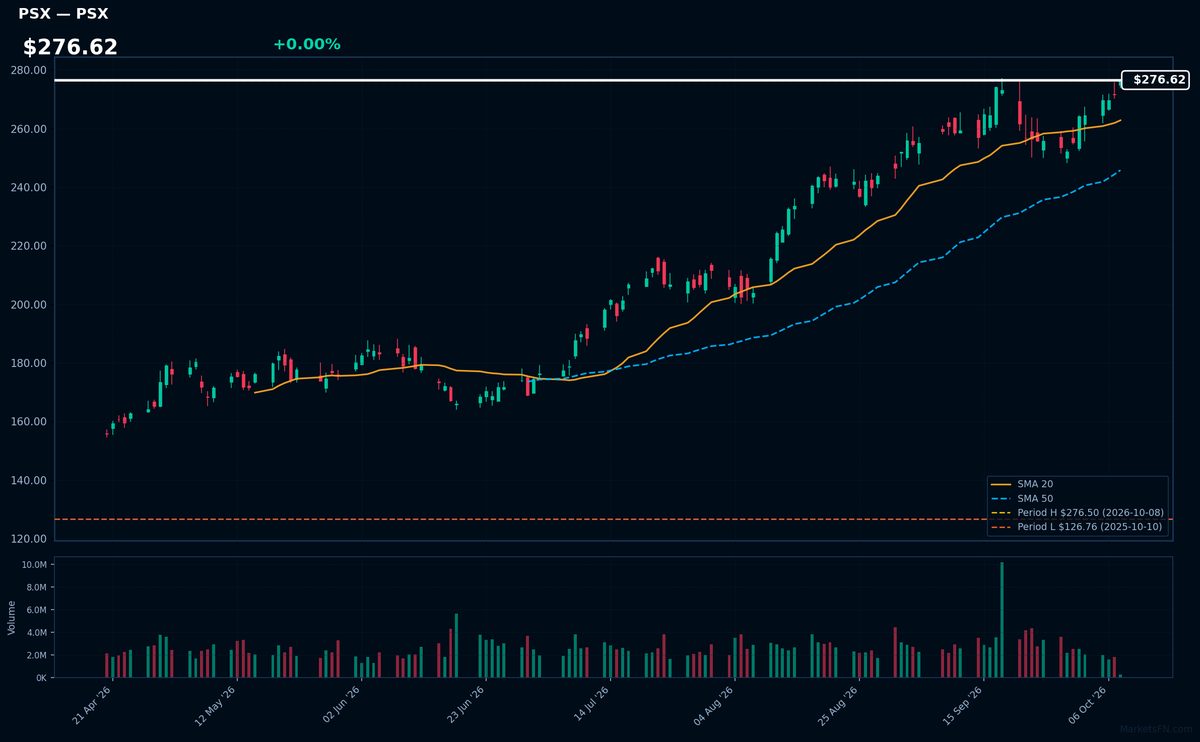
PSX | Phillips 66 | Energy | Price Last: $276.50 | % Realized: +110.59% | RSI: 71.9 | % above MA200: +48.0% | Trend: Above MA20, MA50, MA200
Phillips 66 operates refineries, chemical plants, and midstream assets, converting crude oil into fuels and plastics. Investors watch its refining margins and chemical segment for energy sector exposure, with diversified cash flows across the hydrocarbon value chain.
PSX shows extreme bullish momentum (RSI 71.9, price > MA20 > MA50 > MA200) after a 110.6% 52-week surge, now testing its 52-week high. This reflects sustained uptrend strength but warrants caution given overbought conditions.
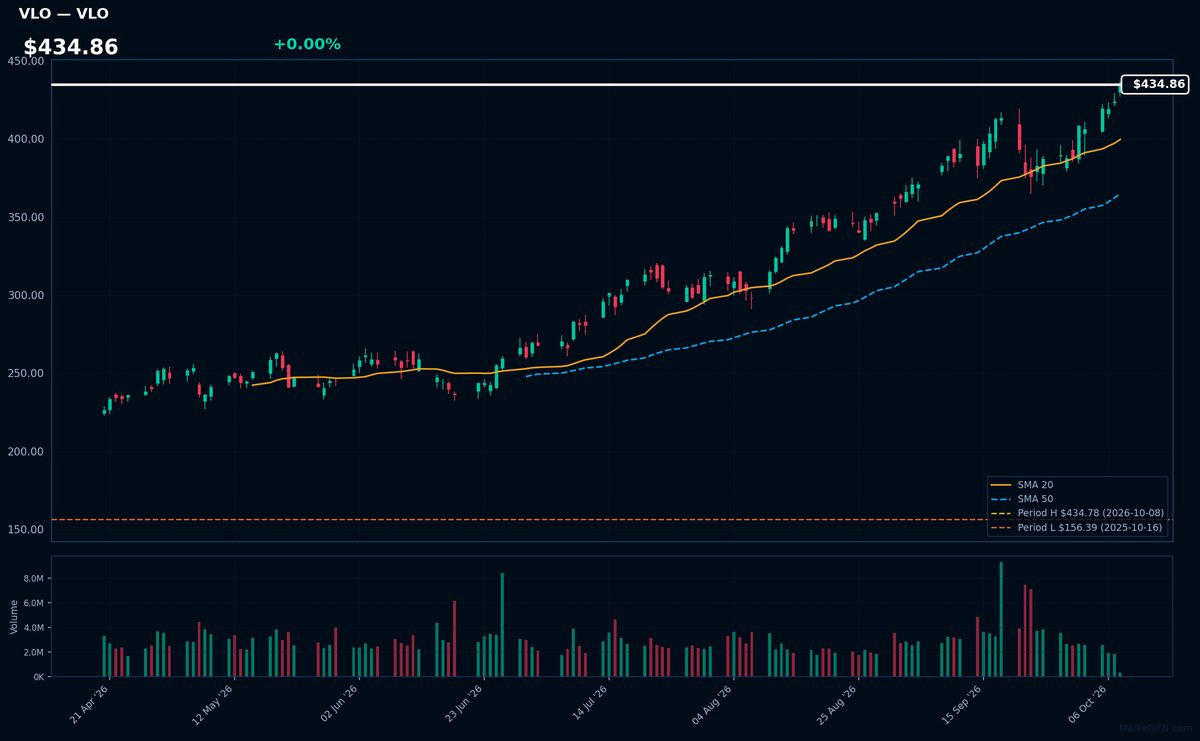
VLO | Valero Energy Corp | Energy | Price Last: $434.78 | % Realized: +167.66% | RSI: 74.9 | % above MA200: +63.7% | Trend: Above MA20, MA50, MA200
Valero Energy Corp operates refineries converting crude oil into gasoline, diesel, and jet fuel. Investors watch its refining margins and capacity utilization as key drivers, with recent outperformance tied to strong crack spreads and global fuel demand recovery post-pandemic.
VLO shows extreme bullish momentum at $434.86 (0.0% below 52W high), with RSI(14) at 74.9 (overbought) and sustained uptrend (price > MA20 > MA50 > MA200). The 167.7% 52W return suggests stretched valuations, warranting caution despite technical strength.
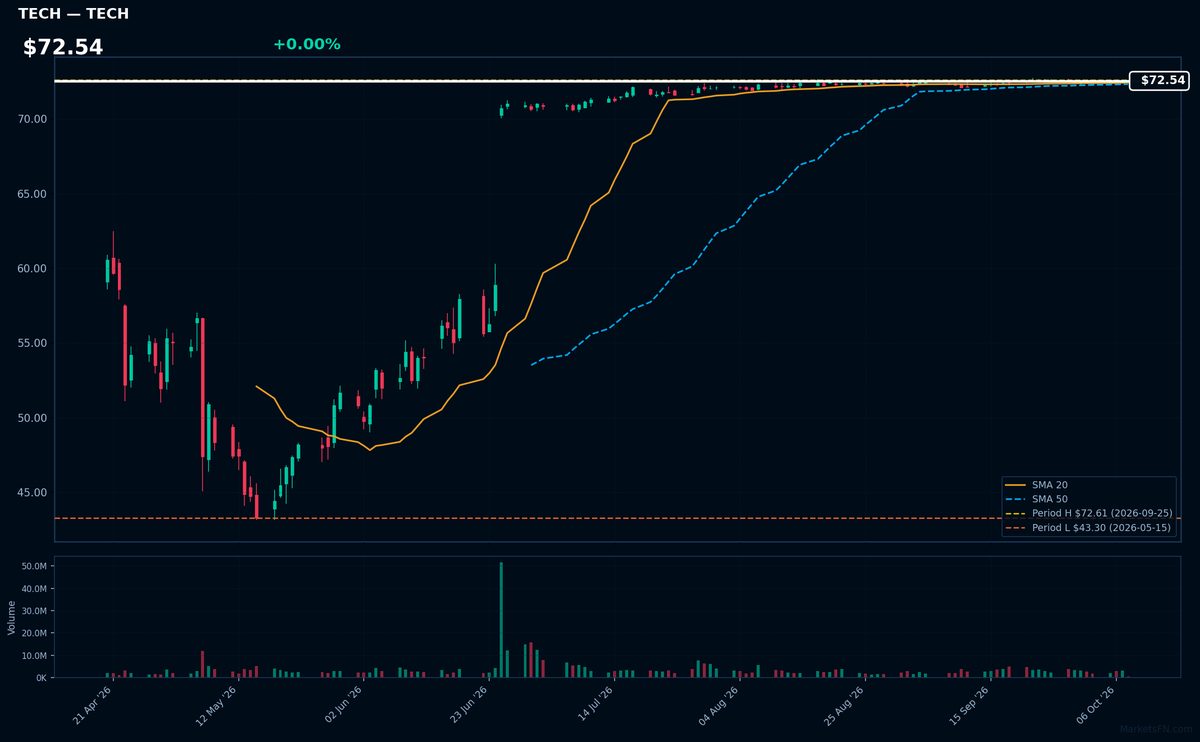
TECH | Bio-Techne Corp | Healthcare | Price Last: $72.54 | % Realized: +19.78% | RSI: 58.3 | % above MA200: +16.4% | Trend: Above MA20, MA50, MA200
Bio-Techne develops specialized proteins, antibodies, and diagnostic tools for life science research and clinical labs. Investors care because its niche reagents enable cutting-edge biotech research, creating steady demand with high margins in a growing $180B global life science tools market.
Technically bullish: RSI(14) at 58.3 shows controlled momentum, while the $72.54 price holds above all MAs (MA20>MA50>MA200). At 0.1% below 52-week highs after a 19.8% yearly gain, this suggests fundamental strength, not overextension.
📉 Nearest to 52-Week Low
Sectors represented: Consumer Cyclical (2), Communication Services (1), Basic Materials (1), Industrials (1)
| Ticker | Company | Sector | Price Last | % Realized | 52-Week Low Date | RSI | % above MA200 | Trend |
|---|---|---|---|---|---|---|---|---|
| CMCSA | Comcast Corp | Communication Services | $20.92 | -27.47% | 2026-10-08 | 22.8 | -21.3% | Below MA20, MA50, MA200 |
| LVS | Las Vegas Sands Corp | Consumer Cyclical | $35.72 | -32.95% | 2026-10-08 | 18.8 | -30.1% | Below MA20, MA50, MA200 |
| MLM | Martin Marietta Materials, Inc | Basic Materials | $475.79 | -25.23% | 2026-10-08 | 36.6 | -18.9% | Below MA20, MA50, MA200 |
| LULU | Lululemon Athletica inc | Consumer Cyclical | $91.41 | -47.71% | 2026-10-08 | 31.0 | -35.9% | Below MA20, MA50, MA200 |
| LII | Lennox International Inc | Industrials | $354.19 | -36.13% | 2026-10-08 | 36.6 | -26.8% | Below MA20, MA50, MA200 |
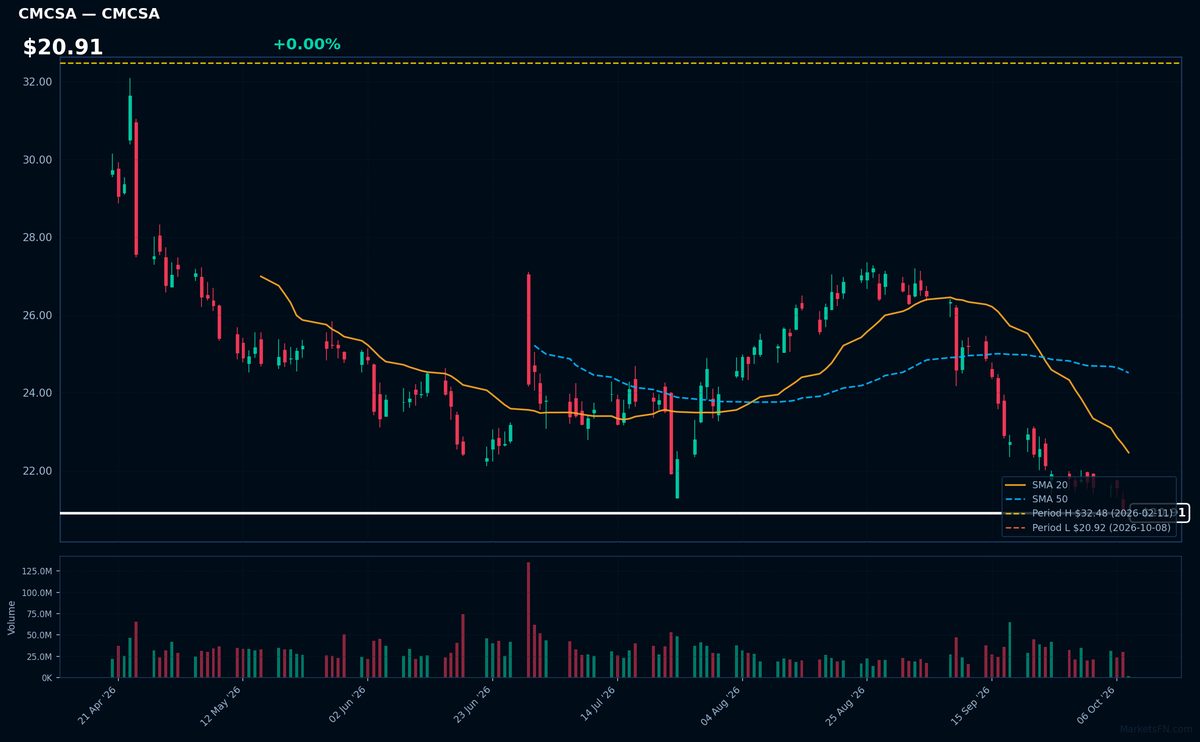
CMCSA | Comcast Corp | Communication Services | Price Last: $20.92 | % Realized: -27.47% | RSI: 22.8 | % above MA200: -21.3% | Trend: Below MA20, MA50, MA200
Comcast Corp operates as a global media and technology company, providing broadband, video, and wireless services to residential and business customers. Investors should monitor its performance as a bellwether for cable/telecom sector health and its streaming strategy amid cord-cutting trends.
CMCSA shows extreme technical weakness: RSI(14) at 22.8 (oversold), with bearish MA alignment (price < MA20 < MA50 < MA200). The stock tests 52-week lows (-27.5% YoY), signaling severe downtrend momentum. This is a warning sign, not fundamental strength.
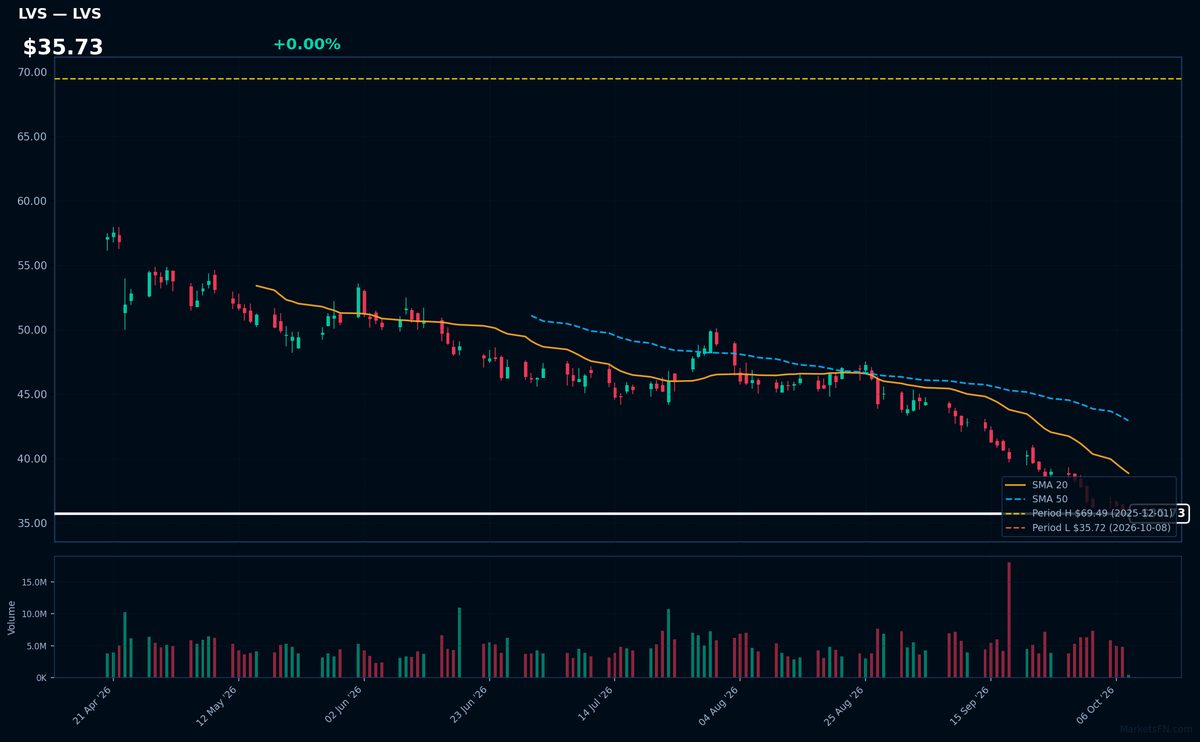
LVS | Las Vegas Sands Corp | Consumer Cyclical | Price Last: $35.72 | % Realized: -32.95% | RSI: 18.8 | % above MA200: -30.1% | Trend: Below MA20, MA50, MA200
Las Vegas Sands Corp operates luxury integrated resorts in Macao and Singapore, including The Venetian and Marina Bay Sands. Investors watch LVS for Asia's high-margin casino tourism recovery, though China's economic slowdown pressures VIP gaming revenue.
At $35.73, LVS shows extreme technical stress: RSI(14) at 18.8 (oversold) with bearish MA alignment (price < MA20 < MA50 < MA200). The stock tests 52-week lows after a -32.9% annual plunge — a clear warning sign.
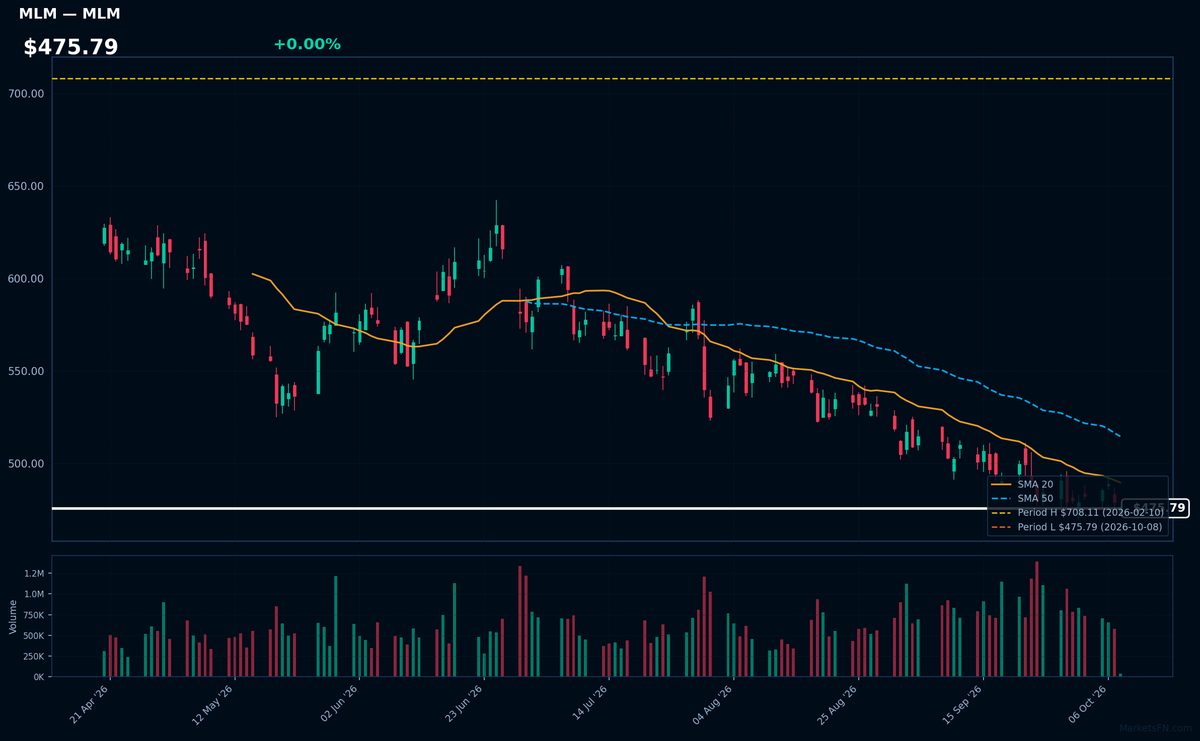
MLM | Martin Marietta Materials, Inc | Basic Materials | Price Last: $475.79 | % Realized: -25.23% | RSI: 36.6 | % above MA200: -18.9% | Trend: Below MA20, MA50, MA200
Martin Marietta Materials supplies construction aggregates (crushed stone, sand, gravel) and heavy building materials, critical for infrastructure and commercial projects. Investors monitor it as a cyclical proxy for construction activity and public works spending, with pricing power during supply-constrained periods.
MLM shows severe technical weakness: RSI(14) at 36.6 (approaching oversold), bearish MA alignment (price < MA20 < MA50 < MA200), and -25.2% 52-week return. Testing 52-week lows suggests persistent selling pressure, not fundamental strength.
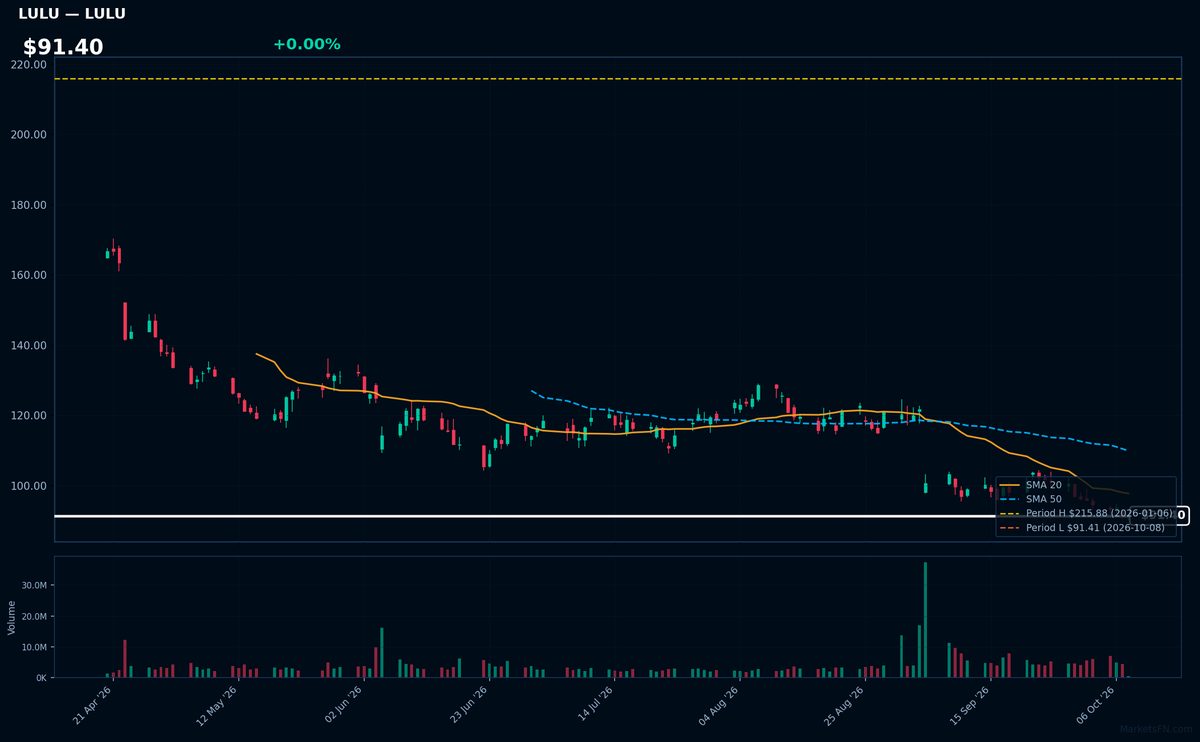
LULU | Lululemon Athletica inc | Consumer Cyclical | Price Last: $91.41 | % Realized: -47.71% | RSI: 31.0 | % above MA200: -35.9% | Trend: Below MA20, MA50, MA200
Lululemon designs premium athletic apparel, dominating the high-end yoga/athleisure market with technical fabrics and brand loyalty. Investors care about its direct-to-consumer growth and expansion into men's wear, though competition is intensifying.
Technically dire: RSI(14) at 31.0 shows oversold conditions amid bearish MA alignment (price < MA20 < MA50 < MA200). Trading at 52-week lows (-47.7% YoY) signals severe breakdown risk.
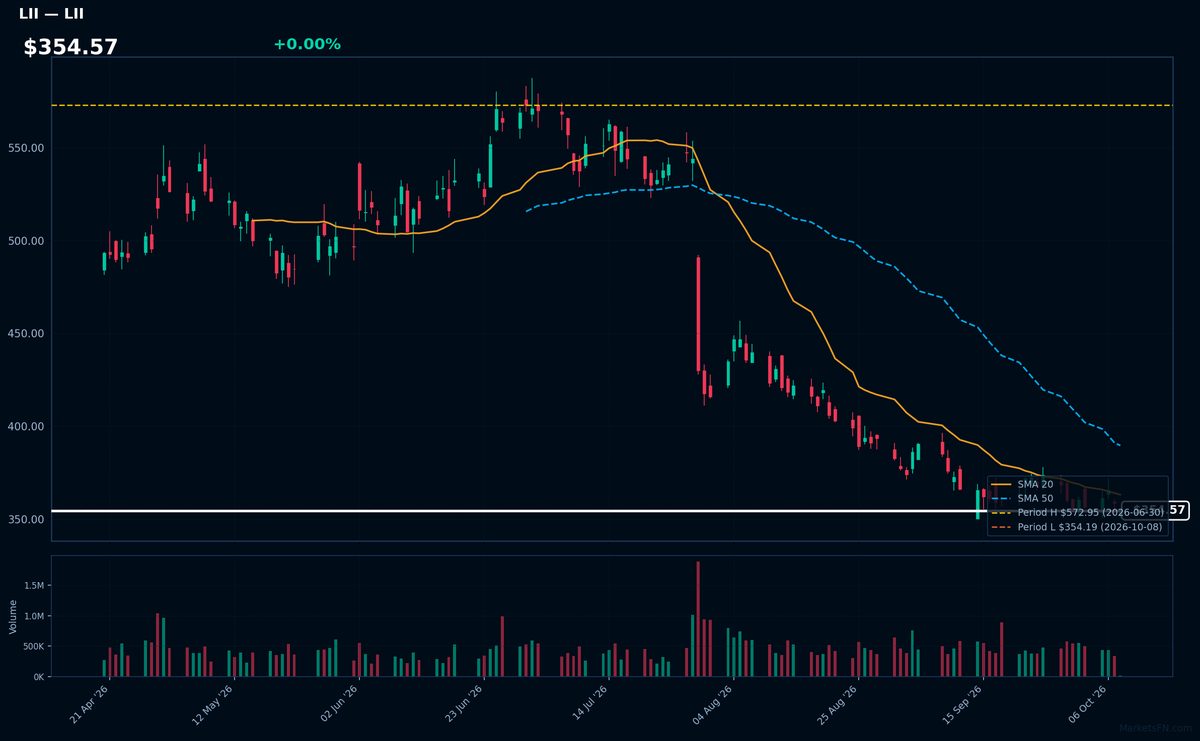
LII | Lennox International Inc | Industrials | Price Last: $354.19 | % Realized: -36.13% | RSI: 36.6 | % above MA200: -26.8% | Trend: Below MA20, MA50, MA200
Lennox International Inc (LII) manufactures HVAC systems and components for residential and commercial markets. Investors monitor LII as a cyclical play on construction activity and energy efficiency trends, with pricing power in replacement markets.
Technically concerning: RSI(14) at 36.6 shows near-oversold conditions, but bearish MA alignment (price < MA20 < MA50 < MA200) confirms sustained downtrend. Stock tests 52-week lows after -36.1% annual decline.
Market Commentary
The concentration of S&P 500 stocks at 52-week extremes reflects divergent sector performance amid shifting macroeconomic conditions. Energy refiners (MPC, PSX, VLO) and tech infrastructure play ANET trade at highs, signaling persistent demand for energy efficiency and AI-driven networking, while consumer discretionary (LULU, LVS) and materials (MLM, LII) languish near lows, suggesting softening demand in cyclical sectors. This bifurcation underscores market selectivity favoring structurally advantaged industries.
Sector rotation trends reveal macro themes: Energy remains resilient on tight refining margins and geopolitical risk premiums, while tech beneficiaries of cloud/AI adoption (ANET, TECH) defy broader sector weakness. Conversely, discretionary and travel-exposed names (LULU, LVS) face pressure from consumer spending fatigue and China exposure risks. Materials (MLM, LII) reflect housing slowdown concerns, with Comcast (CMCSA) weighed by cord-cutting and broadband competition.
Key levels to monitor include ANET's unchallenged uptrend (0.0% below high) and LULU's precarious support (0.0% above low). Catalysts include Q2 earnings for refiners (margin sustainability), China stimulus for LVS, and consumer confidence data for LULU. Breakouts or breakdowns from these extremes may confirm continuation or reversal trends.
Methodology: All 503 S&P 500 constituents screened. 52-week high = highest daily close over the past 252 trading days (approx. 1 year). 52-week low = lowest daily close over the same period. Distance = (current price / extreme − 1) × 100. Technical indicators computed on up to 1 year of daily OHLCV data.
Disclaimer: For informational purposes only. Not investment advice. Past performance is not indicative of future results.