S&P 500 52-Week Highs & Lows Radar: Apple (AAPL), Oracle (ORCL) and more
MarketsFN Team

S&P 500 52-Week Highs & Lows Radar: Apple (AAPL), Oracle (ORCL) and more
Screening all 503 S&P 500 constituents for stocks nearest to their 52-week high and their 52-week low. Data as of July 16, 2026. % Realized = 52-week total return.
Legend: RSI > 70 = overbought · RSI < 30 = oversold · Green % Realized = positive 52W return · Red = negative.
📈 Nearest to 52-Week High
Sectors represented: Technology (1), Consumer Defensive (1), Healthcare (1), Industrials (1), Consumer Cyclical (1)
| Ticker | Company | Sector | Price Last | % Realized | 52-Week High Date | RSI | % above MA200 | Trend |
|---|---|---|---|---|---|---|---|---|
| AAPL | Apple Inc | Technology | $330.09 | +57.07% | 2026-07-16 | 70.1 | +20.6% | Above MA20, MA50, MA200 |
| KO | Coca-Cola Co | Consumer Defensive | $84.68 | +22.25% | 2026-07-16 | 59.7 | +12.8% | Above MA20, MA50, MA200 |
| UNH | Unitedhealth Group Inc | Healthcare | $451.84 | +54.48% | 2026-07-16 | 67.7 | +32.4% | Above MA20, MA50, MA200 |
| UNP | Union Pacific Corp | Industrials | $297.35 | +28.62% | 2026-07-16 | 75.0 | +20.3% | Above MA20, MA50, MA200 |
| SBUX | Starbucks Corp | Consumer Cyclical | $108.14 | +16.90% | 2026-07-16 | 62.7 | +15.4% | Above MA20, MA50, MA200 |
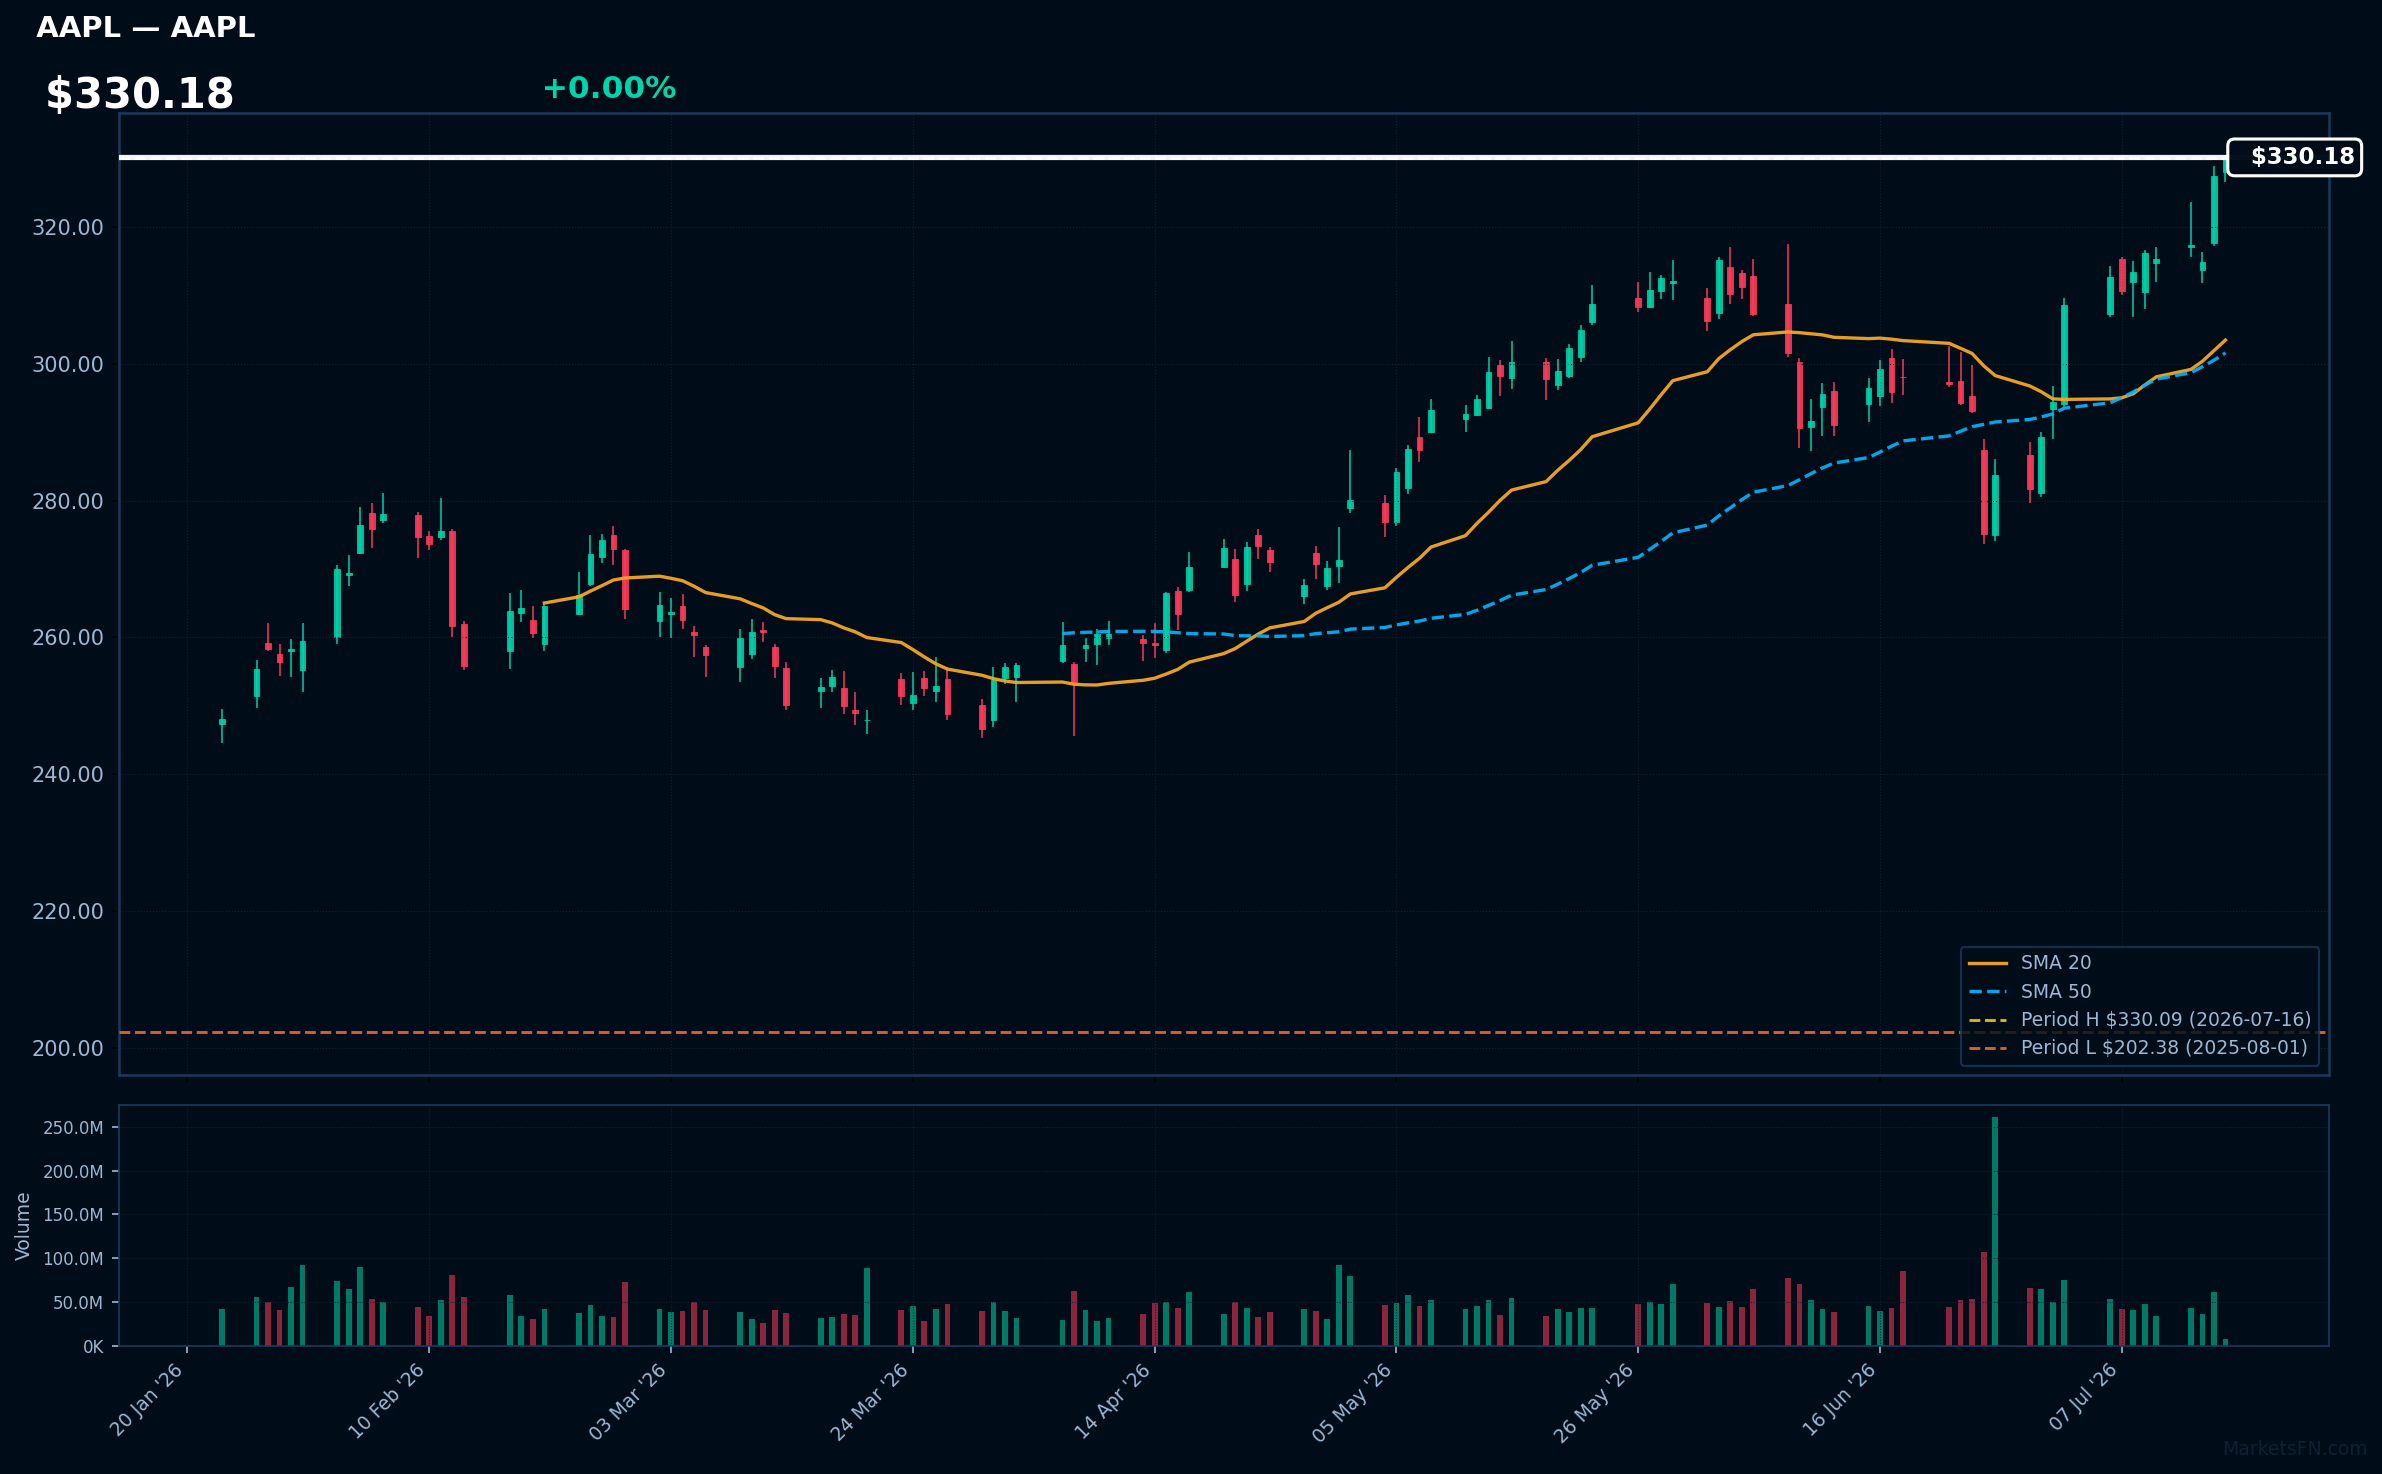
AAPL | Apple Inc | Technology | Price Last: $330.09 | % Realized: +57.07% | RSI: 70.1 | % above MA200: +20.6% | Trend: Above MA20, MA50, MA200
Apple Inc designs, manufactures, and markets consumer electronics, software, and services, generating revenue primarily from iPhone sales and services like Apple Music and iCloud. Investors care due to its significant market share and ecosystem-driven customer loyalty.
AAPL's RSI(14) is 70.1, indicating potential overbought conditions. The bullish MA alignment (price > MA20 > MA50 > MA200) and 0.0% proximity to its 52-Week high suggest sustained uptrend and potential breakout, supported by a 57.1% 52-Week return.
Related headlines
- Apple Intelligence approved for launch in China with Alibaba and Baidu
- AAPL's China Memory Chip Plans Draw National Security Scrutiny Lawmakers Say Every Memory Chip Purchase Will Subsidize PLA
- AI Weekly: SK Hynix shares jump up and down, Apple sues OpenAI
- These Chinese Tech Stocks Are on the Rise. Thank Apple and Its AI.
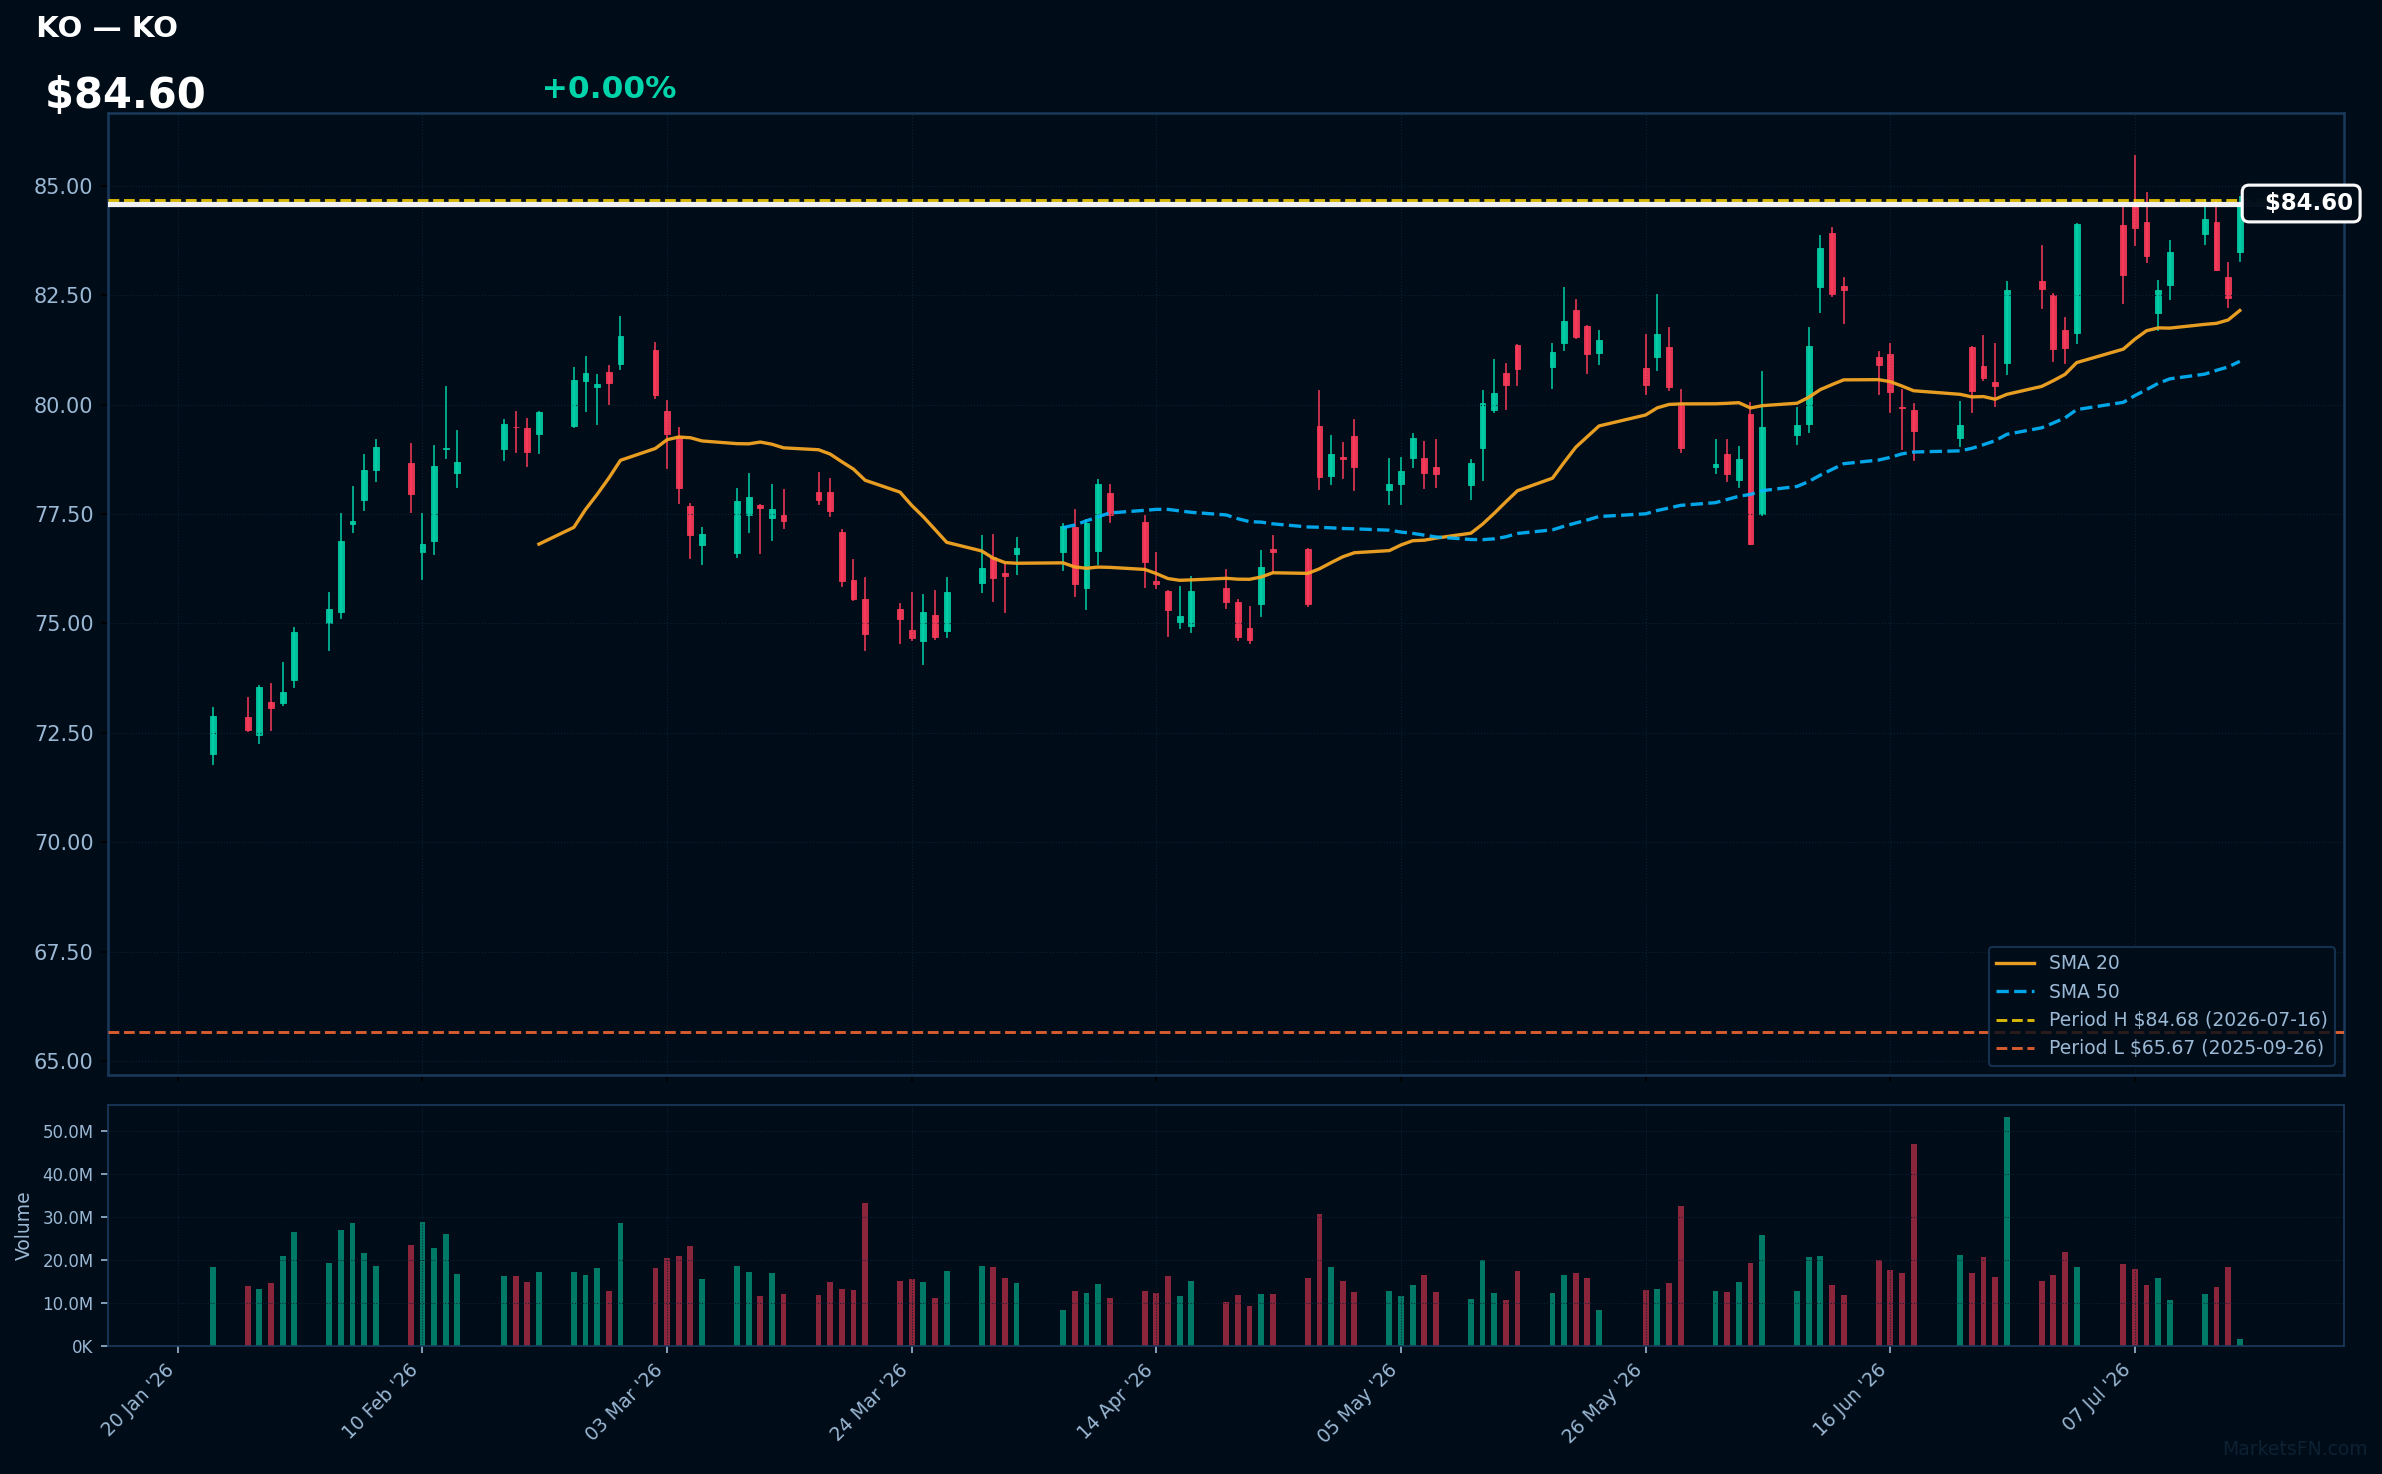
KO | Coca-Cola Co | Consumer Defensive | Price Last: $84.68 | % Realized: +22.25% | RSI: 59.7 | % above MA200: +12.8% | Trend: Above MA20, MA50, MA200
Coca-Cola Co is a beverage company that manufactures and distributes beverages, generating revenue primarily through the sale of its products. Investors should care about its ability to maintain market share and drive volume growth amidst changing consumer preferences.
Coca-Cola Co's current technical situation indicates momentum, with an RSI(14) of 59.7 and a bullish MA alignment (price > MA20 > MA50 > MA200), suggesting a sustained uptrend. The stock is near its 52-Week high, 0.0% below, indicating a potential breakout level.
Related headlines
- Board of Directors of The Coca-Cola Company Elects New Officer and Declares Regular Quarterly Dividend
- South Africa watchdog backs Coca-Cola HBC bottling buy
- Coca-Cola expected to post solid second-quarter results as analysts highlight resilient demand
- Coca-Cola Targets $10 Billion Valuation for India Unit
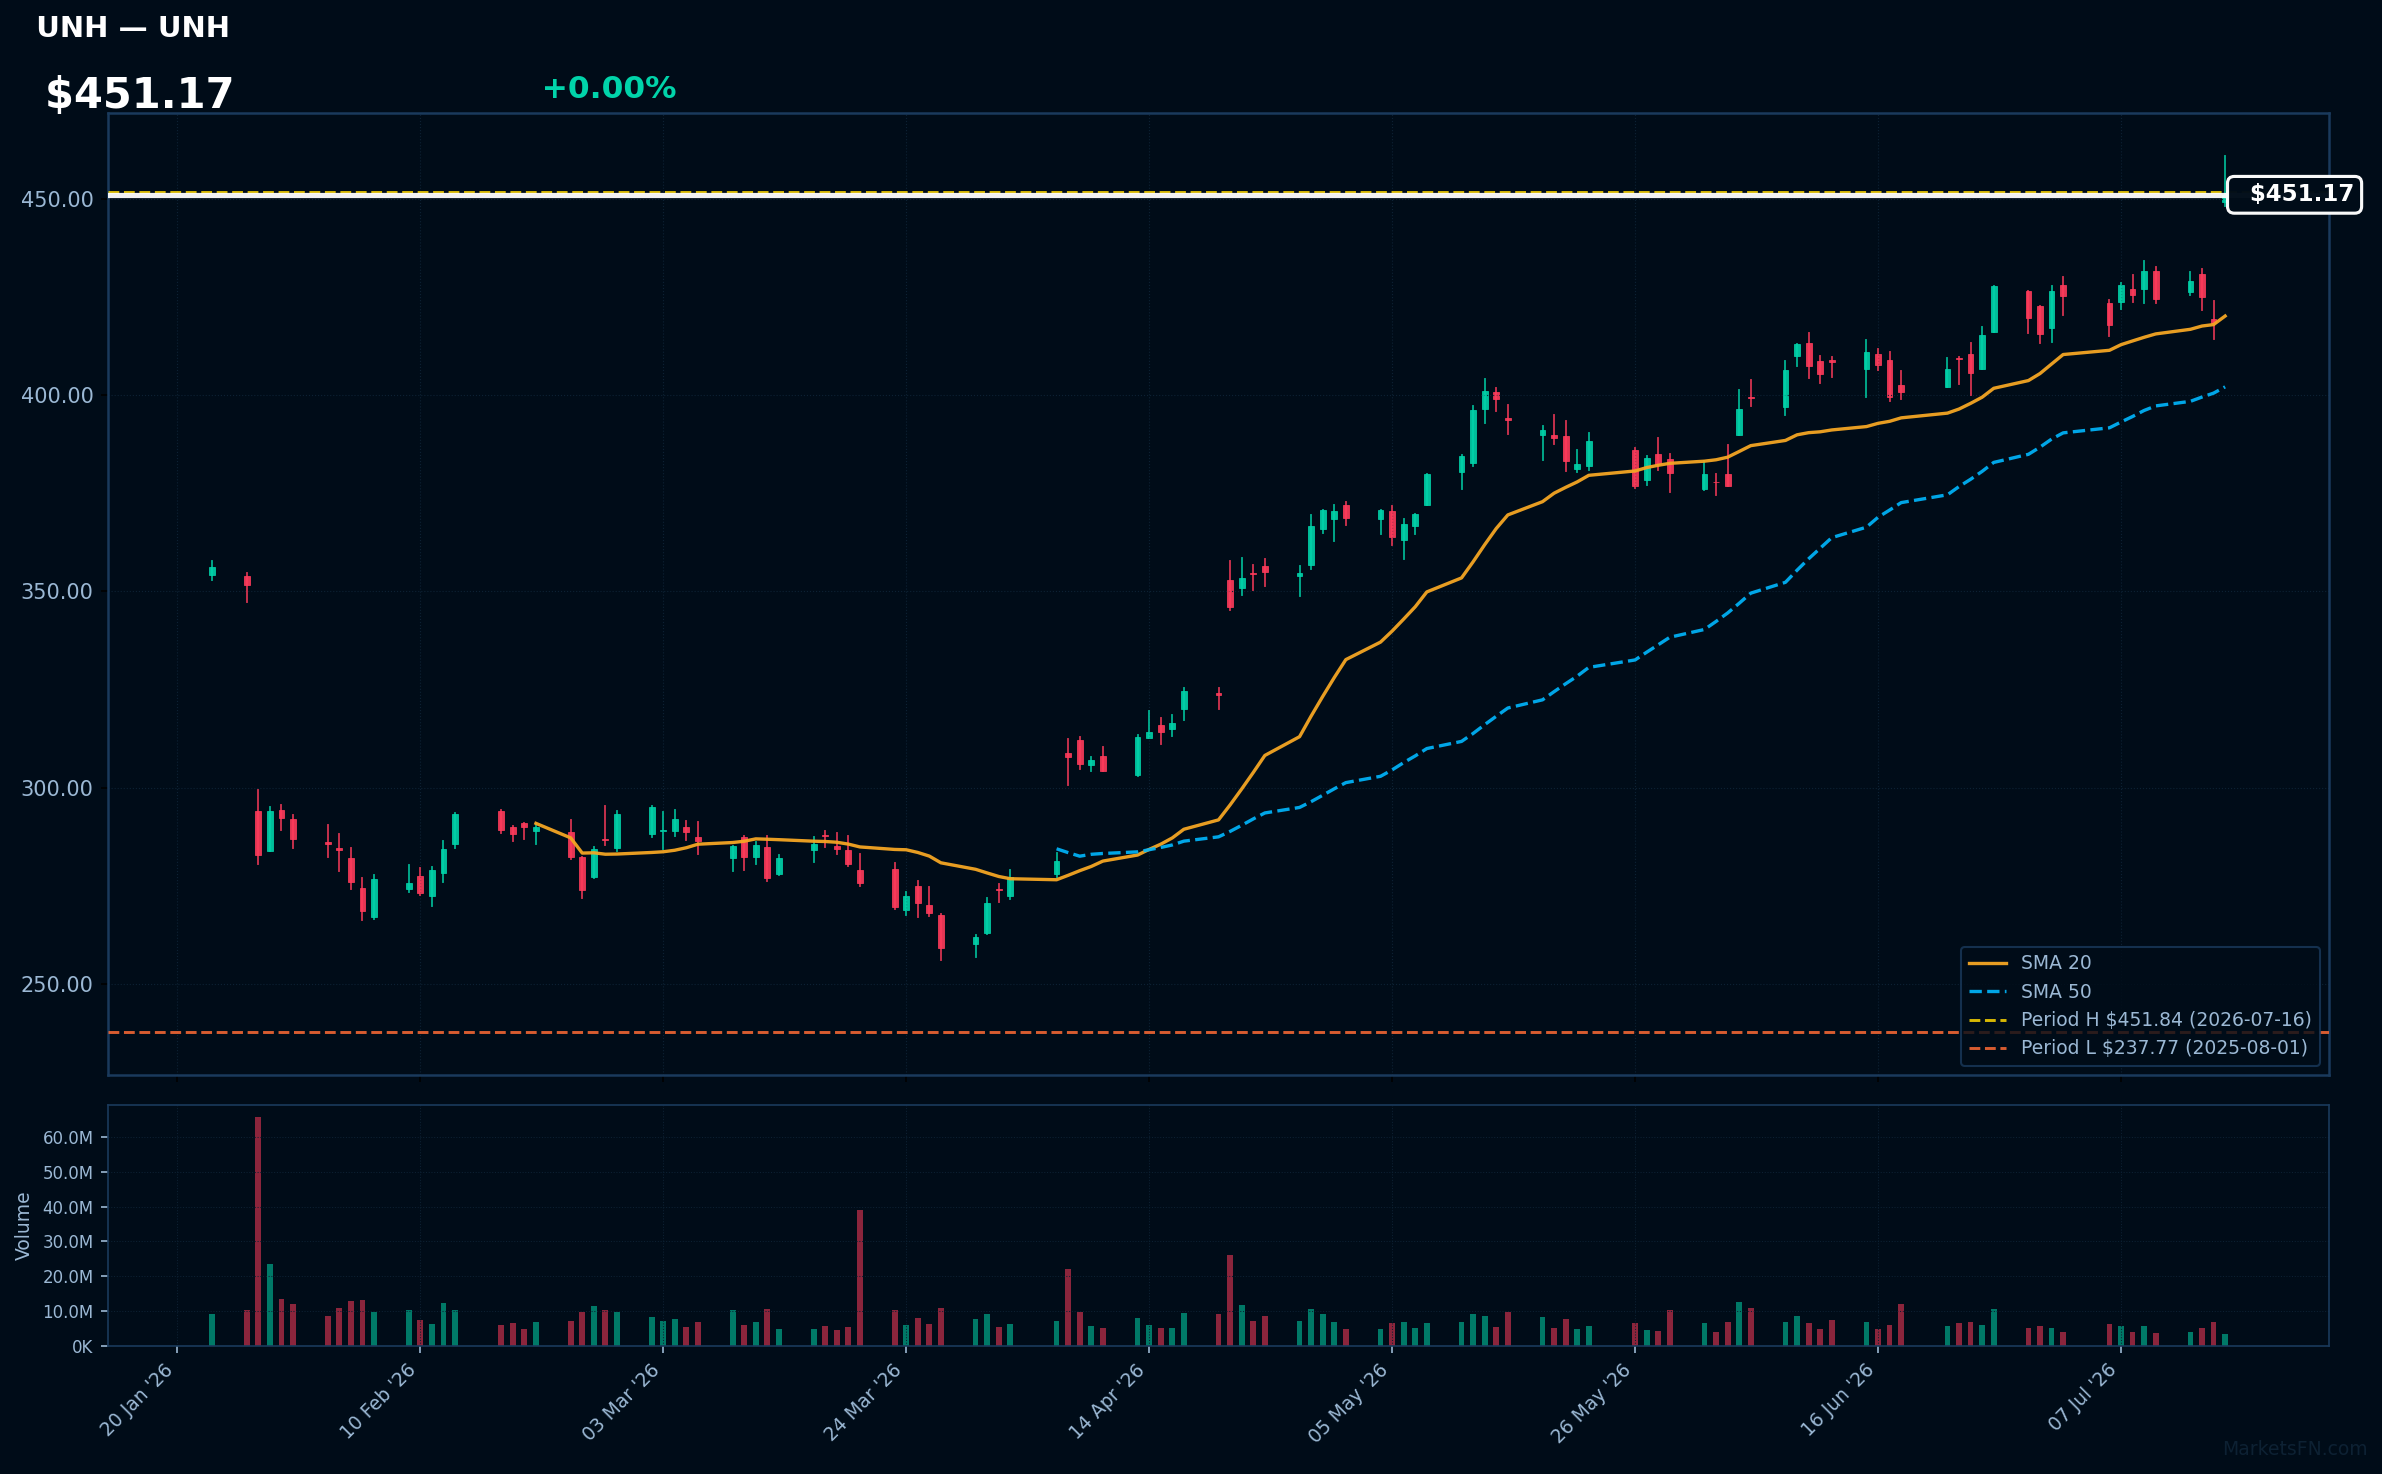
UNH | Unitedhealth Group Inc | Healthcare | Price Last: $451.84 | % Realized: +54.48% | RSI: 67.7 | % above MA200: +32.4% | Trend: Above MA20, MA50, MA200
Unitedhealth Group Inc operates health insurance plans and healthcare services through its UnitedHealthcare and Optum segments, providing diversified healthcare coverage and services. Investors should care due to its diversified revenue streams and large market presence.
The stock exhibits bullish technicals with RSI(14) at 67.7, a sustained uptrend as price > MA20 > MA50 > MA200, and is 0.0% below its 52-Week high, indicating strong momentum with potential for breakout.
Related headlines
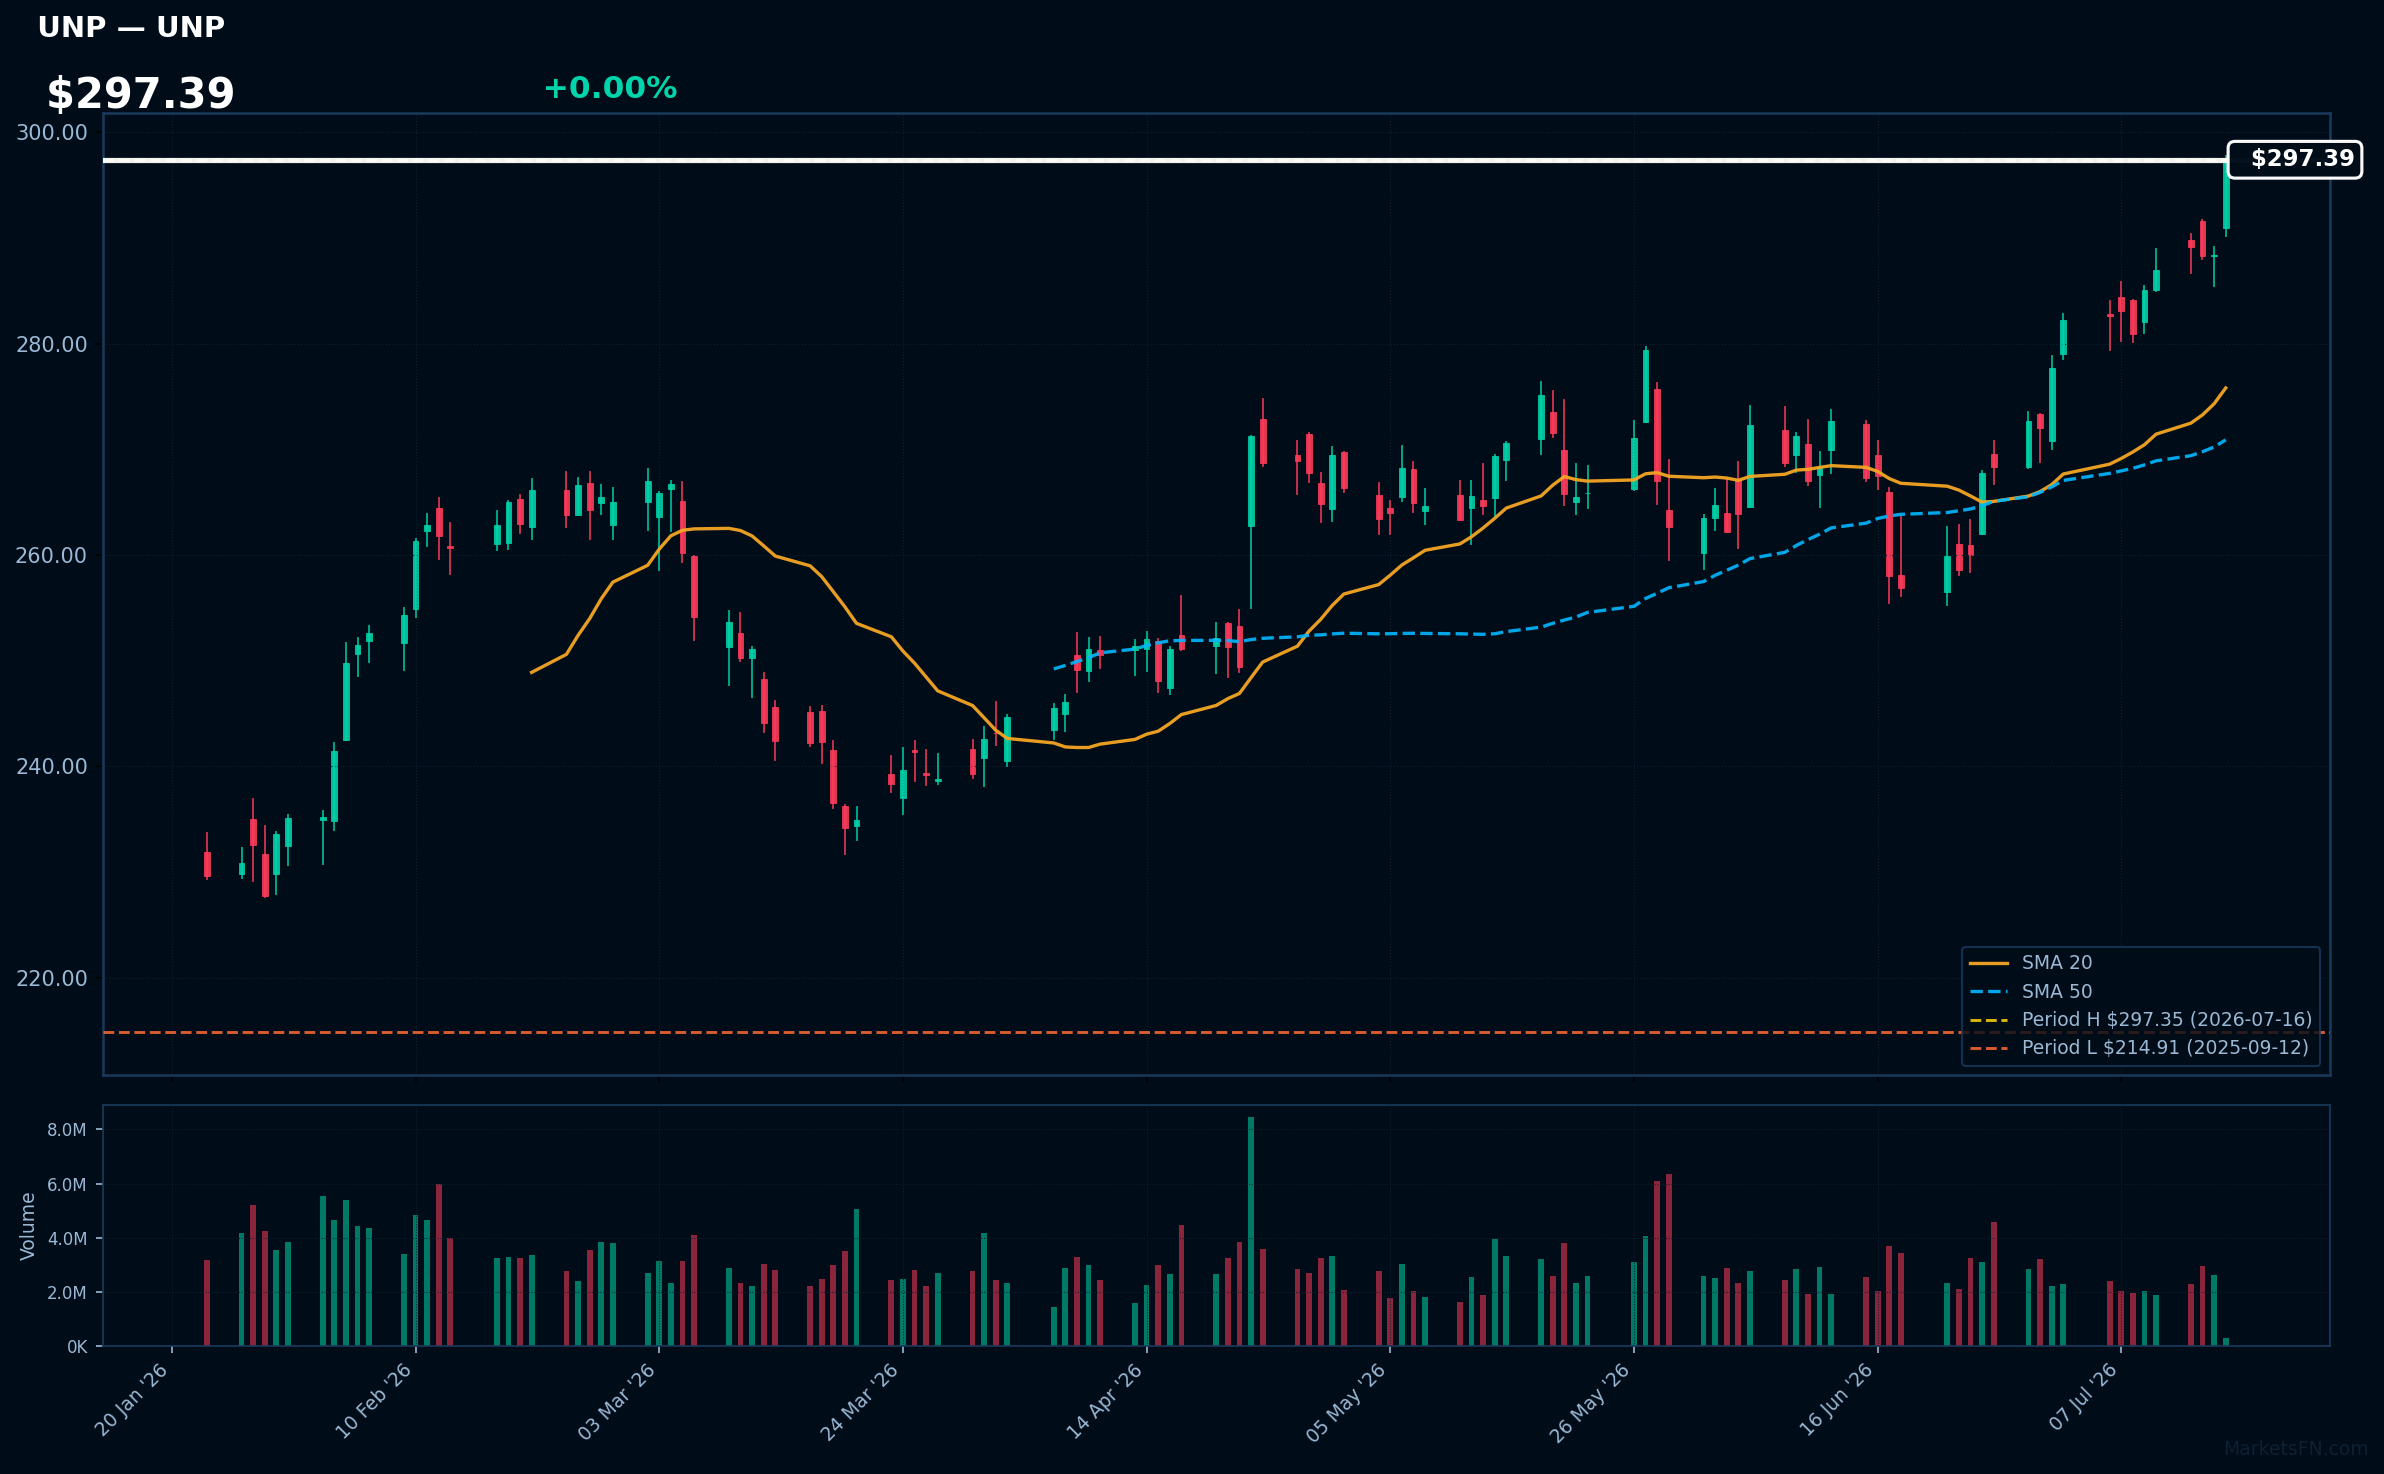
UNP | Union Pacific Corp | Industrials | Price Last: $297.35 | % Realized: +28.62% | RSI: 75.0 | % above MA200: +20.3% | Trend: Above MA20, MA50, MA200
Union Pacific Corp operates North America's largest railroad network, efficiently transporting goods like coal, chemicals, and intermodal containers. Investors care about its operational efficiency and demand for rail services, which impact revenue and profitability.
UNP's RSI is 75.0, indicating strong momentum with price > MA20 > MA50 > MA200, a sustained uptrend. At 0.0% below its 52-Week high, it nears a potential breakout, suggesting continued upward pressure.
Related headlines
- Union Pacific Corporation Announces Second Quarter 2026 Earnings Release Date
- EXCLUSIVE: Union Pacific, Norfolk Southern CEOs talk about the rail merger that could reshape the U.S. economy
- Union Pacific, Norfolk Southern submit more merger data
- Union Pacific and Norfolk Southern Respond to STB's Request for Supplemental Information, Submitting First Round of Their Responses
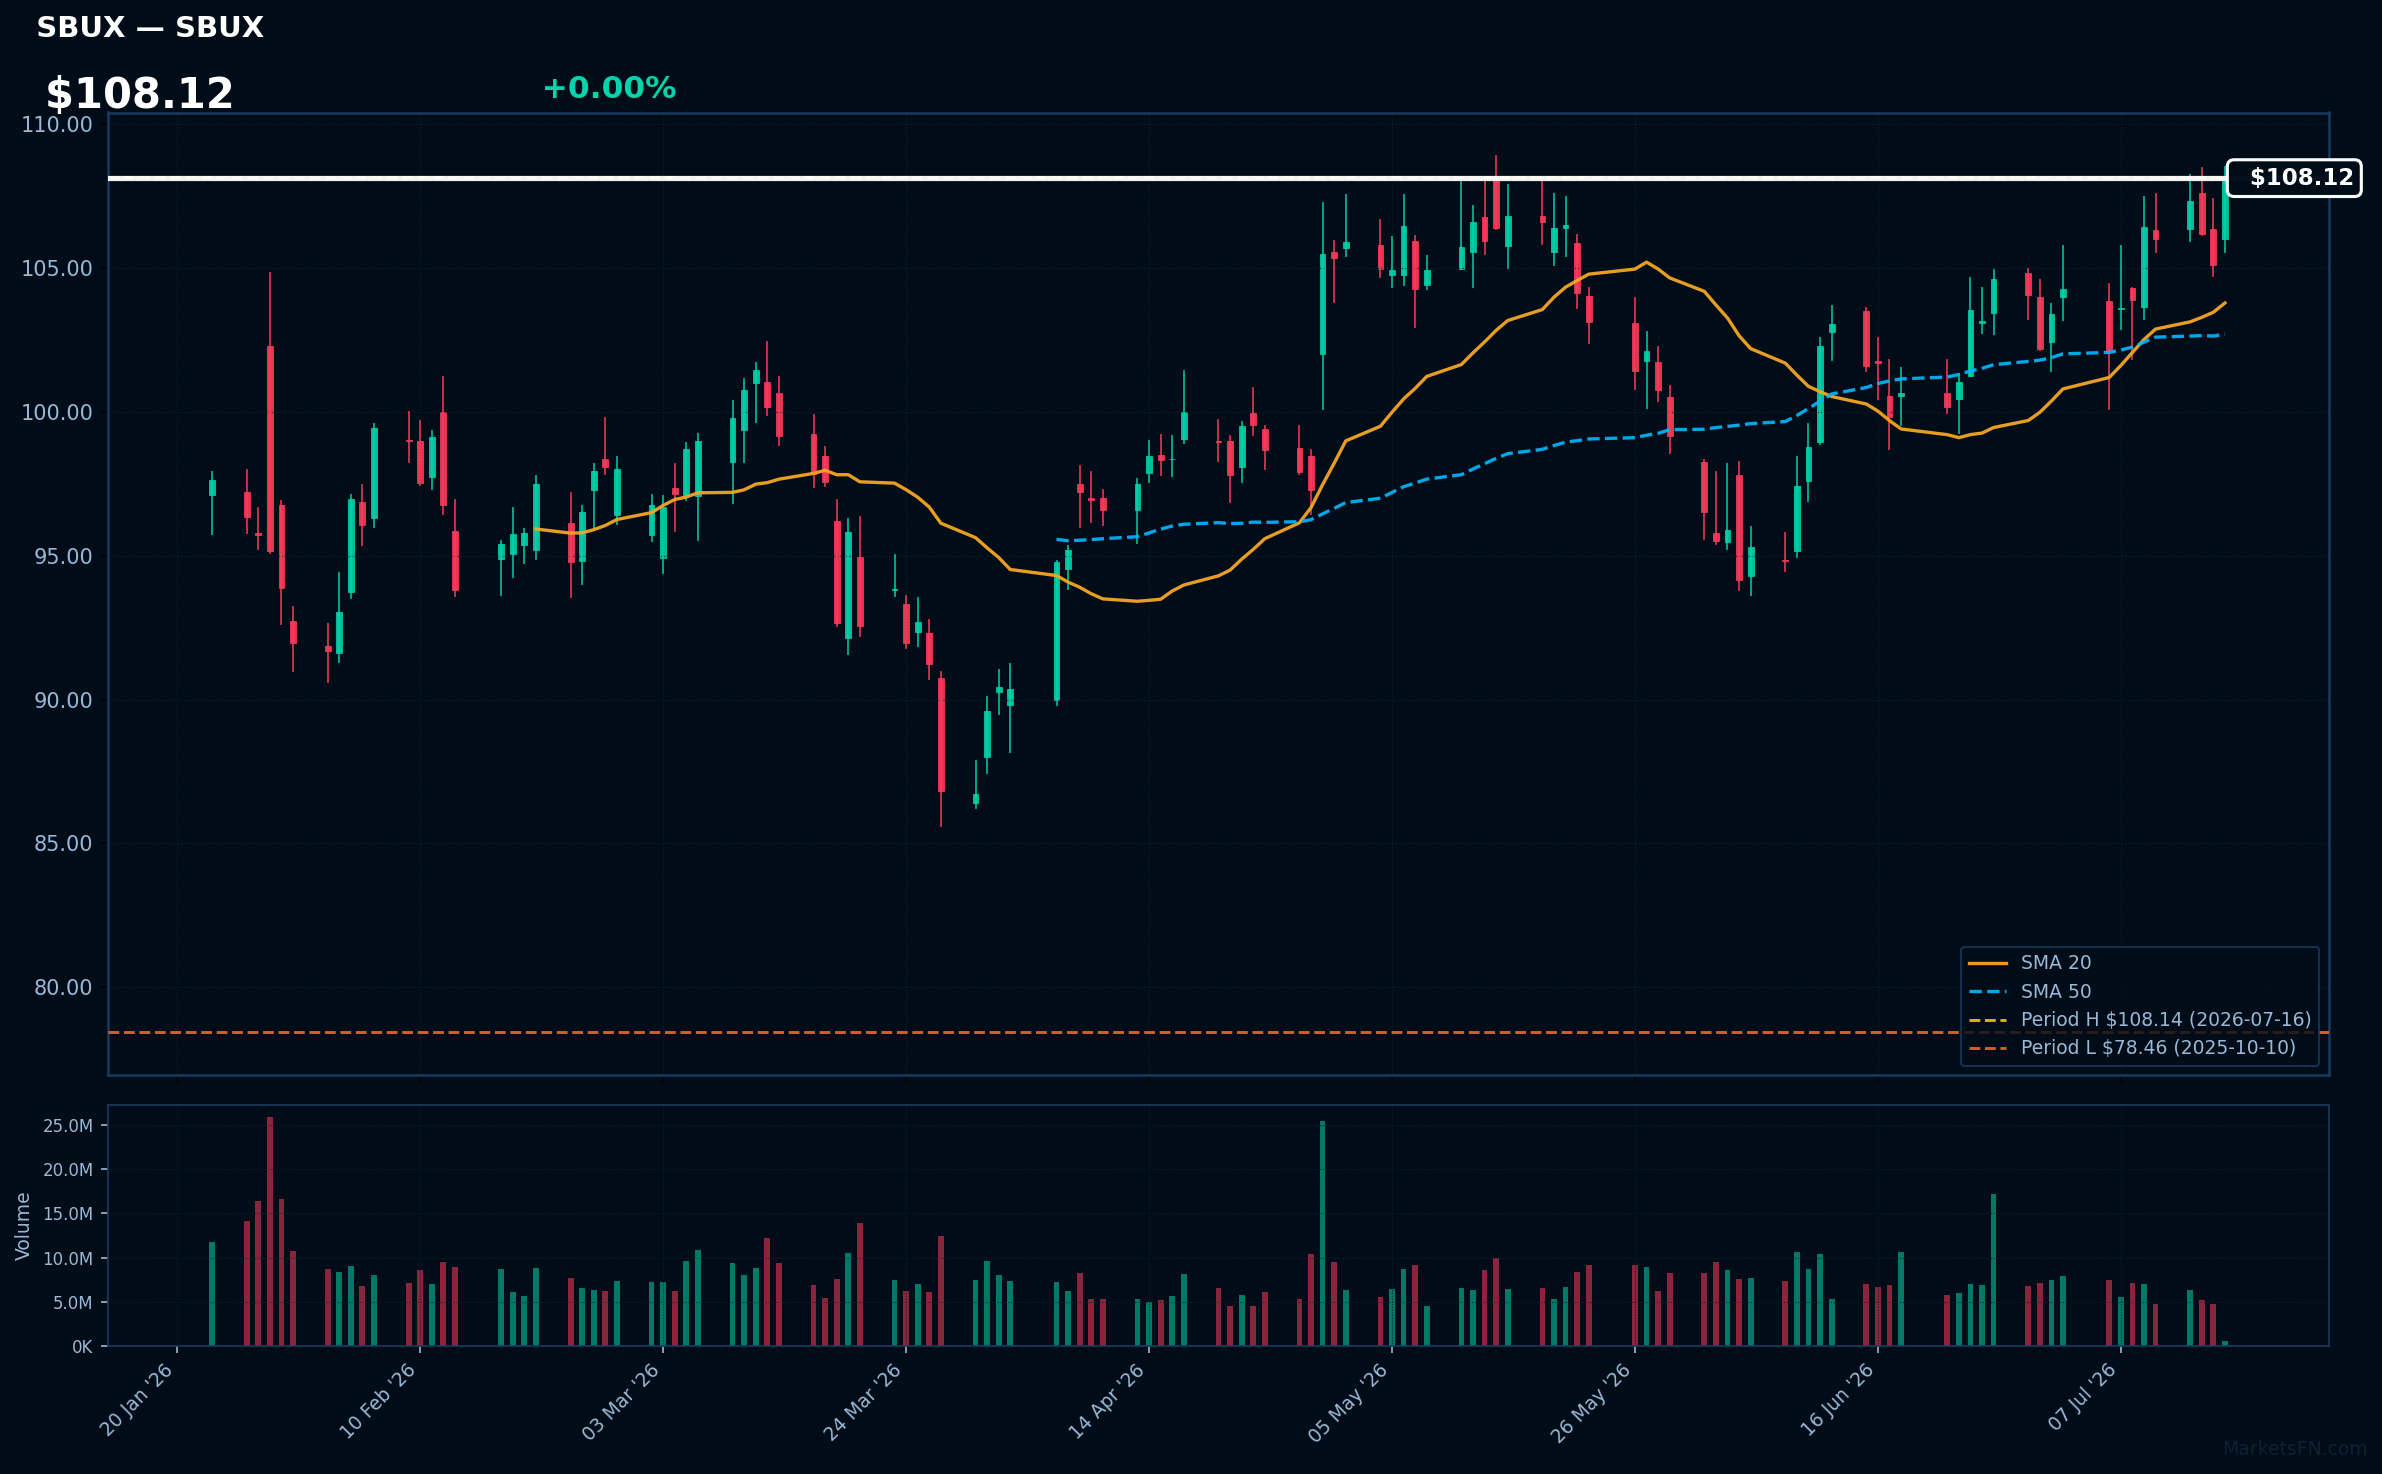
SBUX | Starbucks Corp | Consumer Cyclical | Price Last: $108.14 | % Realized: +16.90% | RSI: 62.7 | % above MA200: +15.4% | Trend: Above MA20, MA50, MA200
Starbucks Corp operates a global chain of coffeehouses, offering a wide range of coffee, tea, and food products. Investors should care about its brand loyalty, global expansion, and same-store sales growth, which drive revenue and profitability.
The stock is in a sustained uptrend with price > MA20 > MA50 > MA200, RSI(14) at 62.7, and is 0.0% below its 52-Week high, indicating strong momentum with no immediate signs of reversal.
Related headlines
- Starbucks Announces Q3 Fiscal Year 2026 Results Conference Call
- Starbucks rolls out quarterly bonuses for high-performing workers
- S&P 500, Nasdaq, Dow End Higher Led By Chipmaker Stocks As Investors Look Past US-Iran Hostility ORCL, SBUX, WULF, PANW, FATE In Focus
- SBUX Stock Set For Best Day In Two Months Starbucks Steps Up AI Push To Cut Reliance On MSFT, IBM
📉 Nearest to 52-Week Low
Sectors represented: Technology (2), Industrials (1), Consumer Cyclical (1), Energy (1)
| Ticker | Company | Sector | Price Last | % Realized | 52-Week Low Date | RSI | % above MA200 | Trend |
|---|---|---|---|---|---|---|---|---|
| ORCL | Oracle Corp | Technology | $127.22 | -47.28% | 2026-07-16 | 28.1 | -33.9% | Below MA20, MA50, MA200 |
| IBM | International Business Machines Corp | Technology | $204.74 | -27.38% | 2026-07-16 | 27.9 | -25.3% | Below MA20, MA50, MA200 |
| PNR | Pentair plc | Industrials | $62.85 | -40.07% | 2026-07-16 | 25.2 | -32.9% | Below MA20, MA50, MA200 |
| LVS | Las Vegas Sands Corp | Consumer Cyclical | $45.37 | -7.63% | 2026-07-14 | 35.8 | -19.2% | Below MA20, MA50, MA200 |
| EXE | Expand Energy Corp | Energy | $88.32 | -18.45% | 2026-06-18 | 45.1 | -14.6% | Below MA20, MA50, MA200 |
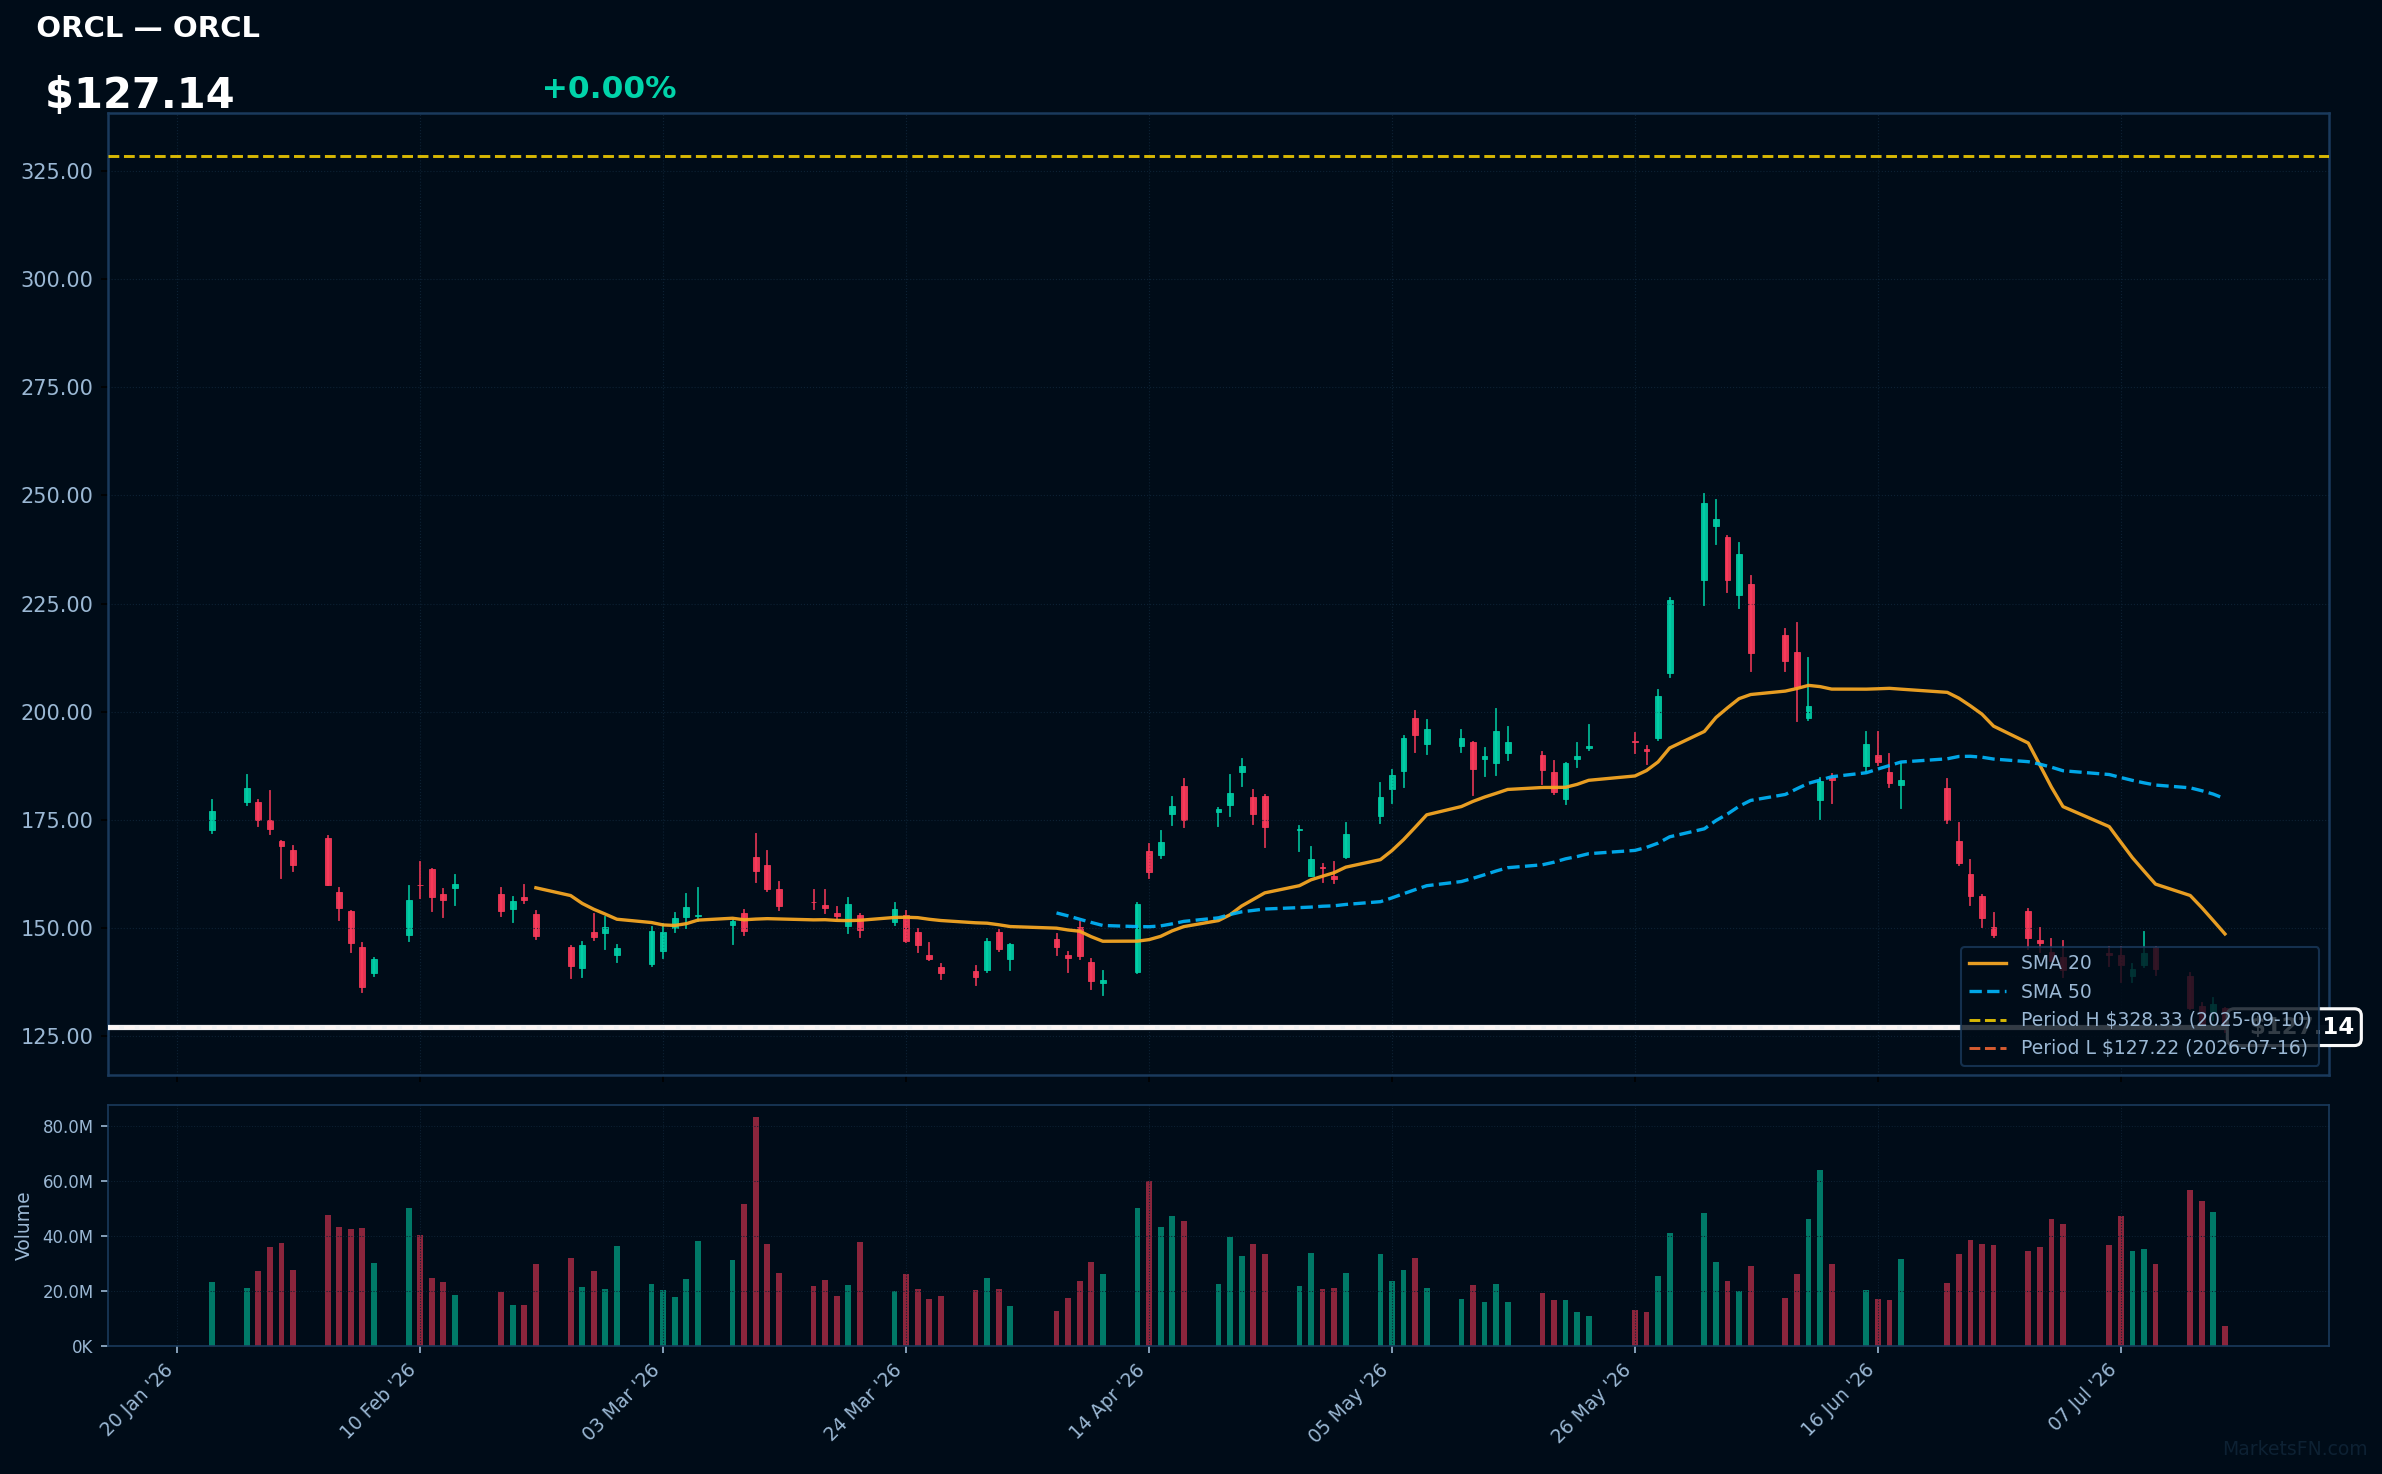
ORCL | Oracle Corp | Technology | Price Last: $127.22 | % Realized: -47.28% | RSI: 28.1 | % above MA200: -33.9% | Trend: Below MA20, MA50, MA200
Oracle Corp is a cloud computing and enterprise software company, providing database management, ERP, and CRM solutions. Investors care about its dominance in the enterprise software market and its transition to cloud-based services.
Oracle Corp's technical situation is bearish, with RSI(14) at 28.1, indicating oversold conditions. The sustained downtrend is evident as price ($127.14) < MA20 < MA50 < MA200, and it's testing major support at its 52-Week low.
Related headlines
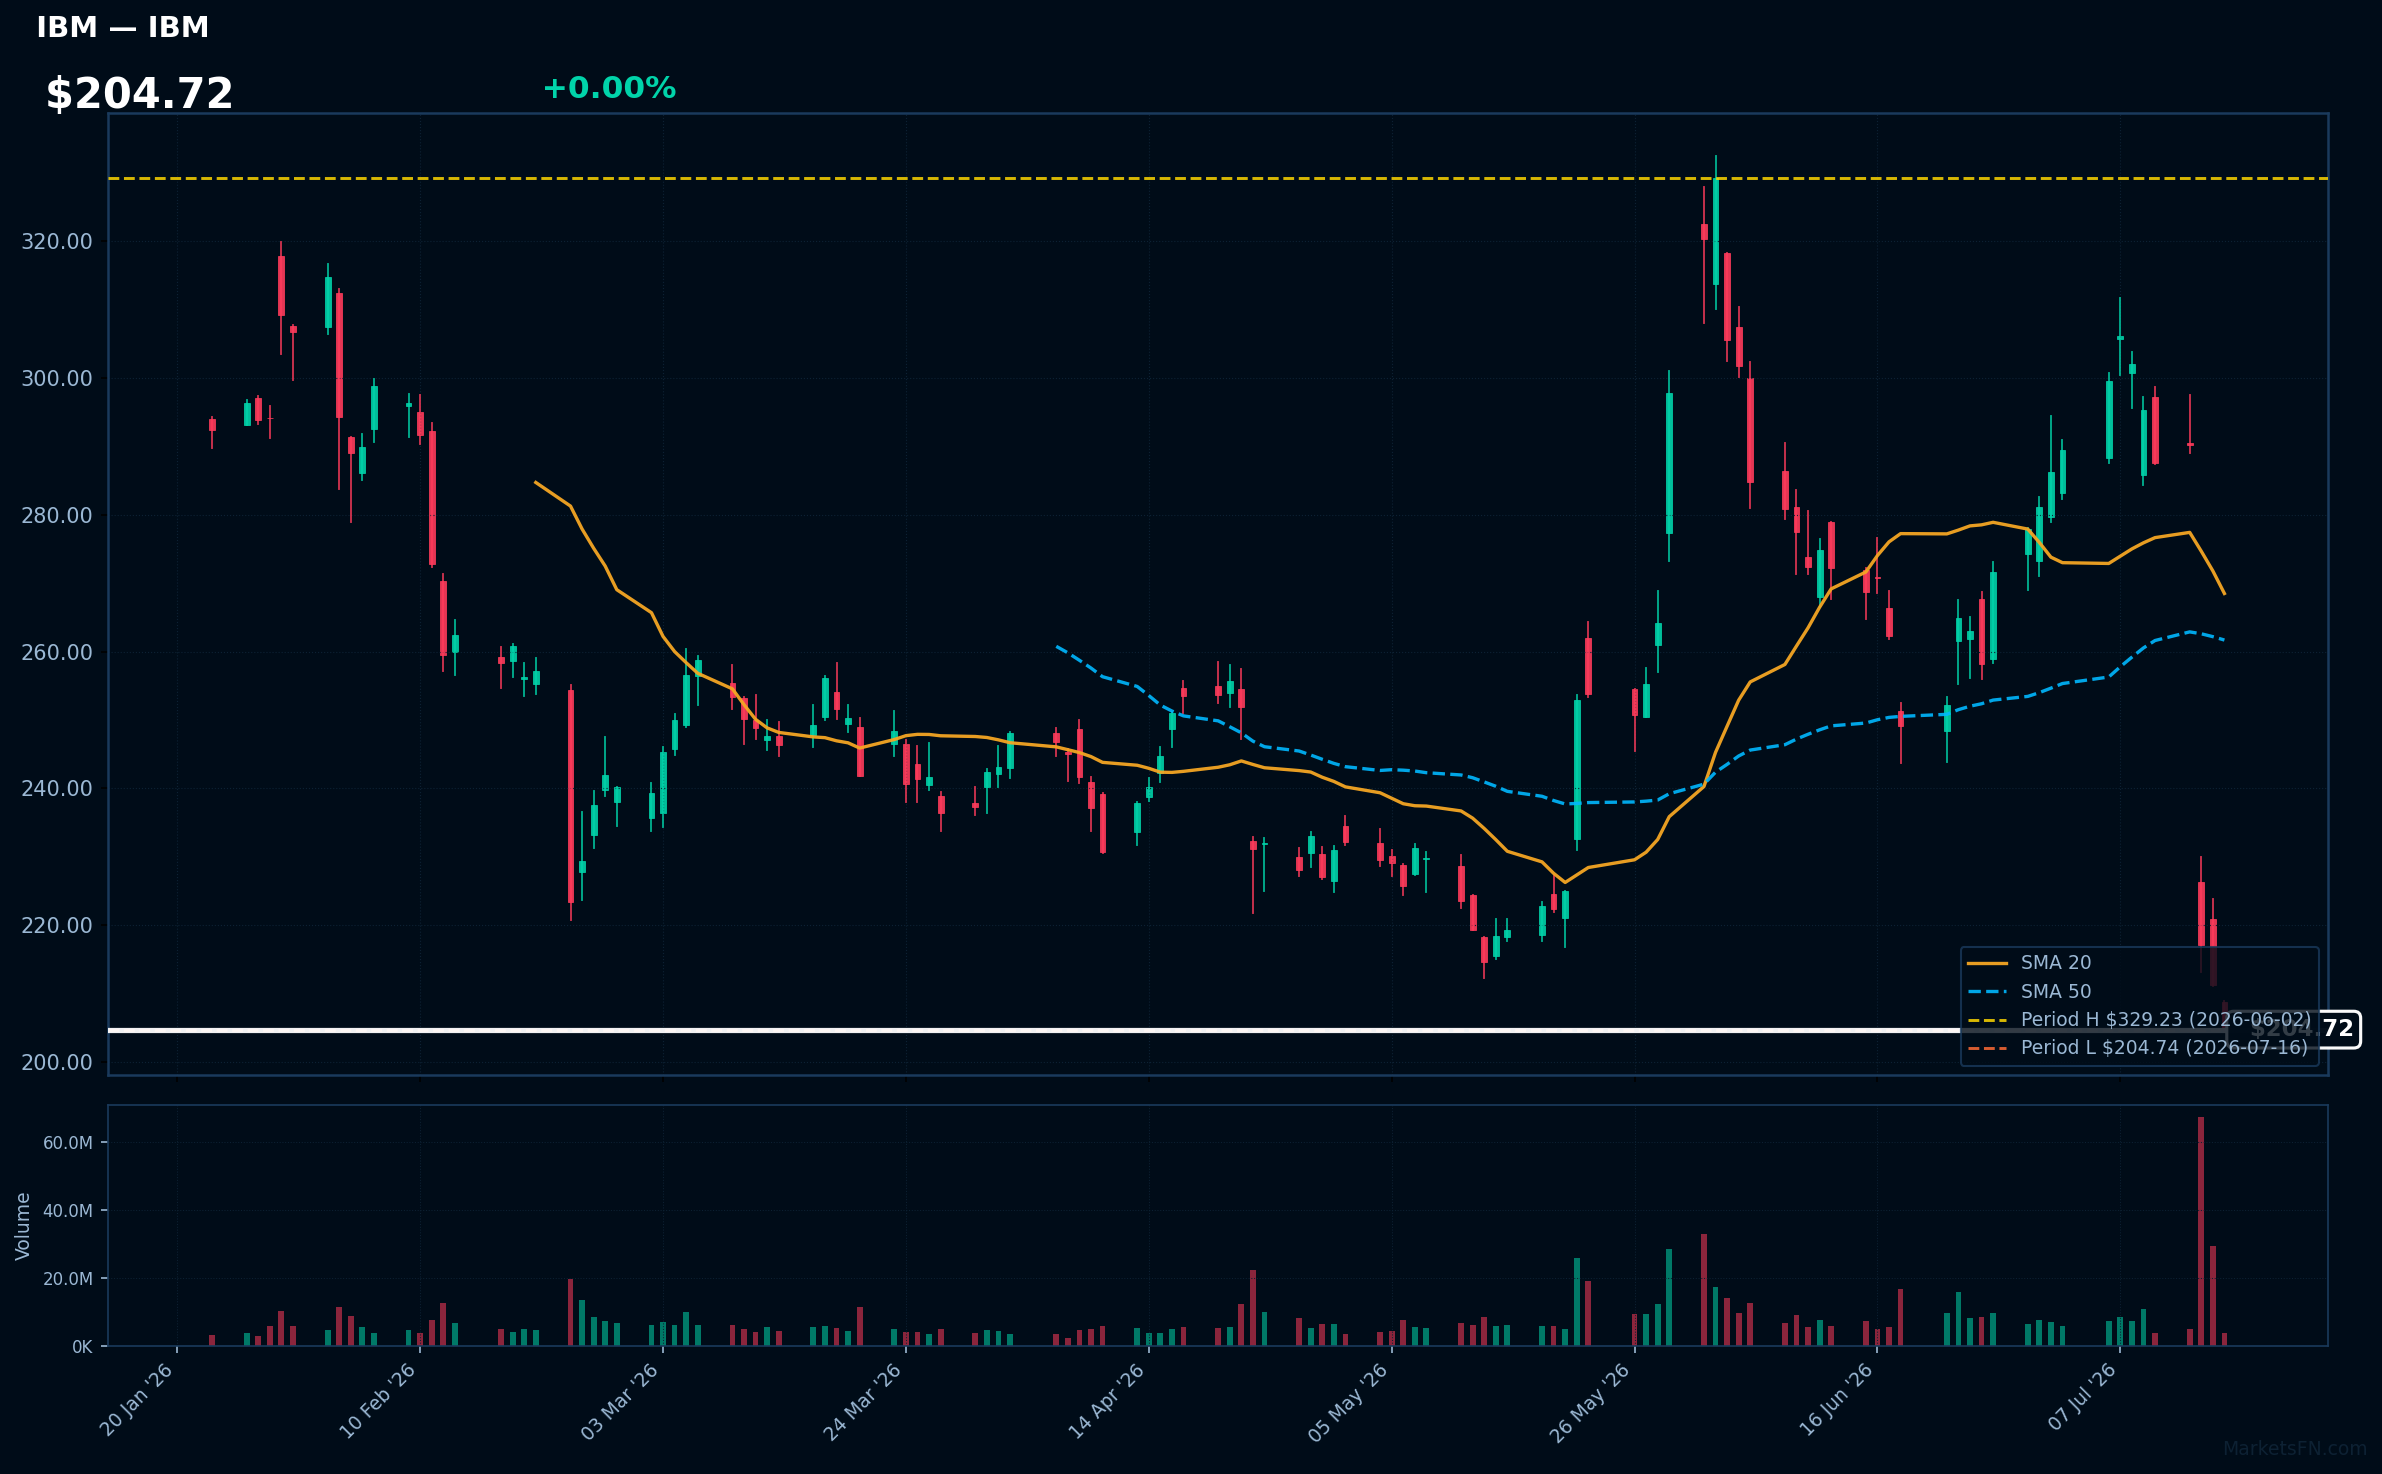
IBM | International Business Machines Corp | Technology | Price Last: $204.74 | % Realized: -27.38% | RSI: 27.9 | % above MA200: -25.3% | Trend: Below MA20, MA50, MA200
International Business Machines Corp (IBM) is a technology company that provides hardware, software, and services, including cloud computing, AI, and IT consulting. Investors care about its transition to high-growth areas like hybrid cloud and AI.
IBM's RSI(14) is 27.9, indicating oversold conditions. It's below MA20, MA50, and MA200, showing bearish trends. The stock is at its 52-Week low, down 27.4% over the period, signaling potential support testing and a warning sign for investors.
Related headlines
- MU, SNDK, SKHY, WDC Stocks Drop Overnight: AI Memory Giants Suffer Reversal As IBM-Driven Rally Fades
- Why Did SPCX, IBM, BSX Drop To 52-Week Lows Today?
- We did not adapt and move quickly enough: IBM CEOs admission of weakness fails to prevent historic 25% stock crash
- Oppenheimer Downgrades IBM Stock After Earnings Miss Triggers Massive Sell-Off
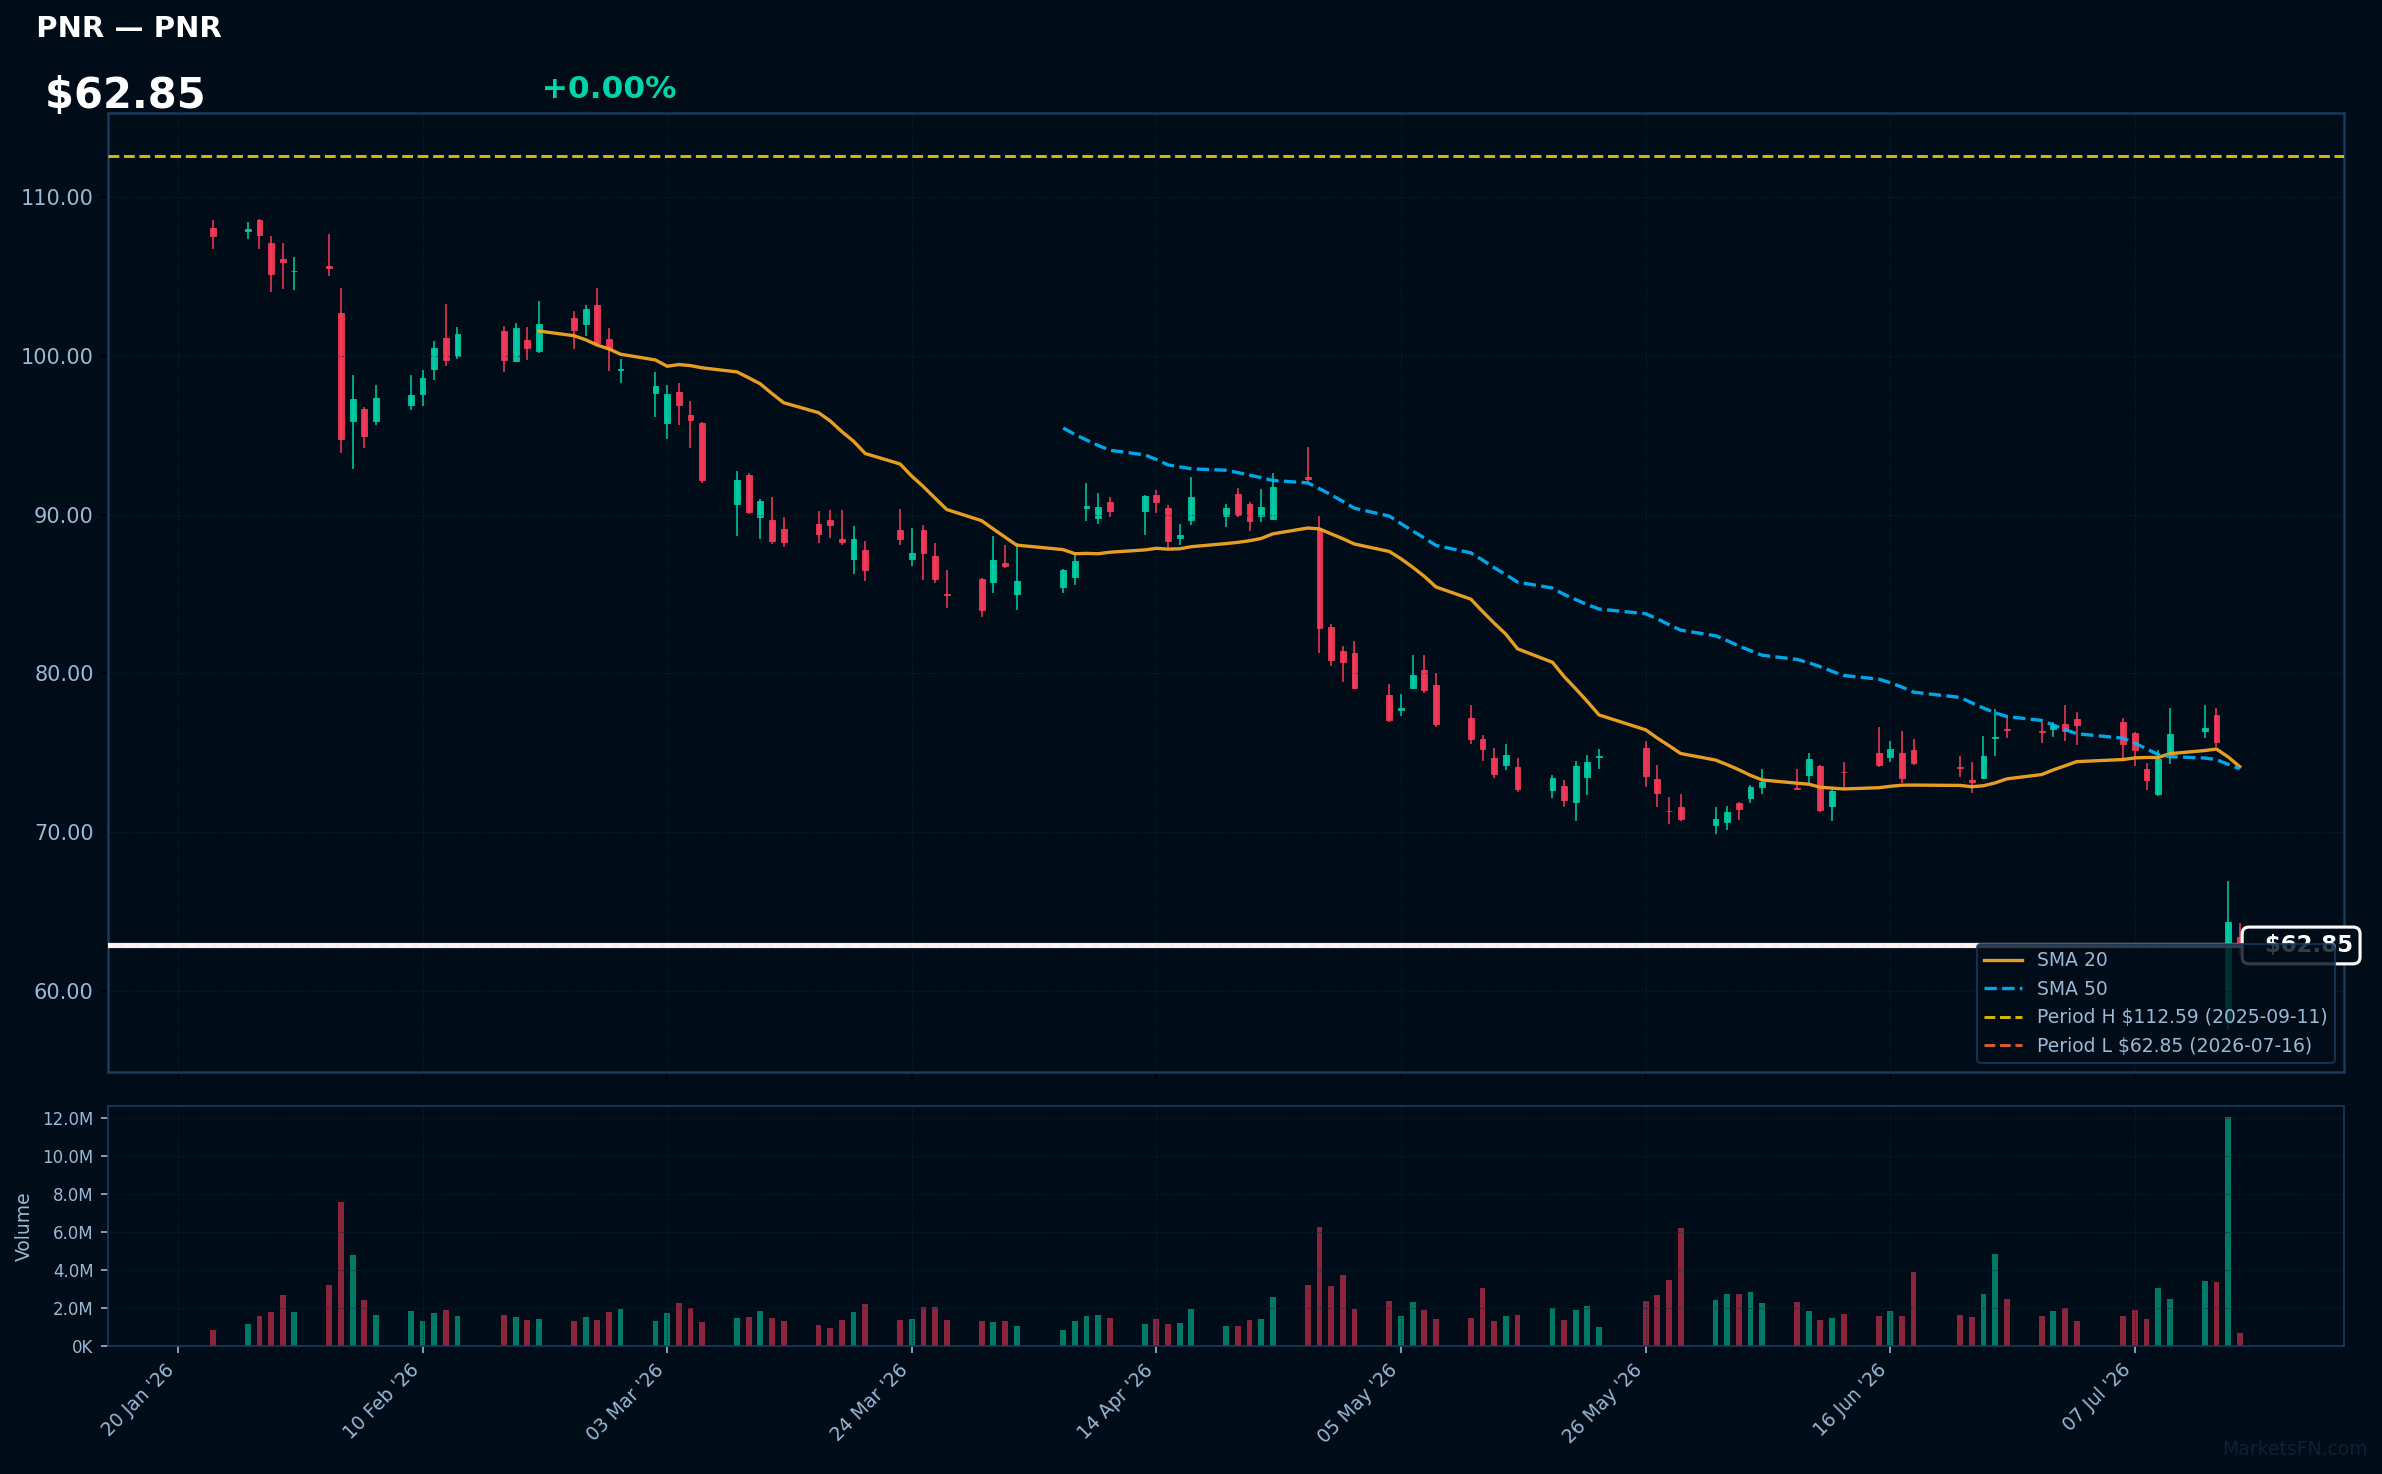
PNR | Pentair plc | Industrials | Price Last: $62.85 | % Realized: -40.07% | RSI: 25.2 | % above MA200: -32.9% | Trend: Below MA20, MA50, MA200
Pentair plc is a global water and fluid solutions provider, offering products and services for water treatment, flow, and filtration. Investors should care about its performance in these markets, as it indicates demand for its solutions and potential for revenue growth.
Pentair plc's technical situation is bearish, with an RSI(14) of 25.2 indicating oversold conditions, and the stock price below MA20, MA50, and MA200, testing major support at its 52-Week low. The -40.1% 52-Week return further highlights the downtrend.
Related headlines
- Pentair Stock Tanks on Slashed Guidance, Weak Earnings, and CFO Resignation
- Pentair shares tumble after profit warning and unexpected CFO departure (PNR)
- Pentair shares plummet after guidance cut, surprise CFO exit
- Pentair Announces Chief Financial Officer Transition and Provides Preliminary Second Quarter 2026 Financial Results, Revises Full Year 2026 Guidance, and Schedules Second Quarter 2026 Investor Call
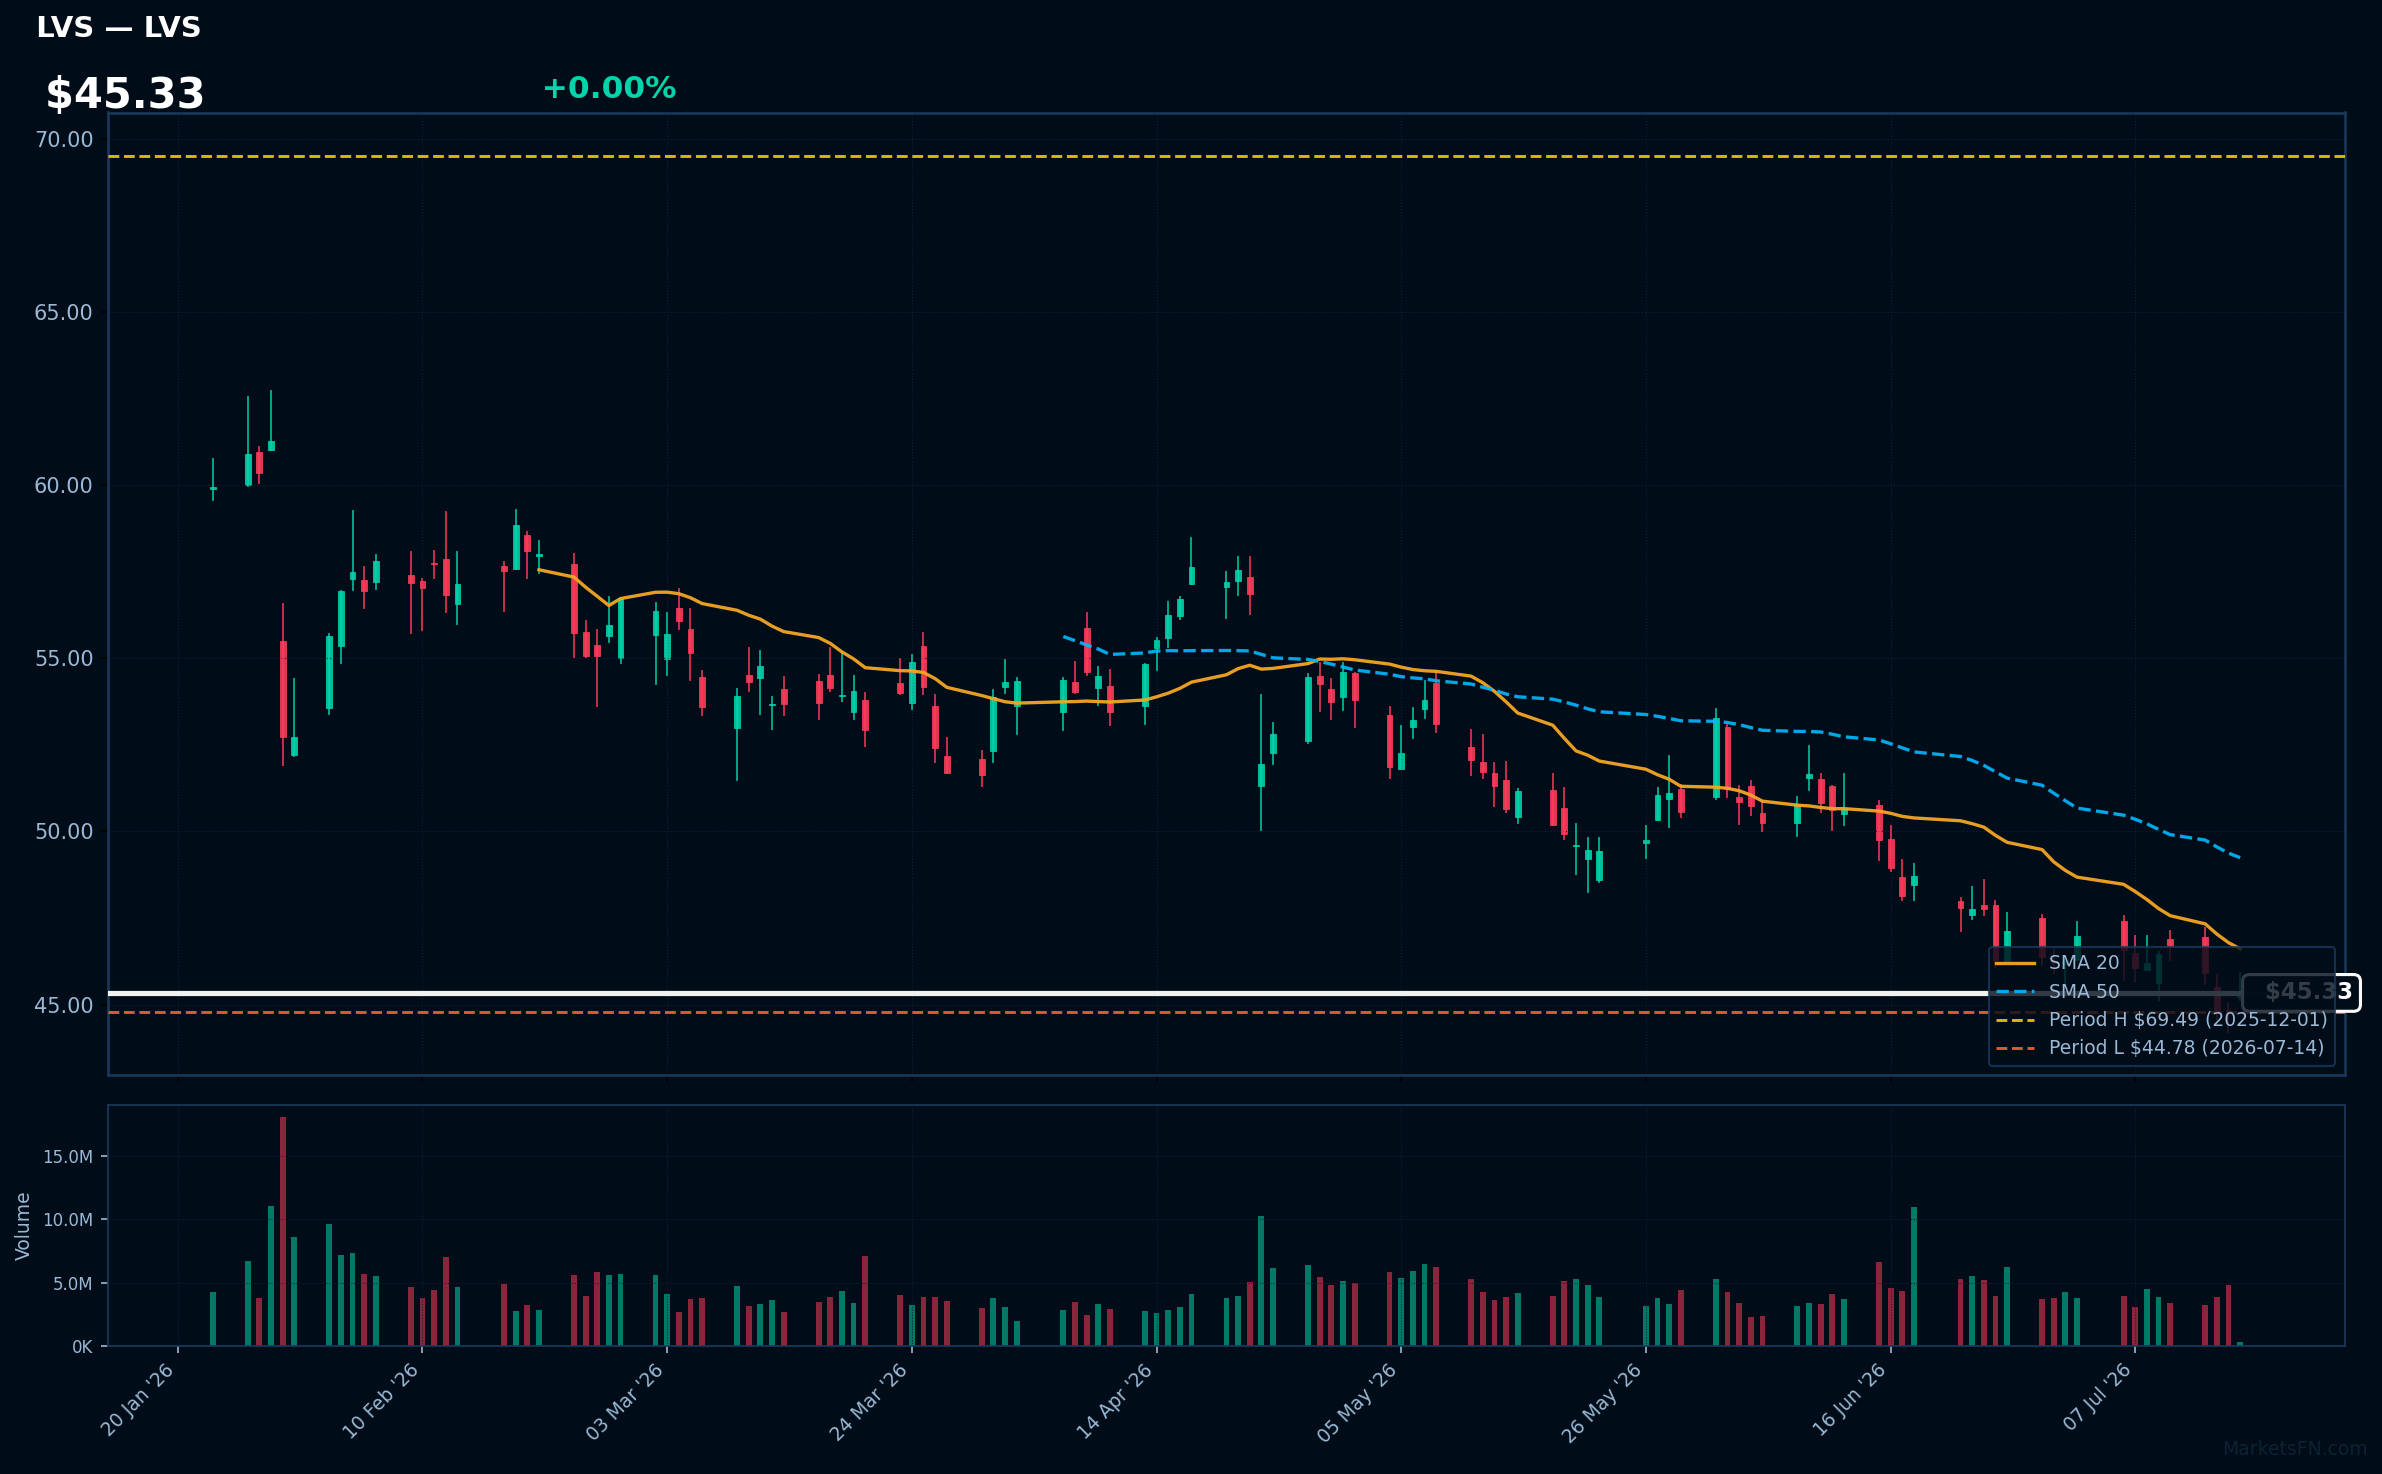
LVS | Las Vegas Sands Corp | Consumer Cyclical | Price Last: $45.37 | % Realized: -7.63% | RSI: 35.8 | % above MA200: -19.2% | Trend: Below MA20, MA50, MA200
Las Vegas Sands Corp operates integrated resorts, including casinos and entertainment venues, primarily in Macau and Singapore, generating revenue through gaming, hospitality, and retail. Investors care due to its exposure to high-growth Asian markets and sensitivity to macroeconomic trends.
LVS is in a sustained downtrend with price ($45.33) below MA20, MA50, and MA200. The RSI(14) is 35.8, near oversold territory, and the stock is 1.3% above its 52-Week low, testing major support, indicating a potential warning sign.
Related headlines
- Same Price, Much Better Business: The LVS Gap
- Nevada Partnership for Homeless Youth and Las Vegas Sands Announce the 2026 Nevada Youth Homelessness Summit is Scheduled for Nov. 13
- Las Vegas Sands Continues its Commitment to Ending Youth Homelessness in Nevada with a $300,000 Donation to Nevada Partnership for Homeless Youth
- Las Vegas Sands Donates $150,000 to The LGBTQ+ Center of Las Vegas for a Workforce Development Program Supporting Housing-Insecure Youth
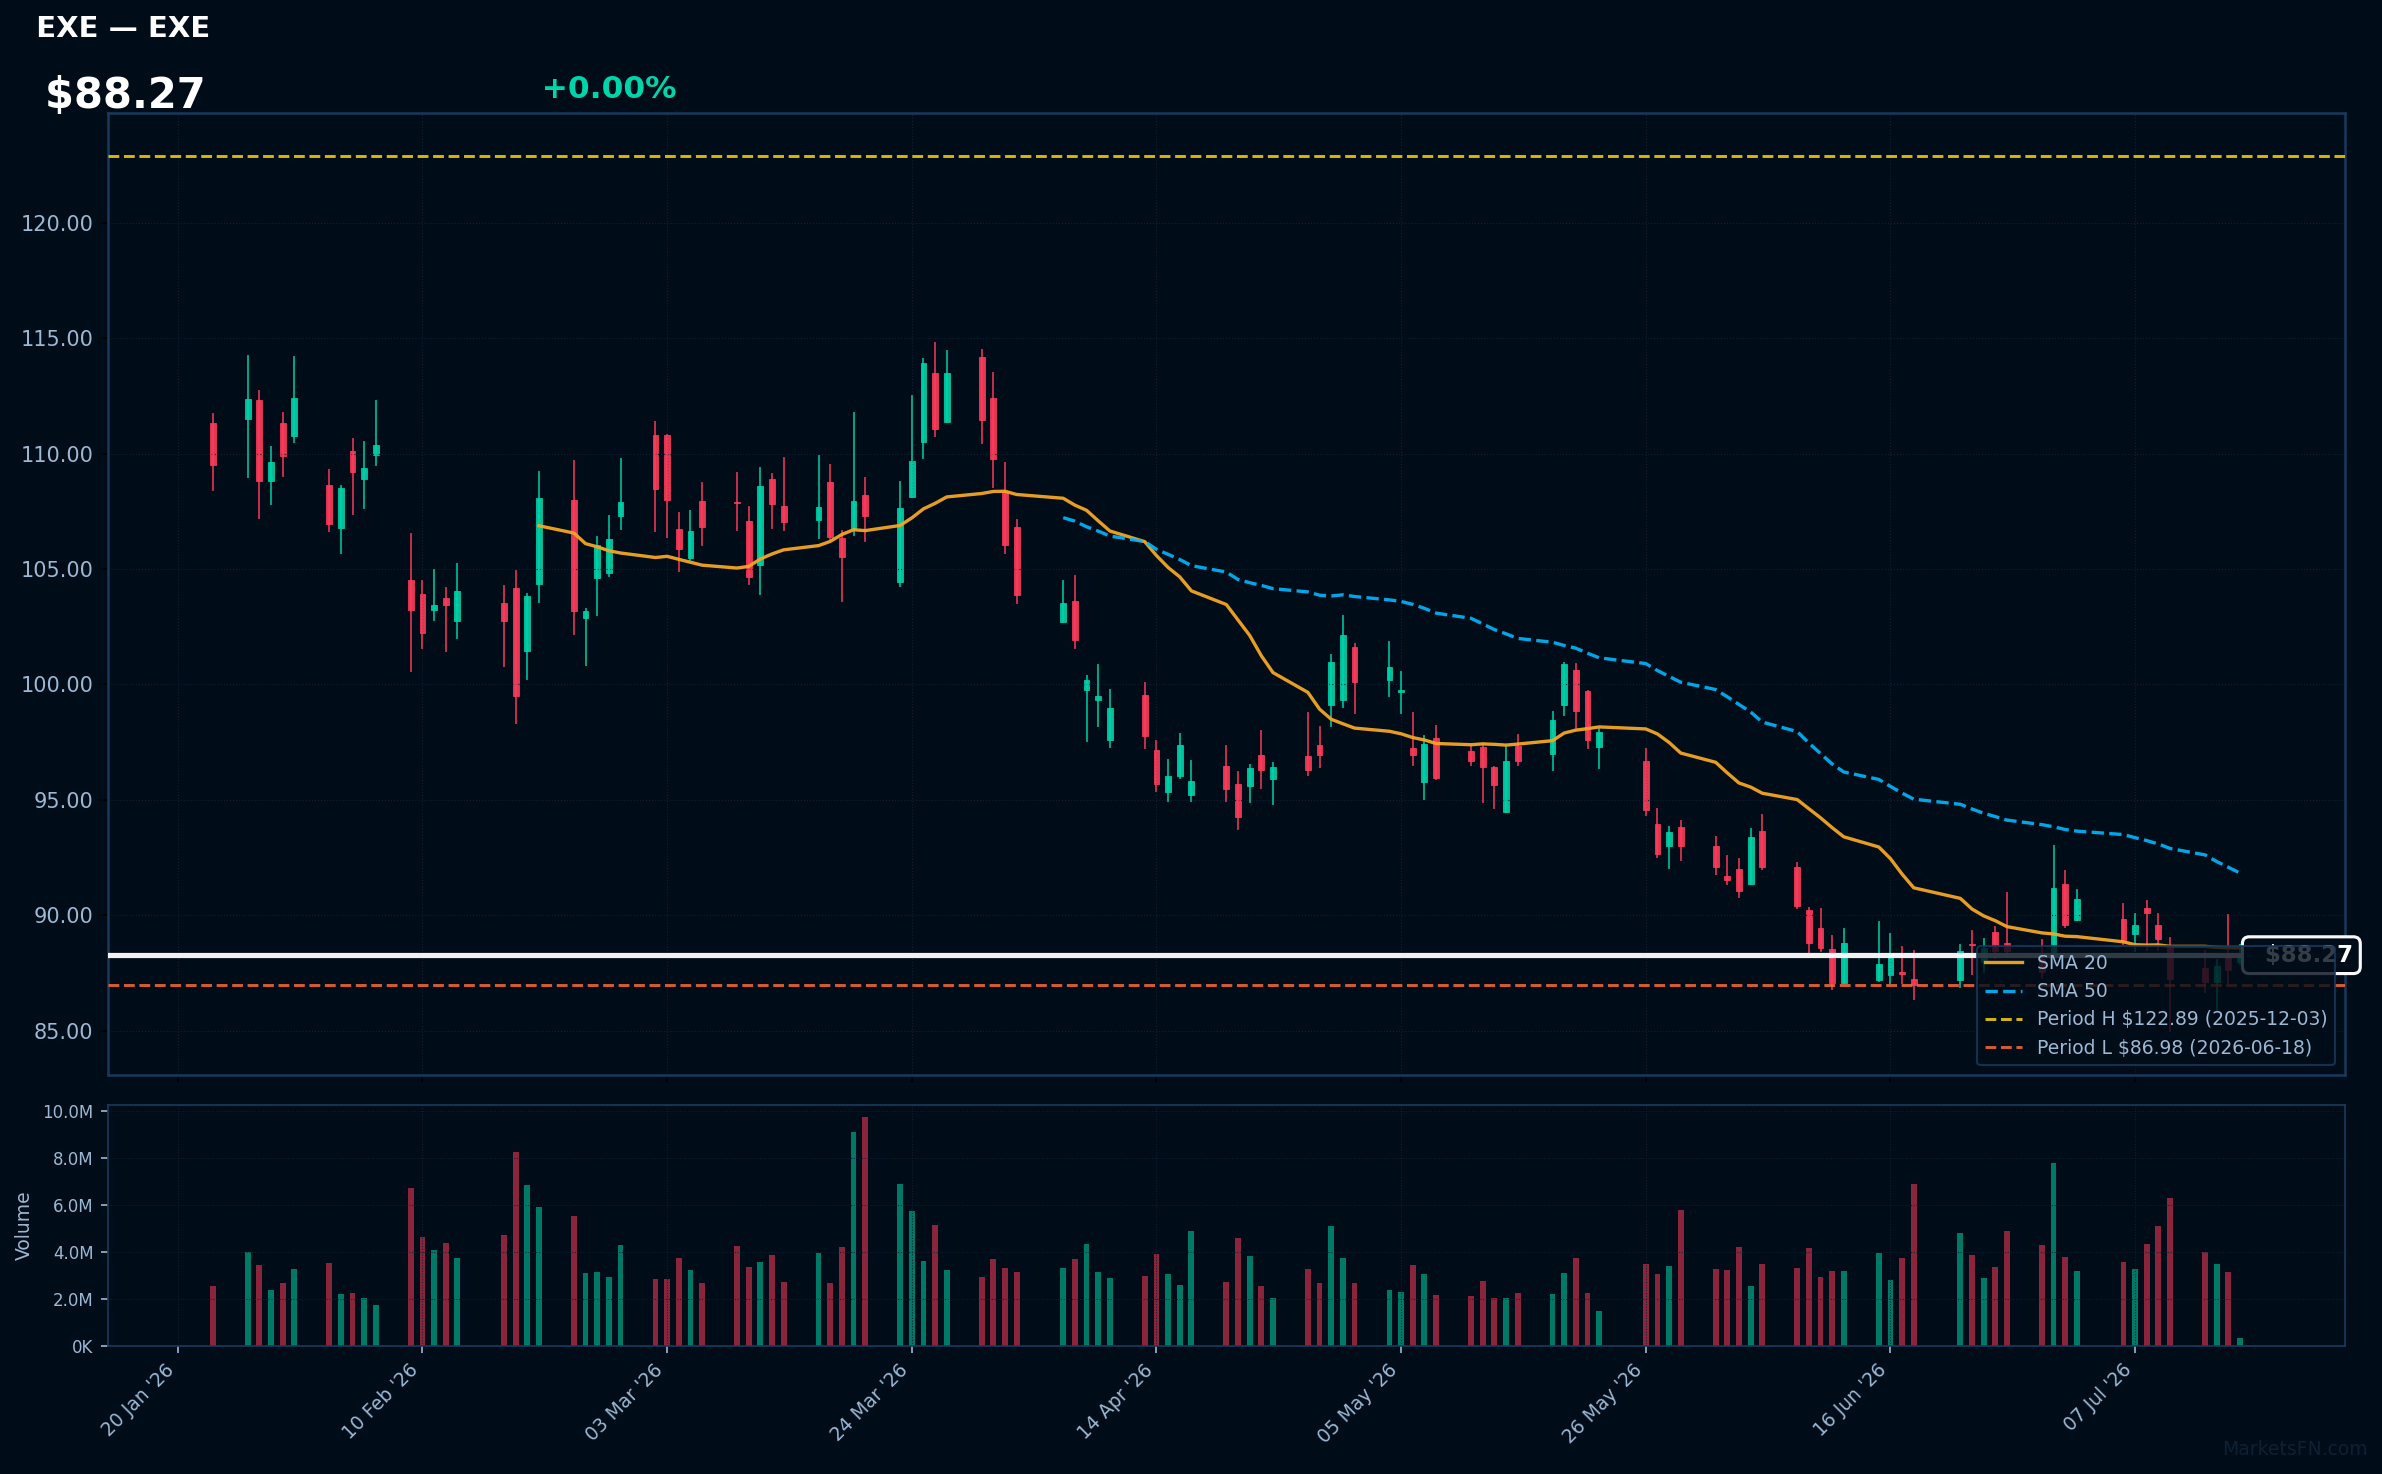
EXE | Expand Energy Corp | Energy | Price Last: $88.32 | % Realized: -18.45% | RSI: 45.1 | % above MA200: -14.6% | Trend: Below MA20, MA50, MA200
Expand Energy Corp's specific business operations and investor relevance are not detailed in the provided data; thus, a factual description cannot be given.
The stock is in a sustained downtrend with price ($88.27) below all MAs (MA20, MA50, MA200), RSI(14) at 45.1, and near its 52-Week low, indicating a warning sign; it's 1.5% above this low, having returned -18.5% over the 52-Week period.
Related headlines
Market Commentary
The S&P 500 stocks listed near 52-week extremes indicate a significant market development. Stocks at 52-week highs, such as AAPL, KO, UNH, UNP, and SBUX, are trading at their highest levels in the past year, suggesting strong investor confidence. Conversely, stocks near 52-week lows, including ORCL, IBM, PNR, LVS, and EXE, may be experiencing challenges or sector-specific headwinds.
The presence of these stocks at extremes may signal sector rotation, with investors favoring certain industries over others. The stocks at 52-week highs are from diverse sectors, including technology (AAPL), consumer staples (KO), healthcare (UNH), industrials (UNP), and consumer discretionary (SBUX). In contrast, the stocks near 52-week lows are primarily from technology (ORCL, IBM) and industrials (PNR), with LVS representing consumer discretionary and EXE representing energy.
Key levels to watch include the 52-week highs and lows for these stocks. Potential catalysts for change include earnings reports, macroeconomic data releases, and industry-specific news. Investors should monitor these developments to gauge the sustainability of current price trends and potential opportunities for sector rotation.
Methodology: All 503 S&P 500 constituents screened. 52-week high = highest daily close over the past 252 trading days (approx. 1 year). 52-week low = lowest daily close over the same period. Distance = (current price / extreme − 1) × 100. Technical indicators computed on up to 1 year of daily OHLCV data.
Disclaimer: For informational purposes only. Not investment advice. Past performance is not indicative of future results.

